
Finance, politics, liberty, faith, family, and Australia. Host of Arbon About Australia.
Joined February 2022
- Tweets 4,446
- Following 371
- Followers 6,467
- Likes 10,144
1,478 Photos and videos


On this week's Arbon About Australia with @FlowFMAustralia we discussed:
🛢 “Let the oil flow”, peace in the middle east?
💰 Cash rate expectations cooling. Is a recession looming?
⛽️ Fuel security, gas taxes & domestic reservation.
📈 Labor’s migration exceeds their forecasts
🏠 House price growth factors
🛬 Pegging migrant numbers to new homes built
👷♂️ Unionist support drifting toward One Nation
Listen to the show for free via the link in the comments.
1
11
Listen to the show here:
spreaker.com/podcast/arbon-a…
iheart.com/podcast/1333-arbo…

6
"I wish there was a way to know you're in the good old days before you've actually left them."
- Andy Bernard, The Office
It's a clever line from my favourite comedy series, but perhaps it's wiser than many of us realised.
Too often we focus on what is missing, the opportunities we didn't get, the mistakes we made, or the things we wish were different.
If we could somehow jump forward ten or twenty years and look back at our lives today, I suspect many of us would see things very differently.
The conversations around the dinner table.
The laughter of our children.
The embrace of a spouse.
The friendships and community we take for granted.
The ordinary moments that seem so unremarkable at the time.
For me, I have a wife I love, children who fill our home with life, and a faith that brings me peace.
These are the good old days.
Perhaps the challenge is not to recognise them after they're gone, but to acknowledge them in the moment.
A society that spends less time dwelling on what is wrong and more time appreciating what is right would be a happier, stronger, and more grateful one.
The good old days may not be behind us.
They may be happening right now.
1
6
94
43 is the peak tax age of an Australian.
The average 43-year-old hands over $59,000 a year in income tax, superannuation tax, consumption, and other levies.
A 20-year-old's total tax paid is $13,500, and for a 30-year-old, it is $37,000. A 50-year-old pays $57,000, a 60-year-old $48,500, and a 70-year-old $27,500.
People in their 40s typically earn higher wages, so their income and the 15% tax collected on their superannuation contributions typically are bigger, while raising families means higher household spending and consumption taxes paid.
It’s not just Aussies in their forties paying high taxes, OECD research has found that income tax rates for Australian workers earning the average wage are among the highest in its 38 member countries, behind only Denmark, Iceland, and Belgium.
Thanks @JEChalmers
7
18
80
2,450
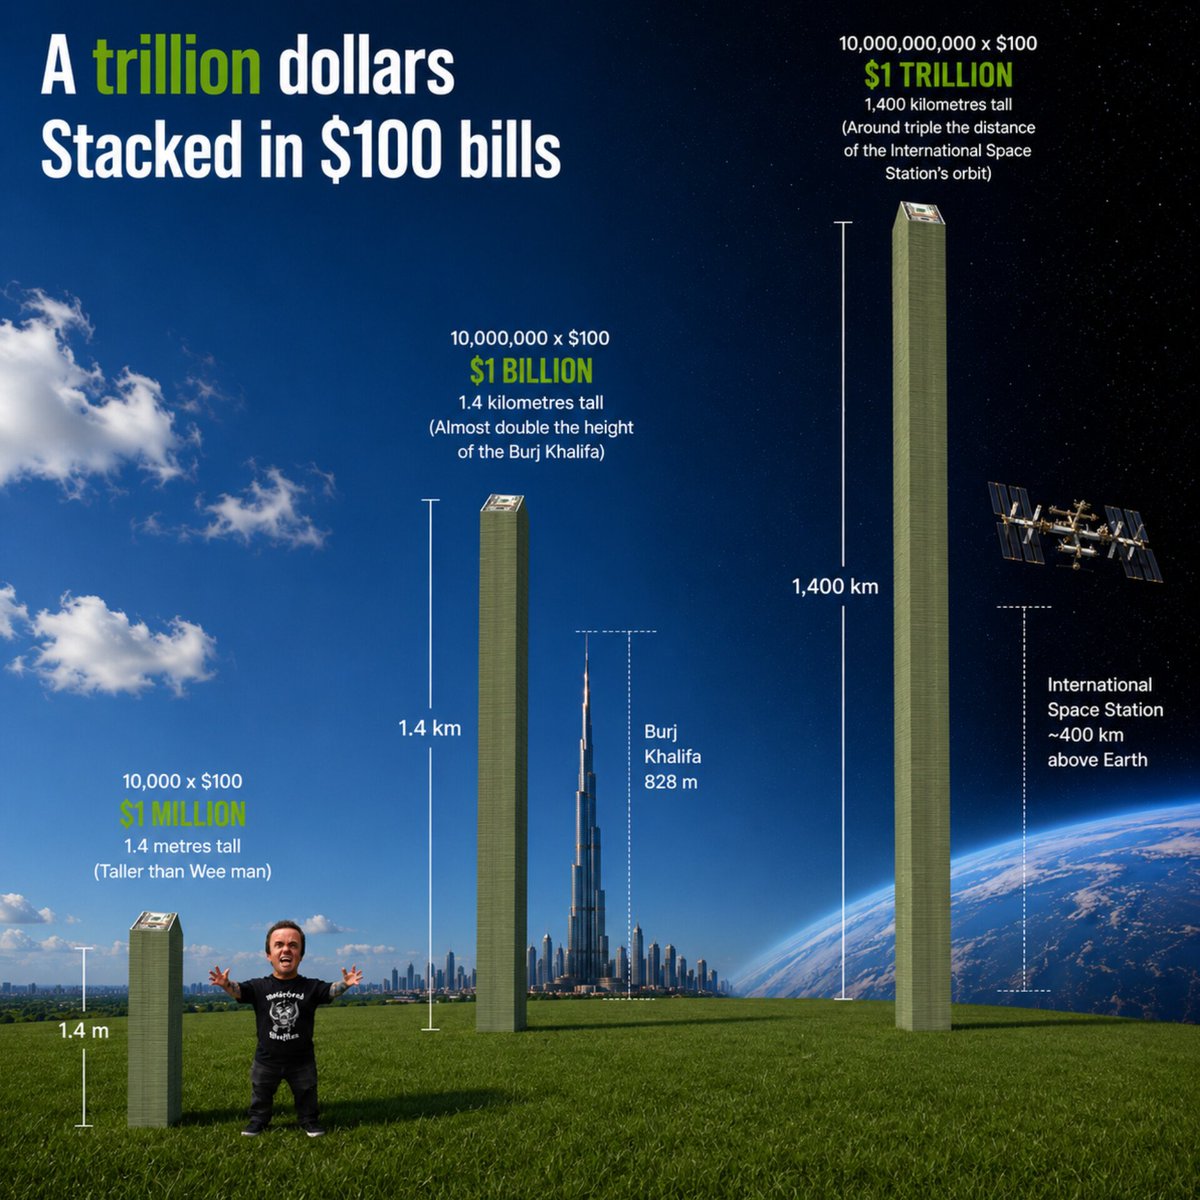
As a loyal @Starlink customer and @X subscriber, I've played a very small role in creating the world's first trillionaire, @elonmusk.
To put a trillion dollars into perspective:
- $1 million in $100 notes is a stack 1.4 metres high.
- $1 billion is a stack 1.4 kilometres high.
- $1 trillion is a stack 1,400 kilometres high.
A trillion is an extraordinary amount of money.
1
1
3
195
Calculations:
$100 bank note thickness = 0.1408 mm
10,000 x $100 = $1 million = 1.4 metres tall
10,000,000 x $100 = $1 billion = 1.4 kilometres tall
10,000,000,000 x $100 = $1 trillion = 1,400 kilometres tall
1
1
118

Jun 14
This water costs more than it should.
So does your electricity.
So does your transport.
And so do countless other goods and services.
Across Australia, businesses are spending billions on carbon offsets.
Those costs don't just disappear.
The consumer always pays.
2
7
20
389
Jun 13
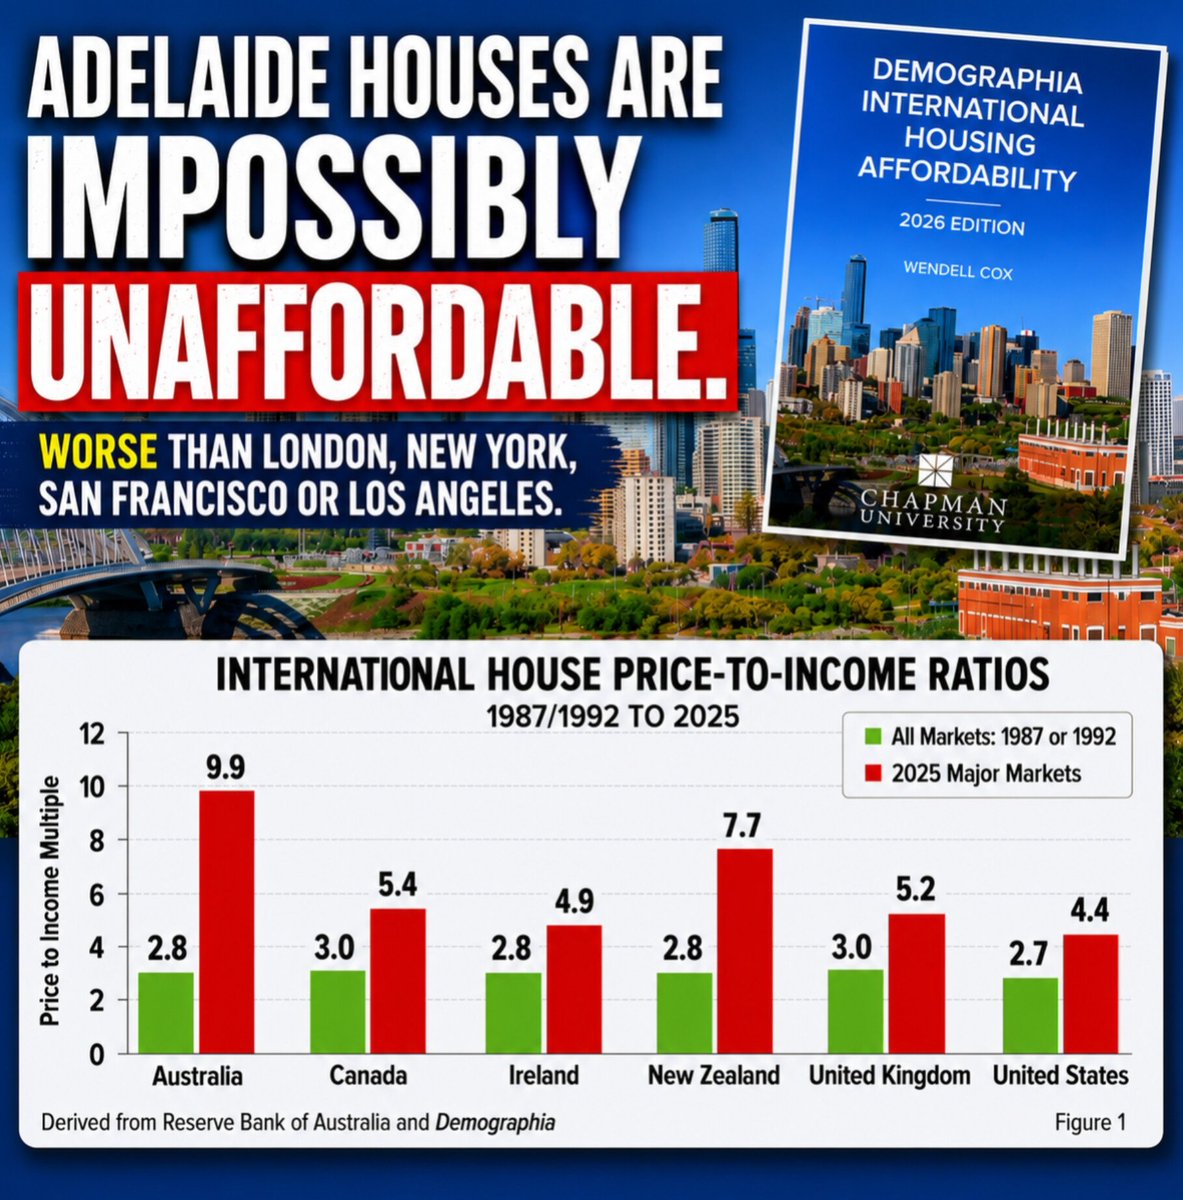
Adelaide houses are impossibly unaffordable. Less affordable than London, New York, San Francisco or Los Angeles.
Adelaide homes sell for a median multiple of 11.2 times household income.
When the median house price is divided by median household income, it produces the median multiple figure.
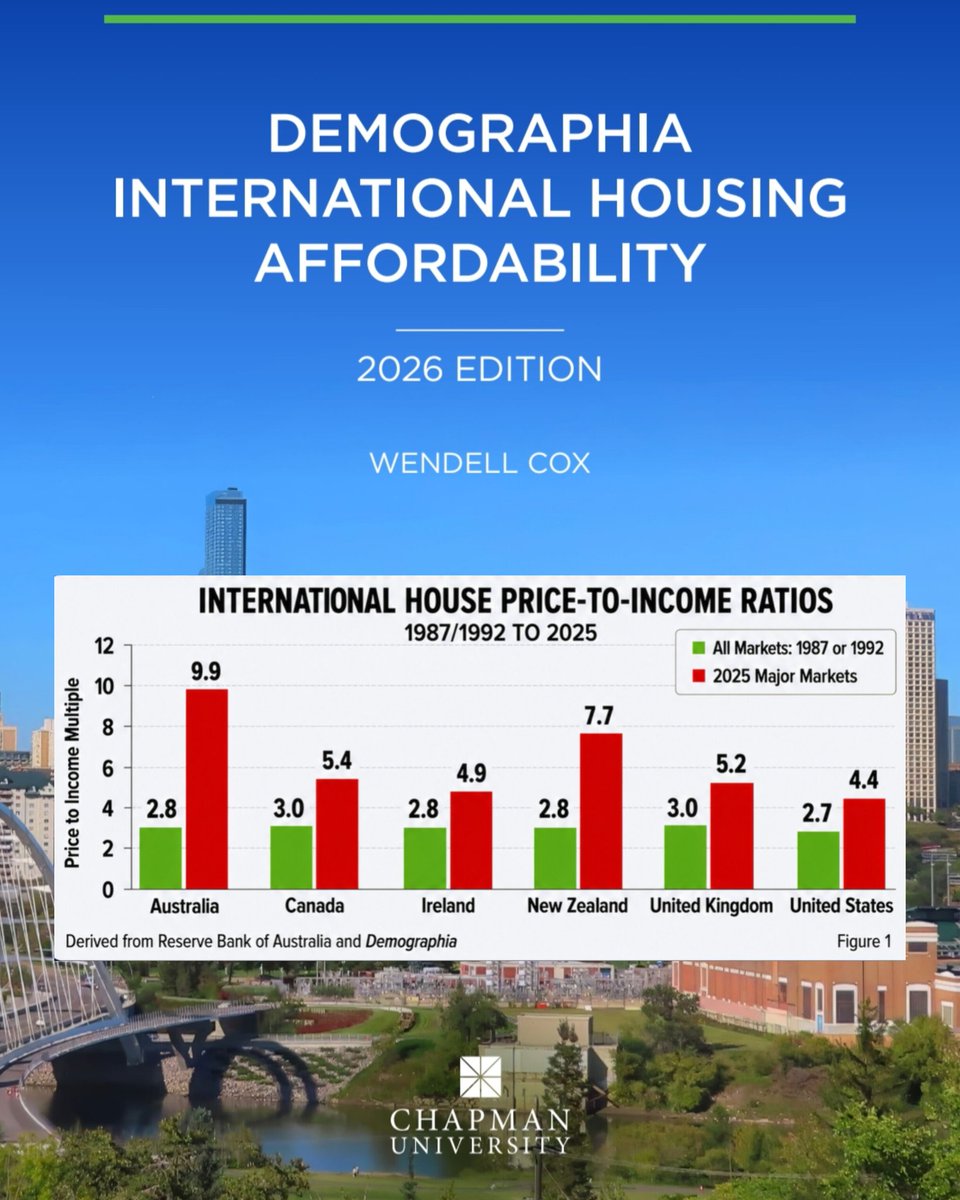
In 1987, the median multiple for Australian houses sat at 2.8 times income. In 2025, that multiple hit a whopping 9.9!
The median multiple is an imperfect measure of affordability because it does not adequately account for factors like the changed cost of borrowing, but it does remain a widely used measure of global housing affordability.
According to the Demographia International Housing Affordability report, affordability can be categorised as follows:
3.0 & under : Affordable
3.1 to 4.0: Moderately Unaffordable
4.1 to 5.0: Seriously Unaffordable
5.1 to 8.9: Severely Unaffordable
9.0 & Over: Impossibly Unaffordable
Many cities in the USA, Canada, Singapore, and UK have median homes selling for 3 - 5 times household income.
How does Australia compare?
Sydney: 2nd least affordable in the world at 14.0x
Adelaide: 4th least affordable at 11.2x
Brisbane: 8th least affordable at 9.9x
Melbourne: 9th least affordable at 9.5x
Perth: 13th least affordable at 8.0x
By global standards, Australian housing is extraordinarily expensive.
Government has played a big role in creating this problem.
Lack of land release, massive taxes, fees and charges, repeated demand side stimuli, overregulation, unsustainable migration, and loose home lending conditions have all contributed.
The high price of housing has made many slaves to debt.
Two full-time incomes are often insufficient to purchase a home, even with a 20% deposit.
High house prices hurt renters just as much as homebuyers.
Shared equity schemes (with the government), 95% loans (guaranteed by taxpayers), and first home owner grants (paid for by taxpayers) all lead to higher priced and less affordable homes.
Higher taxes are not the solution.
Australian housing needs more land release, lower taxes, lower migration, less red and green tape, and far less taxpayer funded demand side stimuli.
6
4
21
594
Jun 13
2026 Demographia report: share.google/qSzH7X1F38x4DtB…
2.8x in 1987: morningstar.com.au/personal-…
1
152
Jun 12
Adelaide houses are impossibly unaffordable. Less affordable than London, New York, San Francisco, or Los Angeles.
Adelaide homes sell for a median multiple of 11.2 times household income.
When the median house price is divided by median household income, it produces the median multiple figure.
In 1987, the median multiple for Australian houses sat at 2.8 times income. In 2026, that multiple hit a whopping 11.2!
The median multiple is an imperfect measure of affordability because it does not adequately account for factors like the changed cost of borrowing, but it does remain a widely used measure of global housing affordability.
According to the Demographia International Housing Affordability report, affordability can be categorised as follows:
3.0 & under : Affordable
3.1 to 4.0: Moderately Unaffordable
4.1 to 5.0: Seriously Unaffordable
5.1 to 8.9: Severely Unaffordable
9.0 & Over: Impossibly Unaffordable
Many cities in the USA, Canada, Singapore, and UK have median homes selling for 3 - 5 times household income.
How does Australia compare?
Sydney: 2nd least affordable in the world at 14.0x
Adelaide: 4th least affordable at 11.2x
Brisbane: 8th least affordable at 9.9x
Melbourne: 9th least affordable at 9.5x
Perth: 13th least affordable at 8.0x
By global standards, Australian housing is extraordinarily expensive.
Government has played a big role in creating this problem.
Lack of land release, massive taxes, fees and charges, repeated demand side stimuli, overregulation, unsustainable migration, and loose home lending conditions have all contributed.
The high price of housing has made many slaves to debt.
Two full-time incomes are often insufficient to purchase a home, even with a 20% deposit.
High house prices hurt renters just as much as homebuyers.
Shared equity schemes (with the government), 95% loans (guaranteed by taxpayers), and first home owner grants (paid for by taxpayers) all lead to higher priced and less affordable homes.
Higher taxes are not the solution.
Australian housing needs more land release, lower taxes, lower migration, less red and green tape, and far less taxpayer funded demand side stimuli.
9
7
32
1,385
Jun 12
2026 Demographia report: share.google/qSzH7X1F38x4DtB…
2.8x in 1987: morningstar.com.au/personal-…
252
Jun 11
Voters elect politicians to make decisions.
Far too much taxpayer money is spent on consultants, reviews, and experts when governments should simply be delivering the promises they took to the election.
2
1
8
359
Jun 11
You can listen to this episode in full or any of the previous episodes of Arbon About Australia with @FlowFMAustralia here:
spreaker.com/podcast/arbon-a…
298
Jun 11
On this week's Arbon About Australia on @FlowFMAustralia we discussed:
- Premier @PMalinauskasMP spending $4 million a day on consultants
- South Australia's debt blowout
- A city-centric focus means regional SA misses out
- Victorians finally turn on @VictorianLabor and @JacintaAllanMP?
- Crime and economic pressures are driving political change.
- Gun buybacks and speech restrictions are unnecessary
- Why you can't build a cheap house
- NDIS reform is difficult, but tough decisions can't be avoided
Listen to the show for free via the link in the comments.
1
1
1
265
Jun 10
Housing supply issues won't be solved by more government intervention.
The real problem is the regulations, taxes and bureaucratic hurdles that make homes harder and more expensive to build.
If you want a cheap house, you should be allowed to build one.
3
3
12
300
Jun 10
You can listen to this episode in full or any of the previous episodes of Arbon About Australia with @FlowFMAustralia here:
spreaker.com/podcast/arbon-a…
3
186
Jun 9
Premier @PMalinauskasMP may enjoy a near-perfect public image, but South Australia’s finances tell a different story.
By 2030, South Australia’s net debt is projected to reach $53.7 billion.
With a current population of 1.9 million people, that's $28,118 of debt for every man, woman and child in the state.
Interest alone is forecast to cost South Aussies $2.93 billion per year (>$8 million every day)!
Victoria is often ridiculed for its financial position.
By 2030, Victoria is projected to have net debt of $199.3 billion and annual interest costs of $11.82 billion, almost $32.4 million per day.
Victoria's projected net debt per person in 2030 is $28,053.
South Australia is on track to carry more net debt per person than Victoria. Not exactly the gold standard.
Thanks @alpsa!
9
28
61
4,651
Jun 9
The raw numbers:
SA: 1,908,200 people, $53,654,000,000 net debt and $2,928,000,000 interest cost/annum by 29/30
VIC: 7,104,300 people, $199,300,000,000 net debt and $11,820,000,000 interest cost/annum by 29/30
ABS Population Data: abs.gov.au/statistics/people…
SA Net Debt: statebudget.sa.gov.au/budget…
VIC Net Debt: budget.vic.gov.au/budget-pap…
3
1
11
341