
Joined May 2021
- Tweets 2,521
- Following 259
- Followers 9,057
- Likes 4,174
1,157 Photos and videos


17 Nov 2025
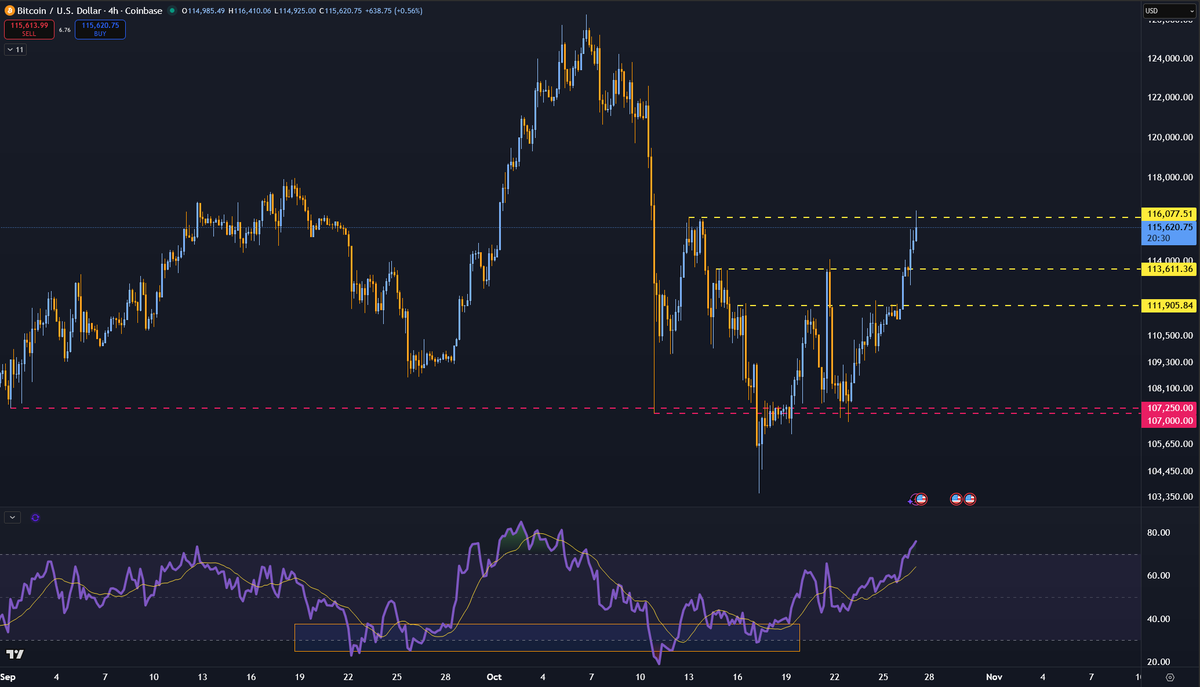
For the past week, trad markets have been "pricing-in" Epstein files release, pulling the already weak crypto market lower.
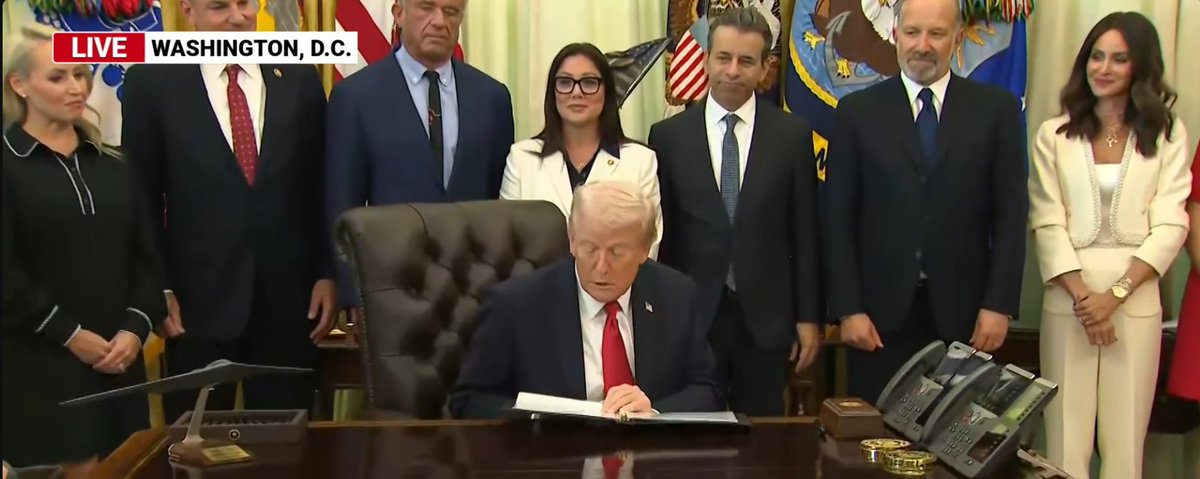
Now Trump urges Congress to vote "yes" on releasing the documents.
I guess, a little bit more drama, then a relief rally.
17 Nov 2025

BREAKING: In a sudden turn of events, President Trump tells Congress to "release the Epstein files."
3
1
35
7,547
16 Nov 2025
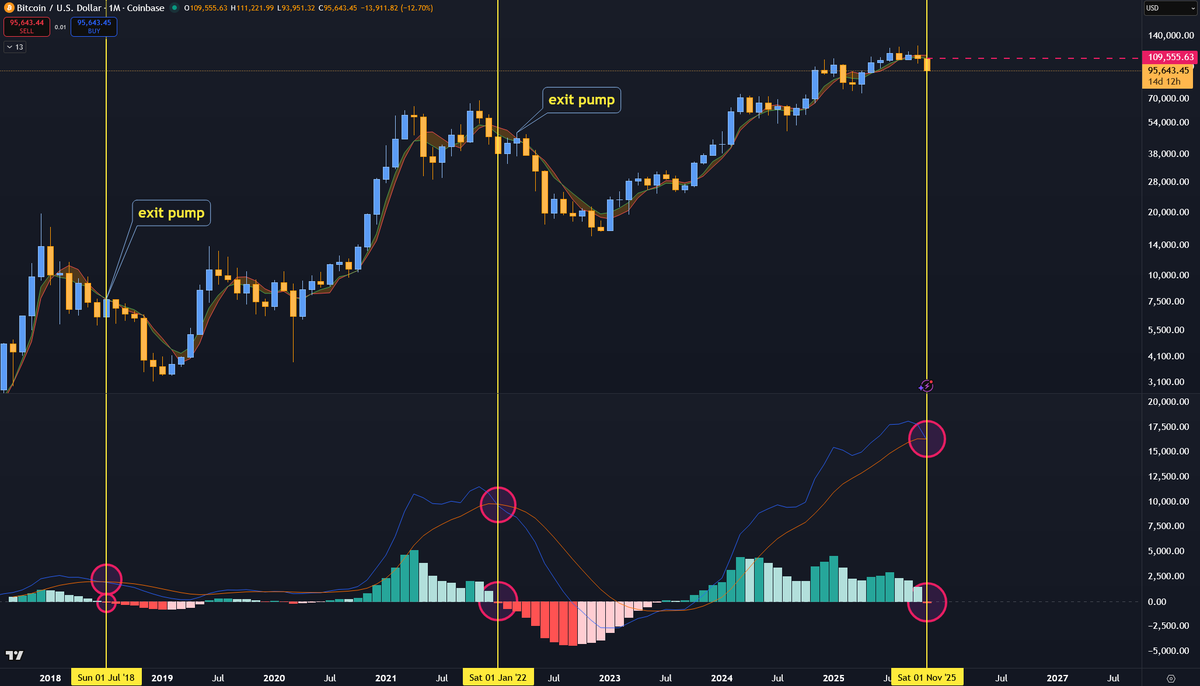
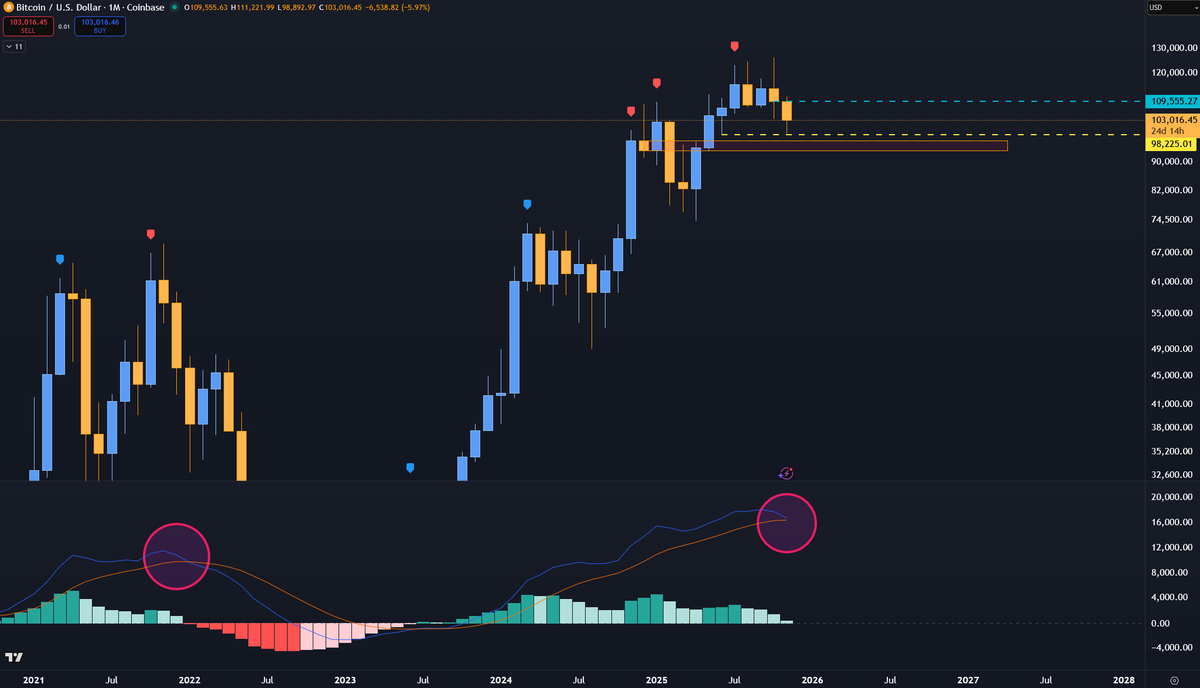
$BTC Monthly MACD
Every time MACD (blue) has crossed the signal line (red) on the Monthly time-frame, we were already in the early stages of a bear-market (the MACD histogram also turns red for the first time in YEARS)
The (only) good news is that we typically get an "exit pump" within weeks of this MACD bearish cross.
That "exit pump" usually stops around 20W MA & 21W EMA.
Safest play here is to sell the pump until proven otherwise.
By the way, the only way this closes without a bearish cross is if we somehow manage to close the monthly candle green.. which means.. above 109.555.. yeah.. 😅
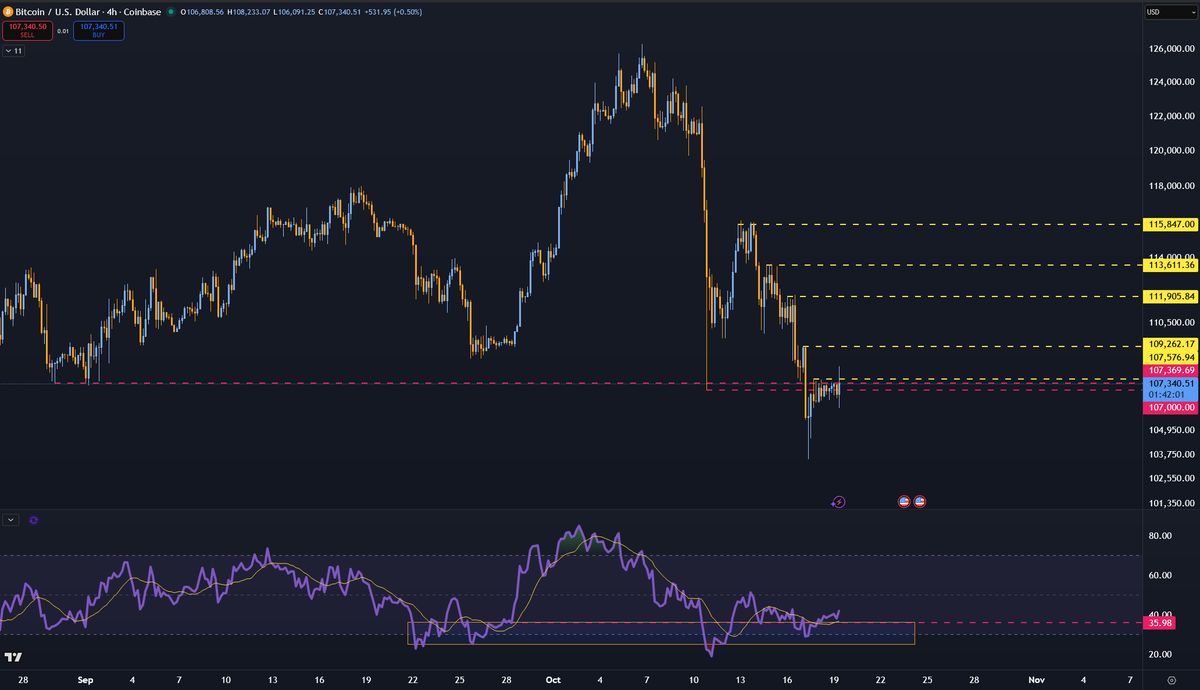
14 Nov 2025

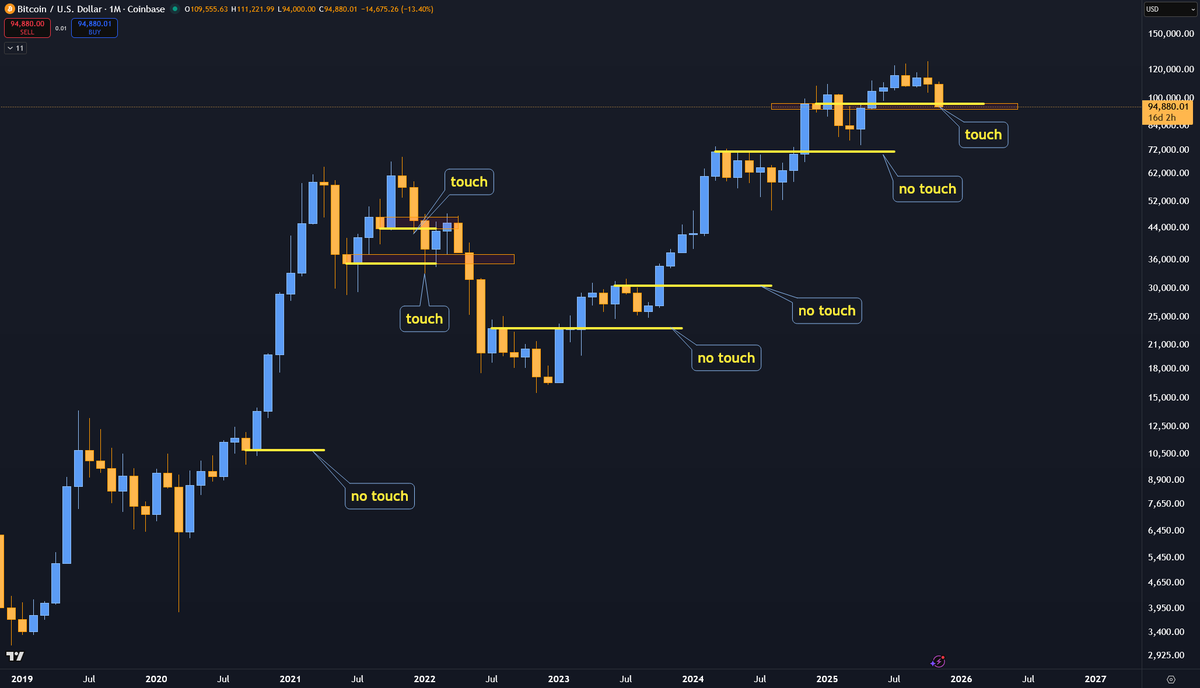
Good news; BTC monthly levels have a tendency to provide a bounce when visited for the first time.
Bad news; Bounces on monthly levels usually get sold (they mostly function like automatic reactions) because when BTC is actually strong it front-runs monthly levels.
🤷♂️
5
4
77
9,505
14 Nov 2025
Good news; BTC monthly levels have a tendency to provide a bounce when visited for the first time.
Bad news; Bounces on monthly levels usually get sold (they mostly function like automatic reactions) because when BTC is actually strong it front-runs monthly levels.
🤷♂️
4
2
65
13,841
7 Nov 2025
Yesterday, during my YouTube Livestream, I pitched the idea of an upcoming short-squeeze on battered alts, like XPL
Seems like some of you were listening <3
7
1
44
5,768
6 Nov 2025
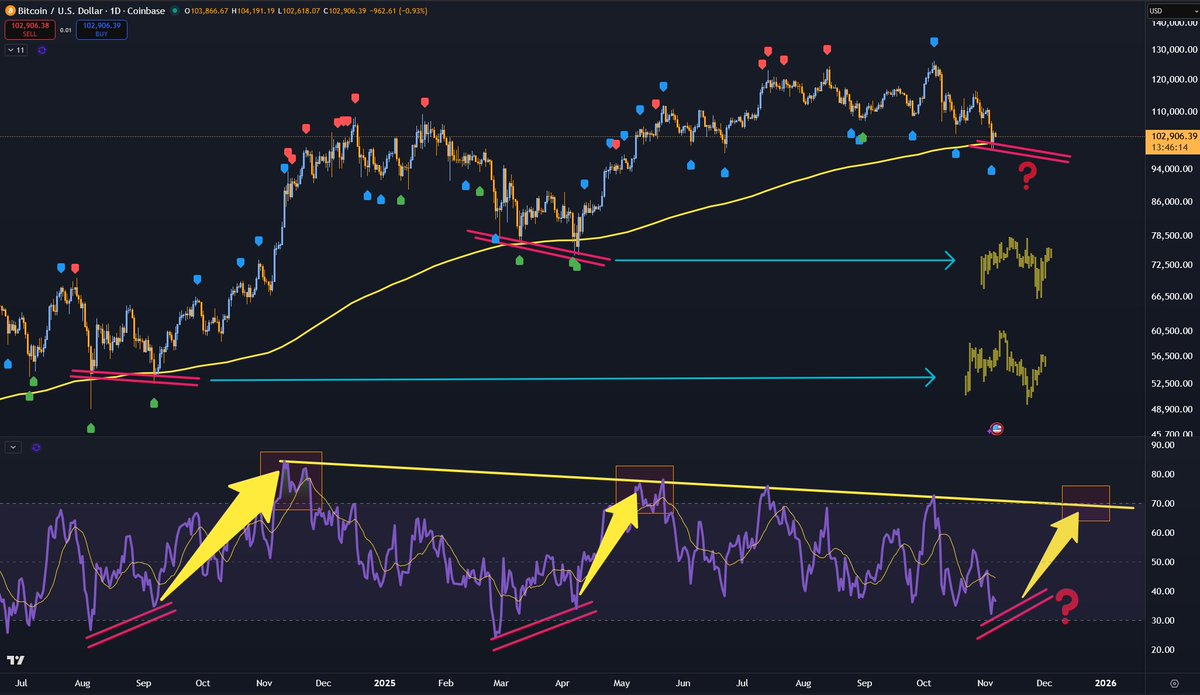
Chart looks uglier since the last post.
- 🔹Picture 1:
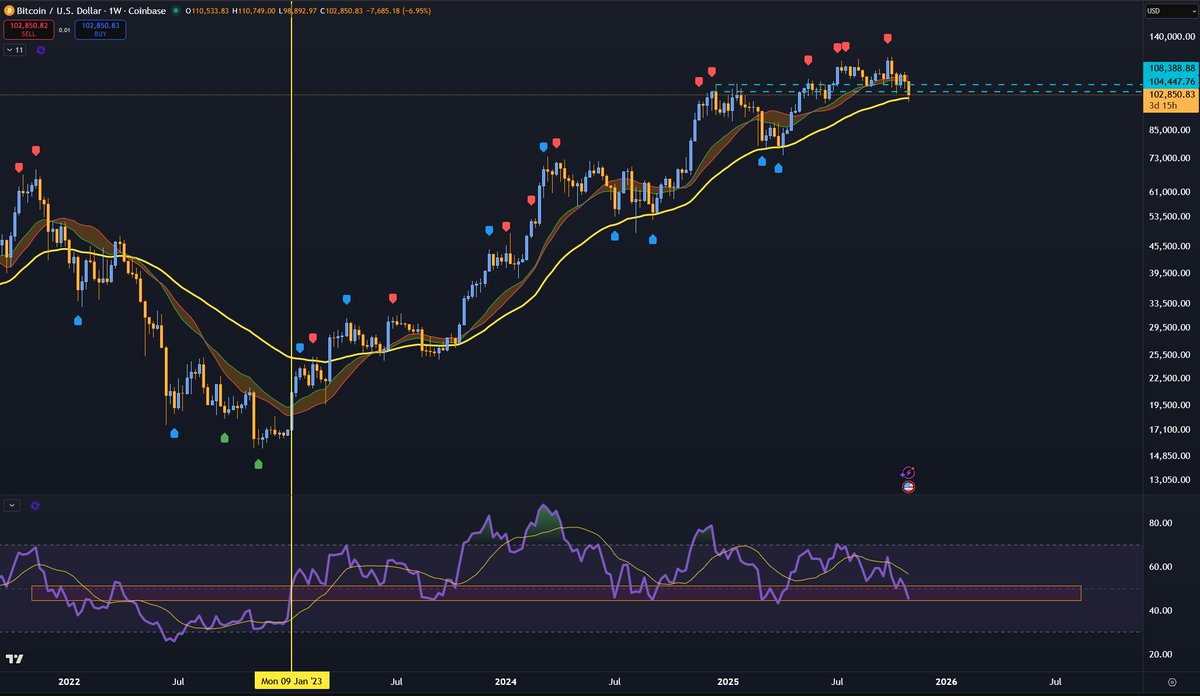
We're "bearly" (barely) holding 50W EMA Weekly RSI support.
21W EMA at 111k is resistance now.
I expect bounces to be sold until we close back above 2024 High (108k) or even 21W EMA (111k)
- 🔹Picture 2:
Everyone is talking about the 50W EMA touch as if it's going to solve all our problems. Even if we do what we did in the past, it's likely we sell the bounce first and bottom on the second touch with a lower low.
It's also likely Daily RSI needs to form bullish divs before we bottom.
Last but not least, the next BTC rally (whenever that happens) will be distributive and last until we hit the Daily RSI-70. Sell there.
- 🔹Picture 3:
Monthly Open 109555
MACD 🫣
30 Oct 2025
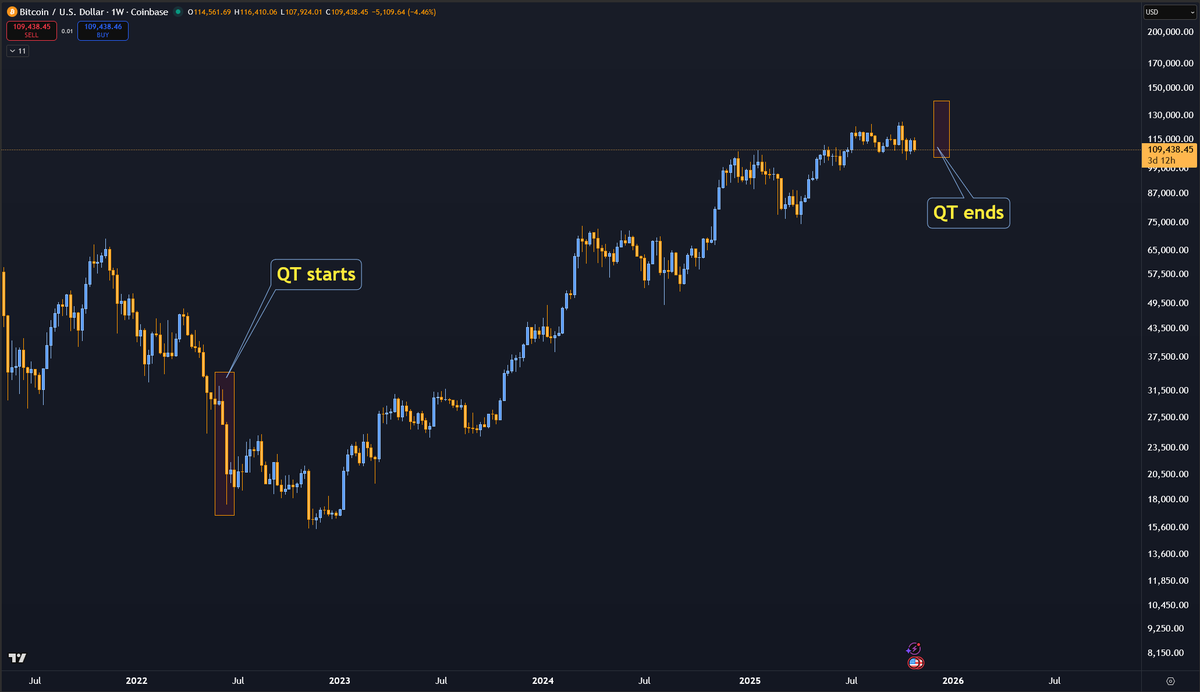
I won't pretend I know what happens next cos I don't.
I've only bid the lows because I understand that either way we're really close to the end of this bull-market.
QT started in June 2022, very close to the market bottom, QT ends in December which could mark the market top.
Ideally bulls want to see a time-based low here, followed by a rally to new ATHs.
Closing a weekly candle below 2024 High 2024 Weekly Highest Close would be a significant swift in momentum.
2
2
62
5,737
30 Oct 2025
I won't pretend I know what happens next cos I don't.
I've only bid the lows because I understand that either way we're really close to the end of this bull-market.
QT started in June 2022, very close to the market bottom, QT ends in December which could mark the market top.
Ideally bulls want to see a time-based low here, followed by a rally to new ATHs.
Closing a weekly candle below 2024 High 2024 Weekly Highest Close would be a significant swift in momentum.
7
4
92
10,777
24 Oct 2025
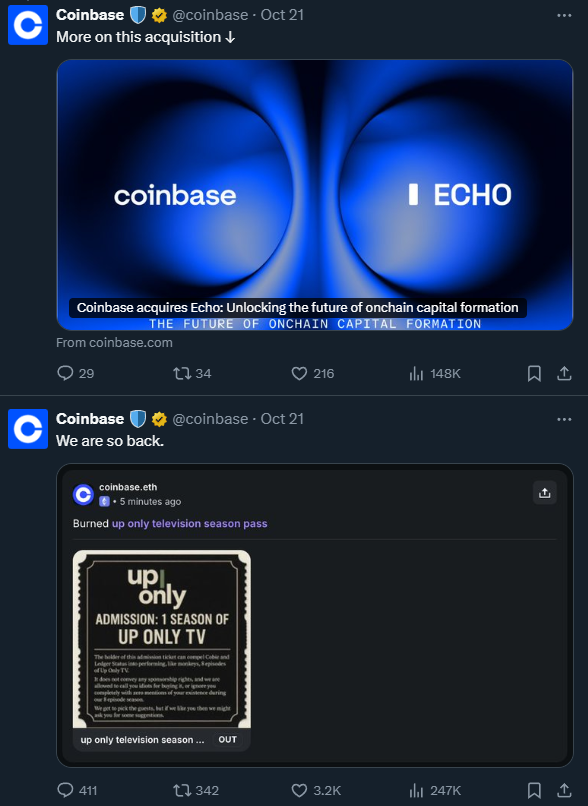
- "Crypto" stocks are pumping
- @coinbase bought @echodotxyz and @UpOnlyTV for 400M
- @cz_binance was pardoned and @SBF_FTX 's most recent interview pictures him as "the victim"
I've been in crypto long enough to know coincidences don't exist.
SOON ⬆️


4
2
73
3,674
24 Oct 2025
- Pass "Genius Act"
- Create FED "Payment Accounts"
- Allow Crypto Companies (Tether, Circle, Coinbase) to use FED Rails through a "payment account"
- Tokenize US Bonds (and 38T of US Debt)
- Onboard millions of retail and private companies
- Rug (oopsie! your stablecoins depegged)
- Congrats you just converted 38T of national Debt into private Dept. Now private sector goes bankrupt and you can buy their hard earned assets for pennies!
21 Oct 2025

🇺🇸 JUST IN: The Federal Reserve is studying a new “payment account” model that would give fintech and crypto firms limited access to Fed payment rails without full banking privileges.

11
22
217
121,247
23 Oct 2025
You may not believe this right now but SBF will also get pardoned sooner rather than later.
They are already building the narrative of how he was actually the victim.
Read this interview:

Community note
SBF illegally used customer funds for investments in high risk assets and expenses. This is a mischaracterization of the events that occurred.
bettermarkets.org/newsroom/ftxs-…
3
4
41
4,608
21 Oct 2025
21 Oct 2025

JUST IN: Gold falls 6.3%, largest single-day drop since April 2013.


2
1
40
4,155
21 Oct 2025

8
3
90
6,736


19 Oct 2025
Now squeeth!

4
2
51
9,945
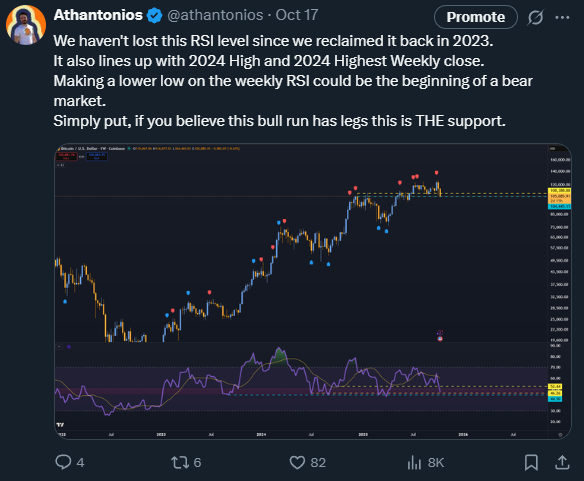
17 Oct 2025
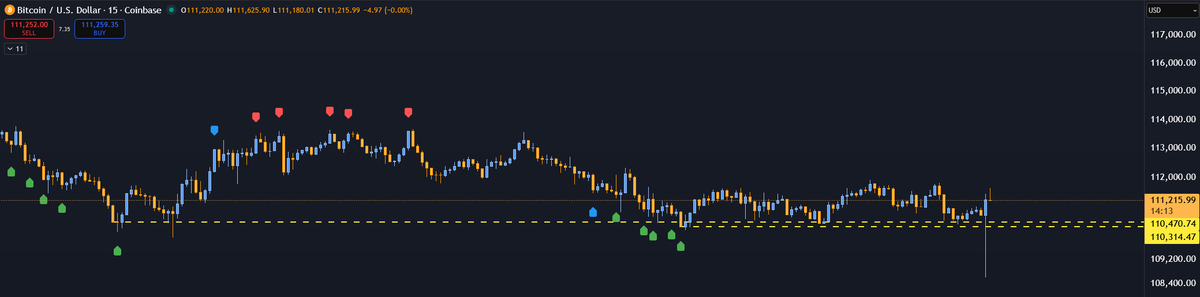
What are we thinking, bros?

17 Oct 2025
We haven't lost this RSI level since we reclaimed it back in 2023.
It also lines up with 2024 High and 2024 Highest Weekly close.
Making a lower low on the weekly RSI could be the beginning of a bear market.
Simply put, if you believe this bull run has legs this is THE support.
7
2
46
16,380
17 Oct 2025
We haven't lost this RSI level since we reclaimed it back in 2023.
It also lines up with 2024 High and 2024 Highest Weekly close.
Making a lower low on the weekly RSI could be the beginning of a bear market.
Simply put, if you believe this bull run has legs this is THE support.
4
5
85
8,538
16 Oct 2025
They are all smiling
Thanks for reading my analysis
3
2
66
3,563
16 Oct 2025
Oh, no.. They're flexing their crypto PnL
F 🫡

16 Oct 2025
JUST IN: 🇺🇸 Eric Trump says the Trump family has made more than $1 billion from crypto, FT reports.
2
3
38
4,277
15 Oct 2025
"Paypal's PYUSD mints $300 Trillion on Ethereum"
Bro.. there's no way this is even 1-1 collateralized.
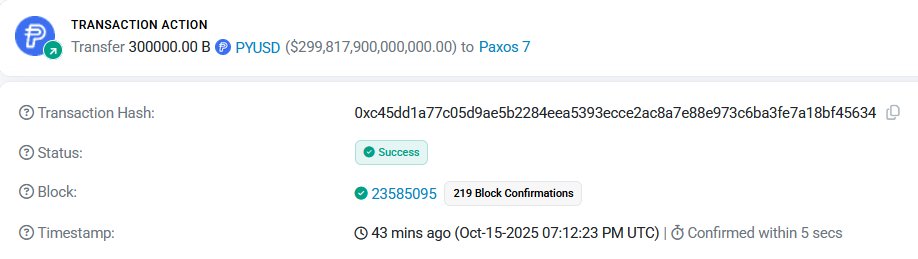
15 Oct 2025

SOURCE: etherscan.io/tx/0xc45dd1a77c…
4
1
37
5,160
15 Oct 2025
and then they just burned it?
someone's getting fired tonight

1
1
19
1,595