
Joined October 2011
- Tweets 803
- Following 190
- Followers 370
- Likes 463
230 Photos and videos


Pinned Tweet

15 Dec 2025
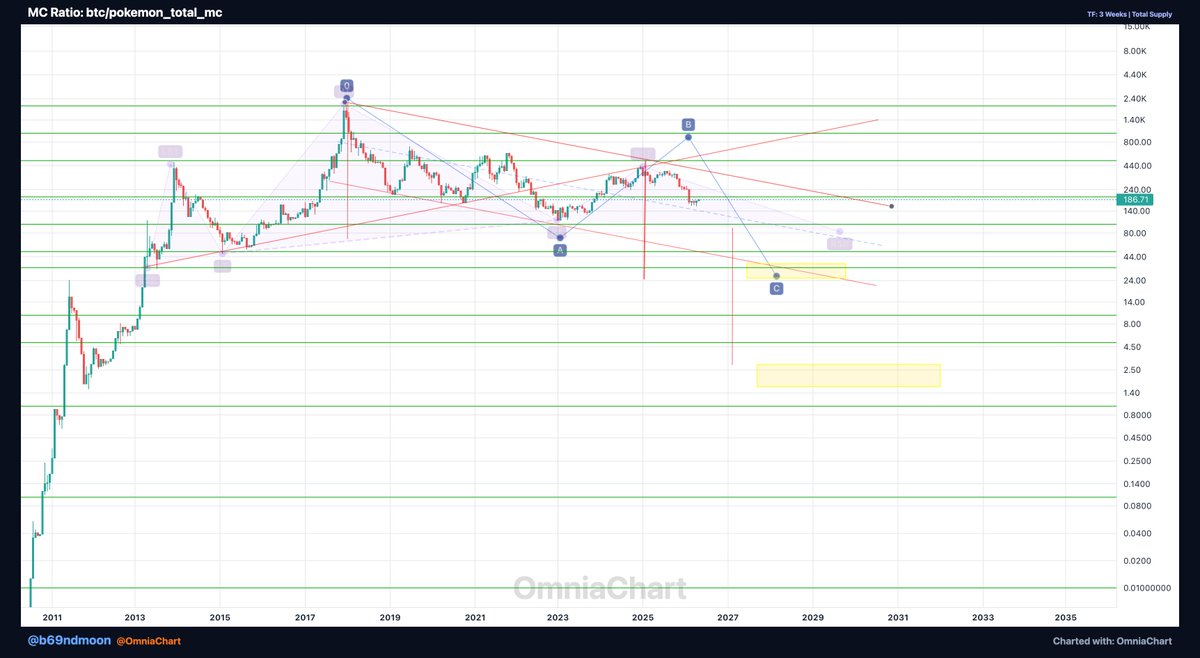
2/ The $BTC/pokemon_psa_total_mc chart suggests that the ratio might go back between 25-50.
This aligns with the anticipation of an alt season and a risk-off environment, which could catalyze a massive influx into Pokemon cards via tokenization.
The prediction here is a final extended wave of mania driven by nostalgia and renewed interest in the Pokemon franchise.
This is a reconstruction of the Pokemon PSA cards market cap using data points of prices and pops of the main cards.

36
61
1,370
1,320,718
May 25
Kabuto is King 👑
#KABUTO
May 24

KABUTO KING GIVEAWAY 👑
To celebrate the collection reaching 5000 Kabutos I am giving away…
Winner Receives:
👑 1st edition Pokemon Fossil Pack
👑 Signed unlimited fossil Kabuto
How to Win:
- Quote this post with “Kabuto is King 👑”
- Follow @KabutoKing_
A winner will be picked Tuesday evening. Good luck and thank you all!
24
May 14
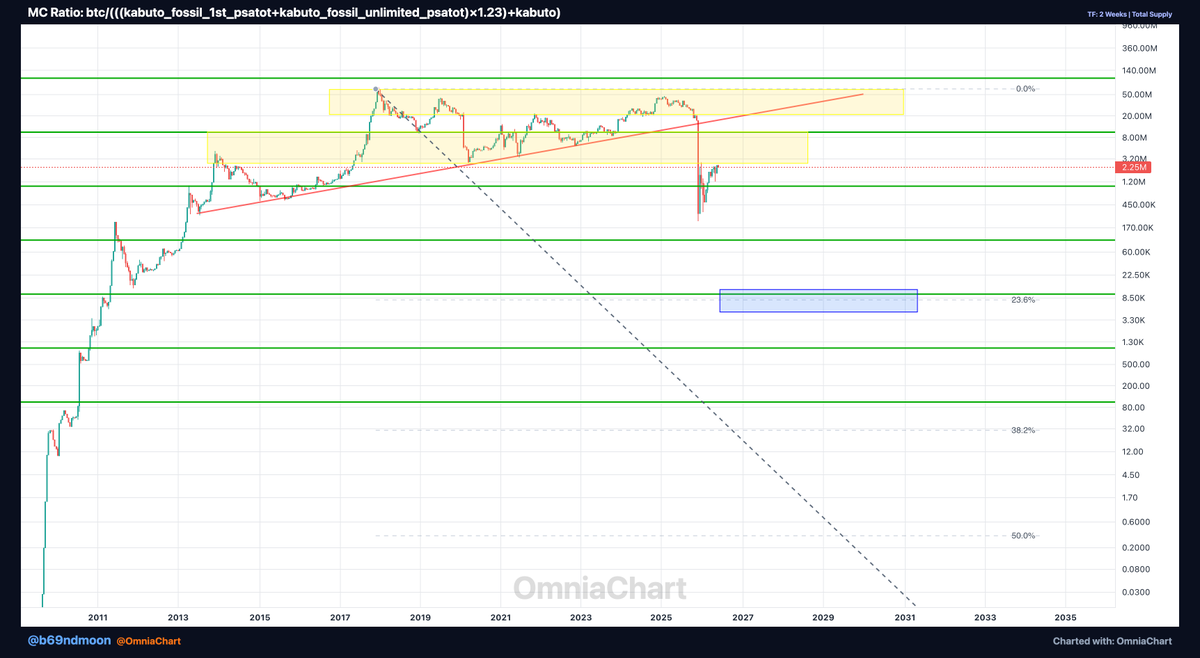
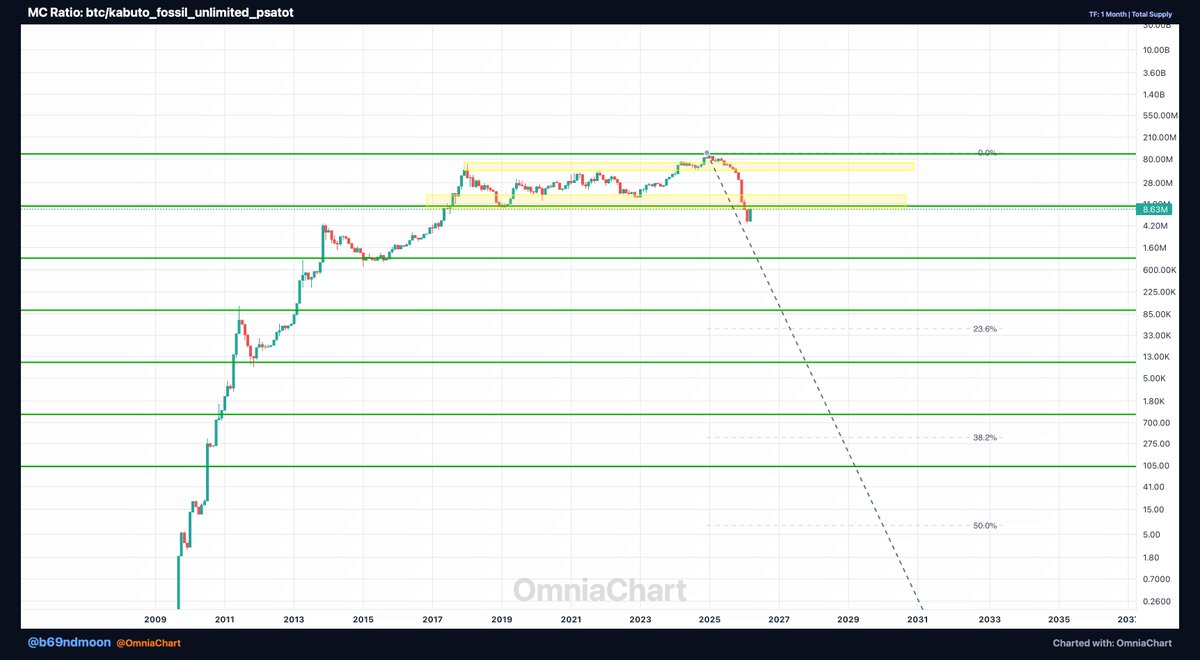
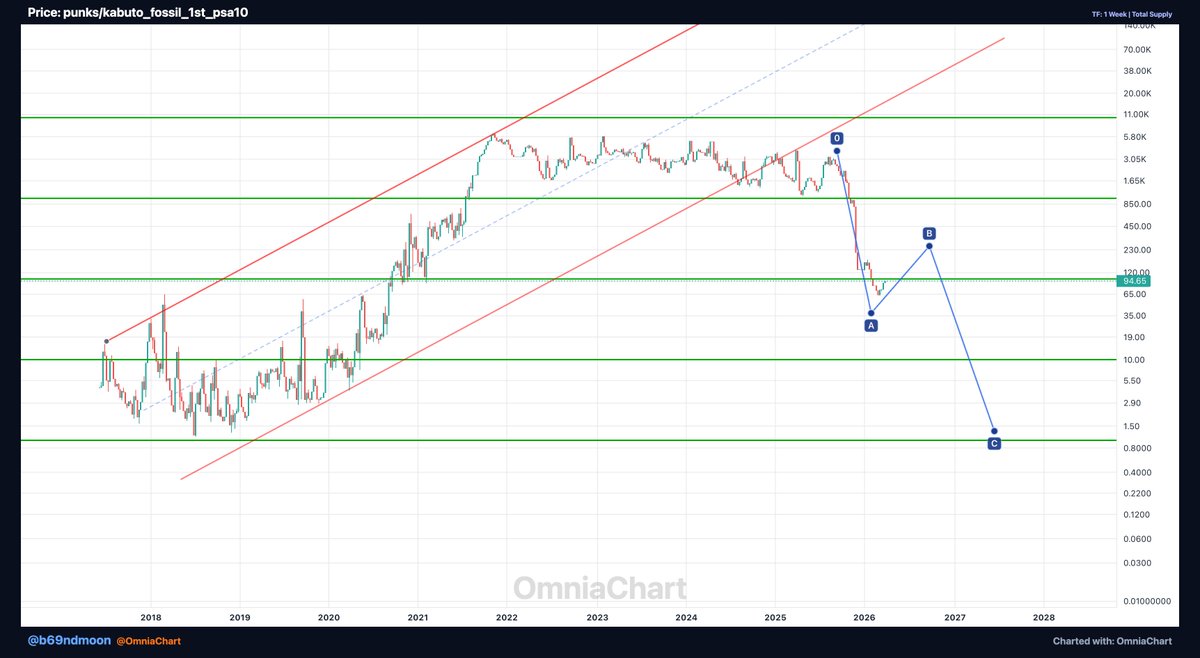
$BTC is 10Mx bigger than all Kabuto fossil Unlimited Pokémon cards combined.
At peak that ratio hit 100M. Now under 10M — already a 10x compression as Kabuto appreciated. Currently sitting just under a multi-year distribution range.
If this breaks toward 1M, that's another 100x compression. Kabuto closing real ground on BTC market cap.
Absurd chart. Real data.
#Pokemon #CrossAsset
1
46
May 13
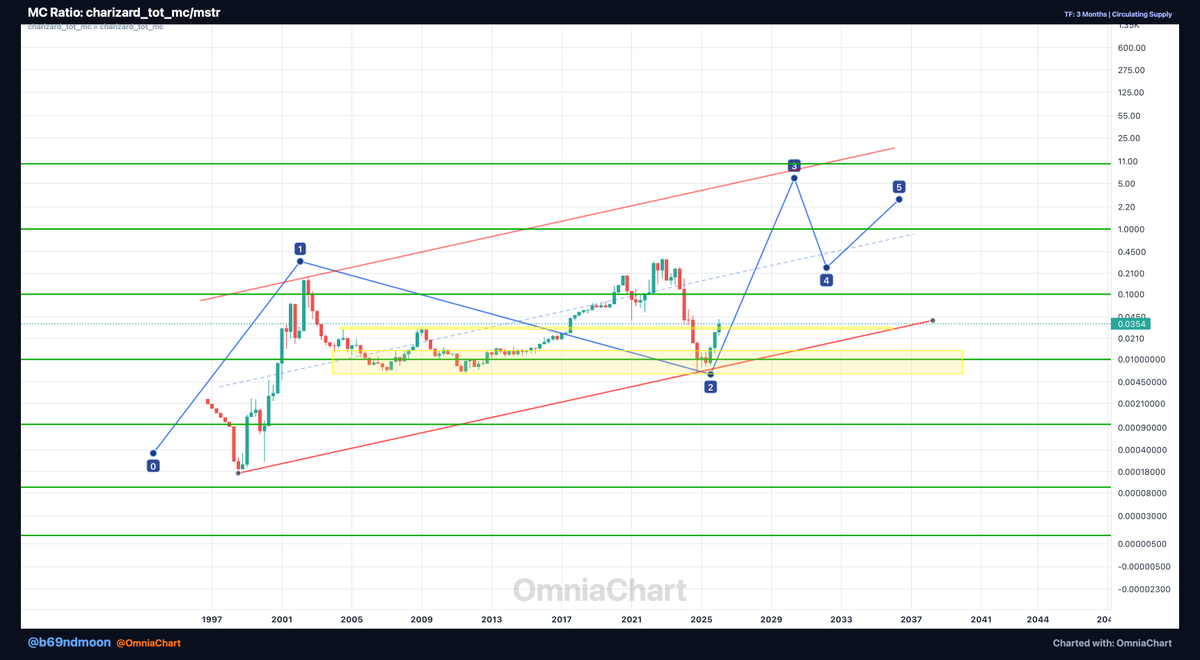
Charizard's total market cap has been holding above the top of its macro range vs MicroStrategy.
MicroStrategy has $MSTR on every portfolio manager's radar. Charizard, especially vintage ones, have 30 years of scarcity, and interest in collectibles investments is skyrocketing.
Weird comparison? Maybe. But what matters is comparing 2 of the best performing assets in recent years.
@OmniaChart
#Charizard #CrossAsset
59
May 7
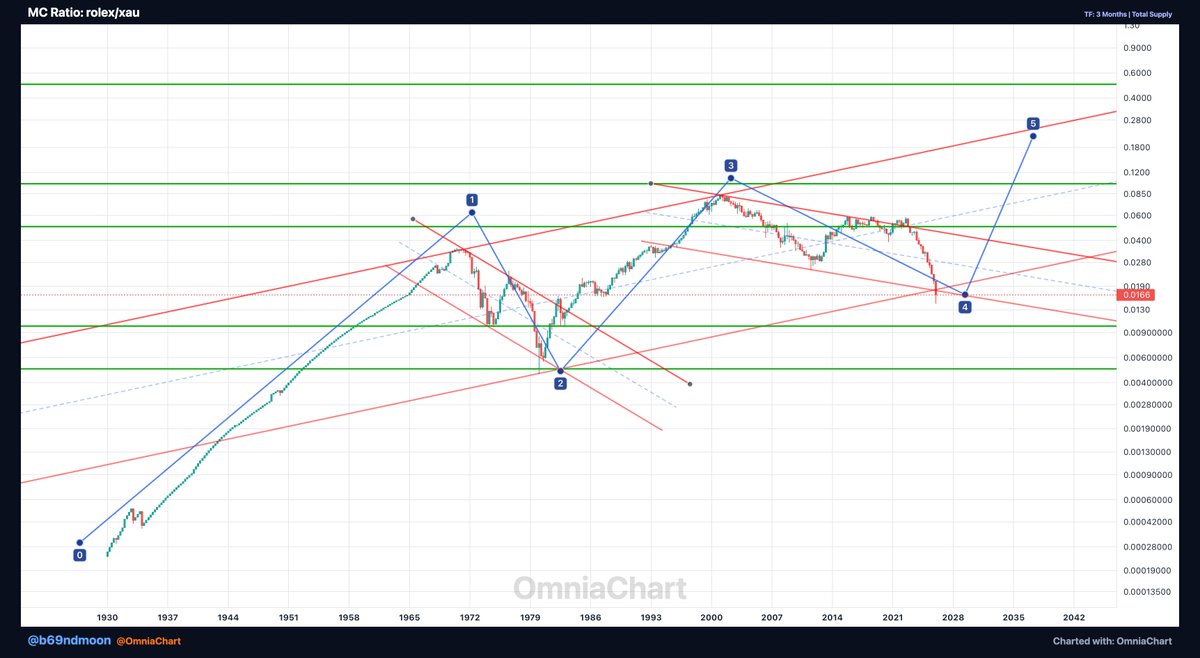
Rolex market cap vs Gold market cap.
Ratio topped around 0.1 of Gold's MC around 2000 and since then it's been compressing on what appears a classic ABC, with C wave corresponding to the recent gold price increase in last years.
Most people don't think of watches as an asset class. But the collectible watch market has a measurable total market cap, and you can chart it against gold.
Currently watching whether this ratio holds its recent structure or gives back more ground to XAU. Holding here means starting a long term trend back towards 0.1 or even 0.25-0.33 of this ratio.
$XAU
#Rolex #Gold
80
May 7
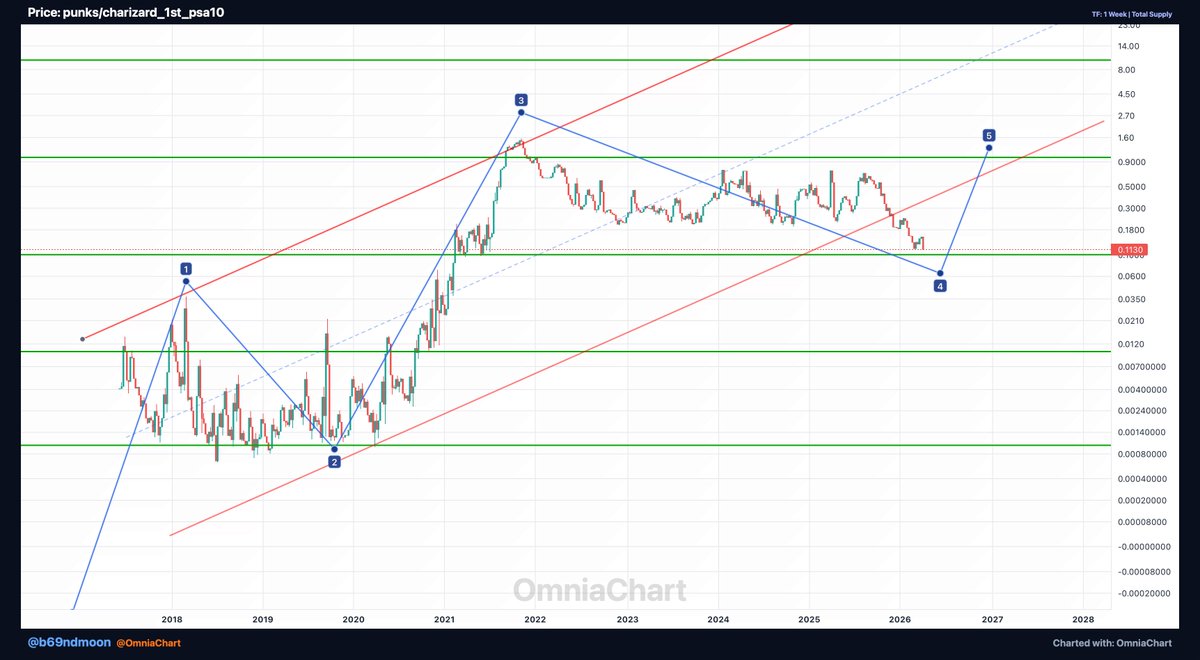
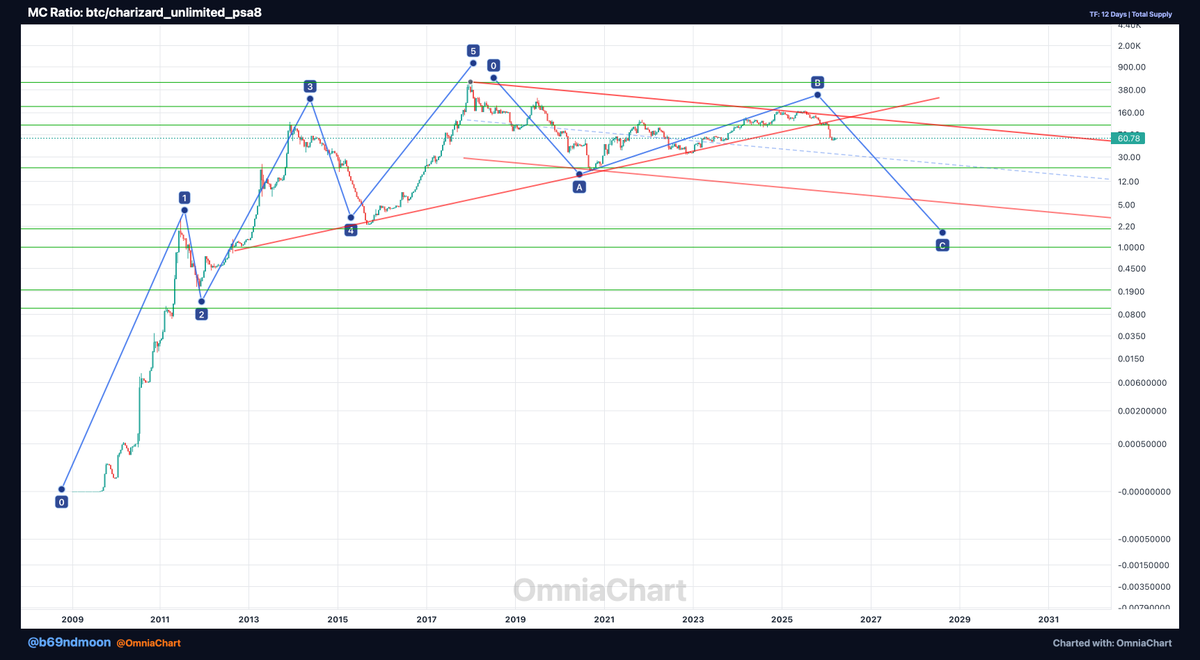
A CryptoPunk used to cost 10,000x a Kabuto Fossil PSA10.
Now it costs around 100x.
The Kabuto PSA 10 did a x100 in the price ratio between these two OG collectibles, will this ratio fall back to parity? crazy to think, but Kabuto King is leading the wave! $KABUTO
I charted 3 interesting ratios involving Pokemon and NFTs. Here's what they show:
#CryptoPunks
1
1
165
May 7
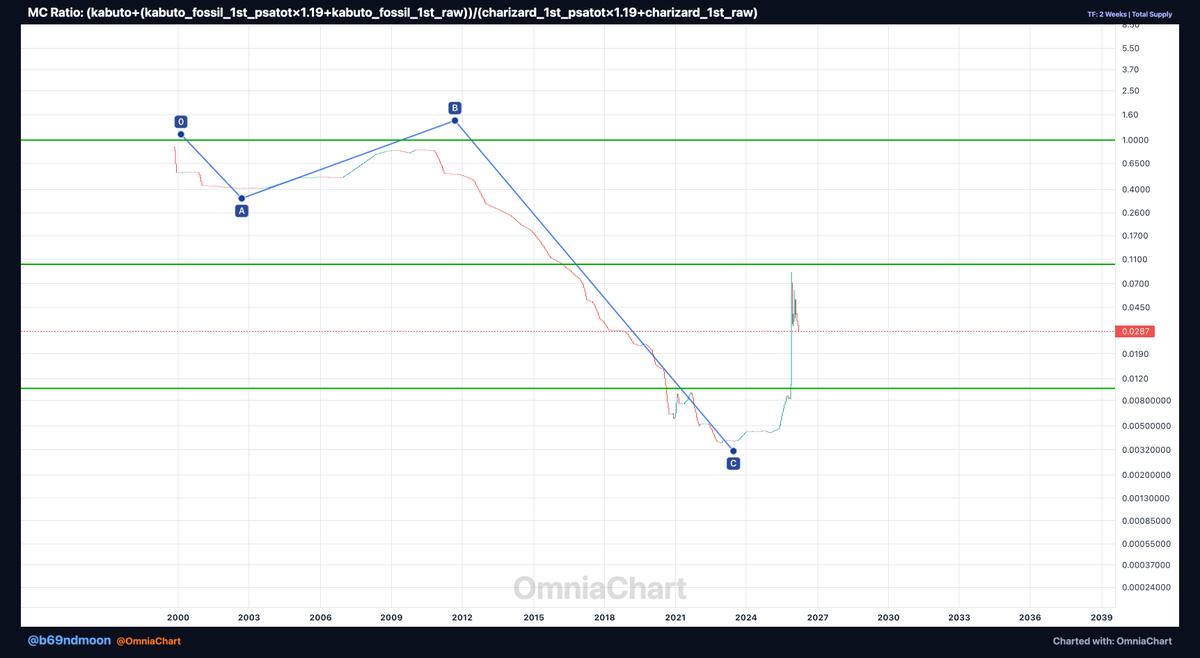
4/ $KABUTO memecoin Kabuto Fossil 1st Ed cards (combined MC of both PSA cards and raws estimate) vs Charizard 1st Ed total MC.
Bottomed around 0.005. Now sitting under 0.033.
Kabuto's combined MC is still less than 3% of Charizard's graded card market. Same franchise, completely different valuations, can Kabuto meme culture make it back to parity? it would be a bit like DOGE reaching BTC marketcap.. all in Kabuto King hands!
#Pokemon
1
1
96
May 7
5/ All of this is possible because @OmniaChart lets you build ratio charts across any two assets — NFTs, Pokémon cards, crypto, stocks...
Cross-asset analysis used to require Excel and prayer. Not anymore.
Try it free: app.omniachart.com
31
May 7
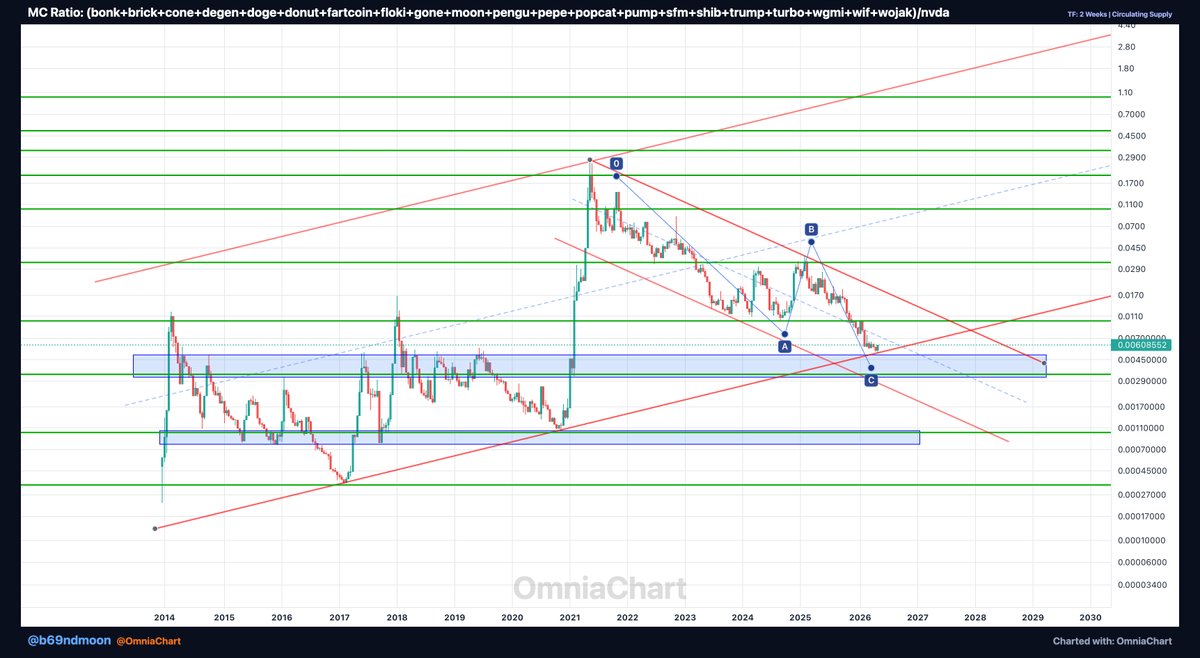
Total meme coin market cap vs NVDA — charted.
21 meme coins combined, measured against NVDA's market cap. This ratio hit 0.2 back in 2021. Then a full ABC correction unfolded. Now it's retesting the exact level of the accumulation range broken in 2021.
Ratio under 0.01. A decade-long boundary being re-tested right now.
If memes hold here and start recovering ground against NVDA, we're looking at a sector-wide shift. Memes will come back hard when no one expects it.
$DOGE
#Memecoins #NVDA
45
May 6
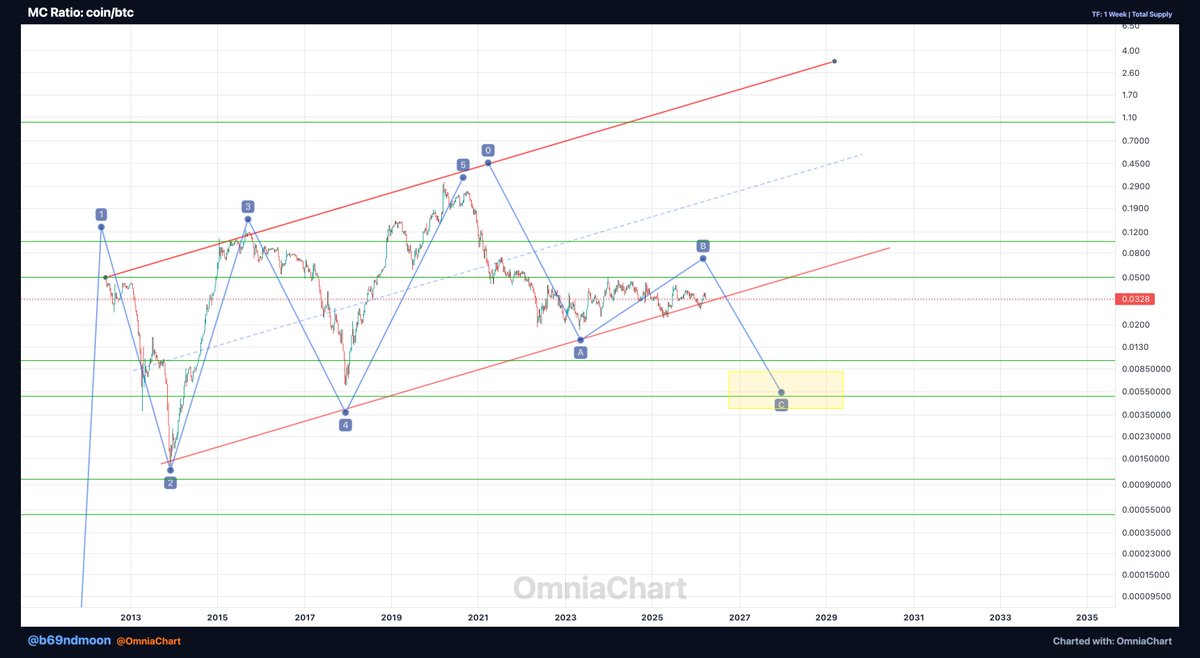
Coinbase/BTC market cap ratio hit roughly 0.01 in 2018, topped at 0.33 in 2020. I think a macro ABC is gonna unfold, and we might have an other push of this ratio from 0.0333 up to around 0.1... then macro C wave might unfold with a target 0.01-0.005 range on this ratio, at base wave 4. That's 50-80% lower from here.
COIN going up in USD doesn't change the story. BTC compounds harder. But in the medium term it might still act as a beta play.
$COIN
#BTC
30
May 4
The $BTC/Pokemon ratio has been falling since 2017. Head & shoulders forming at the neckline right now. From ~200 → 10-20 is the thesis. 4 charts on why the collectibles market is quietly eating crypto's lunch:
1
44
May 4
4/ What these charts tell me: cards with fixed supply — 1st ed print runs from 1999, never reprinted — don't behave so much differently from $BTC. No new supply. Only new demand. In a speculative environment where NFTs will perform well, I think these cards will keep growing together!
1
36
May 4
5/ All 3 charts built on OmniaChart. You can chart $BTC vs Pokemon, Rolex vs gold, NFT sectors vs equities — anything against anything. Try it free: app.omniachart.com @OmniaChart
63
May 4
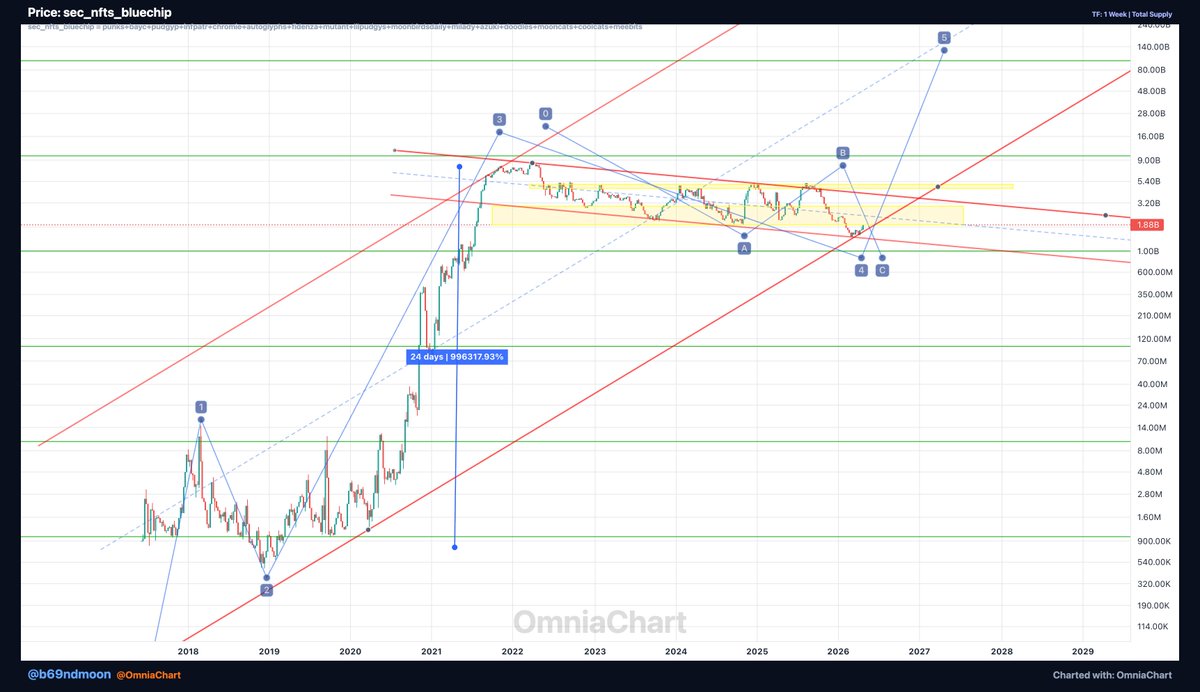
NFT blue chips sector MC still under the reaccumulation range, but looks like spring is about the end — macro wave 5 igniting?
If lower boundary of the range is regained, the setup looks like a classic reaccumulation before expansion.
Not a lot of people track the full blue chip sector in aggregate. That's the angle IMO.
$PUNKS
#NFT #CrossAsset
29
May 1
Rolex Daytona wrt Gold kg price — wave 4 close to a bottom at lower boundary of the channel!
Luxury watches vs physical gold. Most people wouldn't think to chart these two, but I think it's a bit like charting NFTs wrt BTC or ETH. Wave 5 target is 1-2x a kg of gold for a Daytona — sounds absurd until you look at where it's been before, with that top around 0.7-1 around 2000.
$XAU running its supercycle while Rolex sits depressed in ratio terms. Could be a slow wave 5 setup over the next 10-20 years. Worth watching if you want a long term beta play of gold!
#Rolex #Gold
107
May 1
6 months later, update on this thread:
BTC MC: $1.60T
Pokemon PSA total MC: ~$3.0B
Ratio: ~500
The catalyst — tokenization rails — is finally landing. $CARDS, Phygitals, Beezie all shipping.
It would be crazy but I think 10-20 level of this ratio could happen in next years.
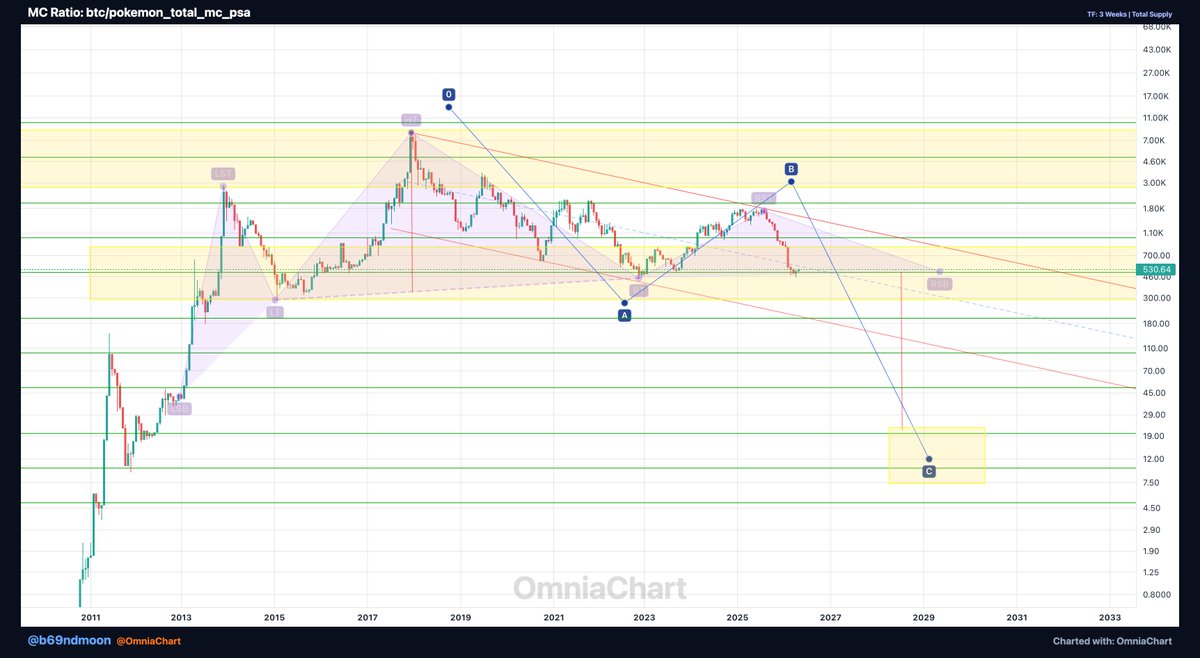
15 Dec 2025

2/ The $BTC/pokemon_psa_total_mc chart suggests that the ratio might go back between 25-50.
This aligns with the anticipation of an alt season and a risk-off environment, which could catalyze a massive influx into Pokemon cards via tokenization.
The prediction here is a final extended wave of mania driven by nostalgia and renewed interest in the Pokemon franchise.
This is a reconstruction of the Pokemon PSA cards market cap using data points of prices and pops of the main cards.
2
248
Apr 30
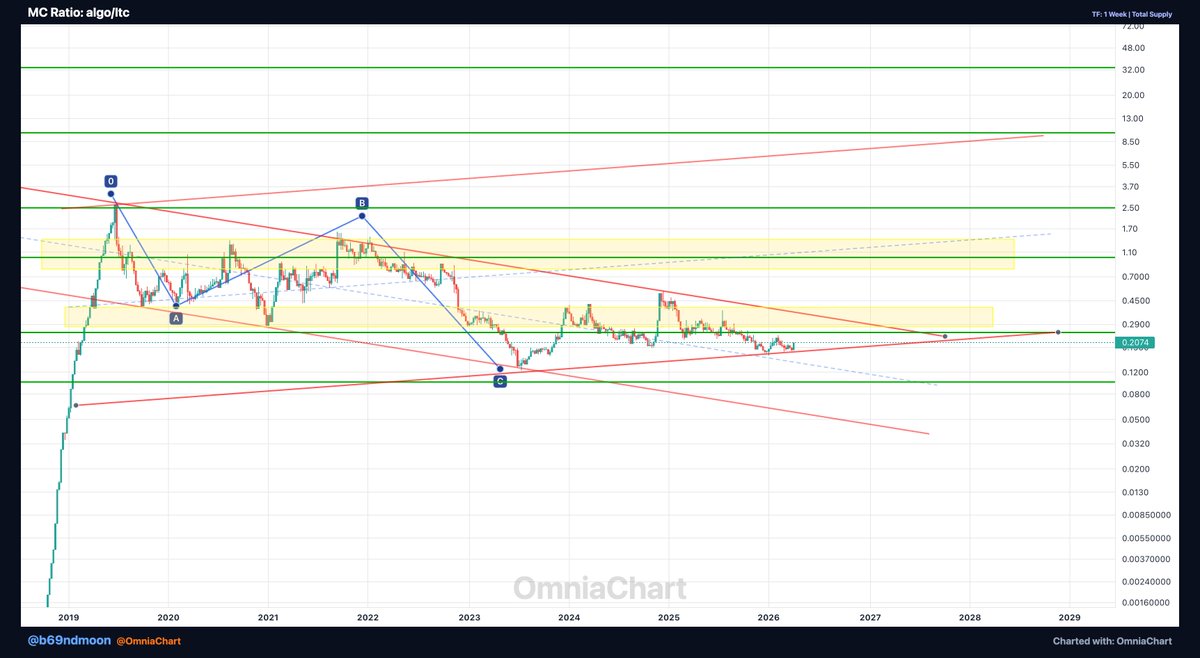
$ALGO wrt LTC marketcap is hovering right under reaccumulation range, ready for a jump across the creek, looks like a retest phase after long lasting spring, before real uptrend starts!
Range top was 2.5, channel ceiling at 10. Whether the quantum-resistant narrative or RWA flows push it, the ratio setup is there.
#Algorand #RWA
1
103