
Minimalist
Joined February 2007
- Tweets 870
- Following 252
- Followers 322
- Likes 301
20 Photos and videos


May 25
That feeling when Claude Code, upon reviewing Codex CLI’s recent work, says: “The refactor velocity here is unusual” 🤣
1
42
Apr 5
Linux coredumps bury the arguments and environment variables on the initial process stack. My ptools project walks the auxiliary vector from AT_RANDOM to recover every argument and environment variable intact. basilcrow.com/blog/recoverin…
1
2
94
Mar 4
Ever tried to figure out why a Linux process is hung? You probably cobbled together output from GDB, lsof, and /proc, each with its own interface, its own flags, and its own quirks. And if all you have is a core dump? Good luck.
Solaris solved this decades ago with its "ptools": pstack, pfiles, ptree, and others. They have one consistent interface for inspecting live processes and core dumps alike. It's one of those things that, once you've used it, is hard to live without.
So I've been building ptools for Linux: a collection of Linux process inspection utilities modeled after the Solaris originals. Written in Rust, available on crates.io, fully open source (Apache 2.0), and ready to meet your production debugging needs today:
- pstack: Thread stack traces for live processes and core dumps, with optional DWARF source locations
- pfiles: Every open file descriptor with paths, offsets, socket details, and flags
- ptree: Process trees for the whole system or a single process
- penv: The *current* environment of a running process, not just a snapshot from startup. No other Linux CLI tool does this.
- pargs, pauxv, pcred, psig, plgrp, plimit, prun, pstop, ptime, pwait, and more
Postmortem debugging support is a first-class feature. Most tools work seamlessly with Ubuntu/Debian Apport .crash files or systemd-coredump core dumps on RHEL/Fedora/SUSE, making postmortem debugging feel as natural as inspecting a live process. We've even upstreamed changes to Ubuntu Apport to enable postmortem analysis of open file descriptors.
ptools will be shipping in Fedora 44 next month. But why wait?
github.com/basil/ptools
99
Feb 17
ptools v0.2.5 is out! 🚀
github.com/basil/ptools/rele…
New: Major pfiles upgrades for socket/file introspection (TCP state, peer process info, IPv6, and more), plus new psig for process signal actions, and updated manual pages.
ptools is a collection of Linux utilities written in Rust for inspecting process state, inspired by the original Solaris/illumos tools.
2
134

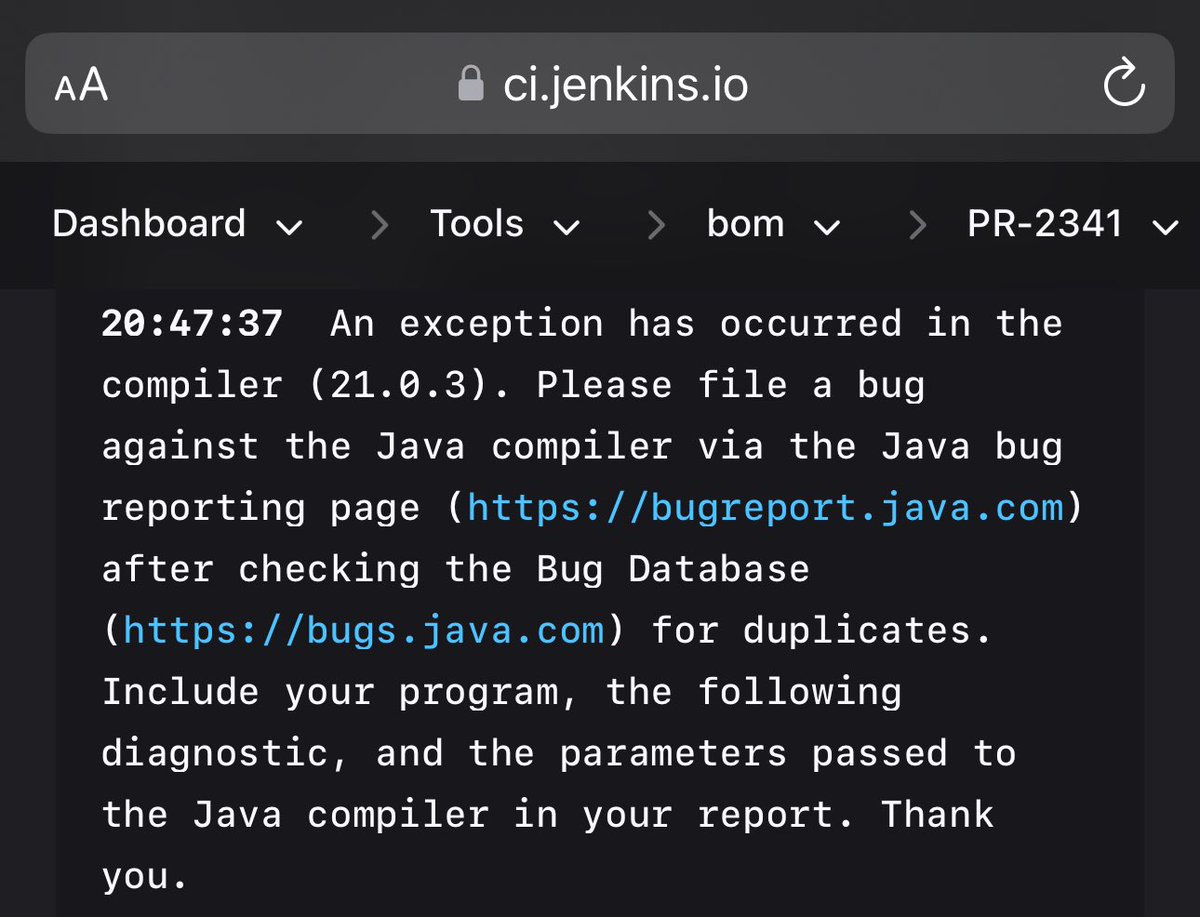
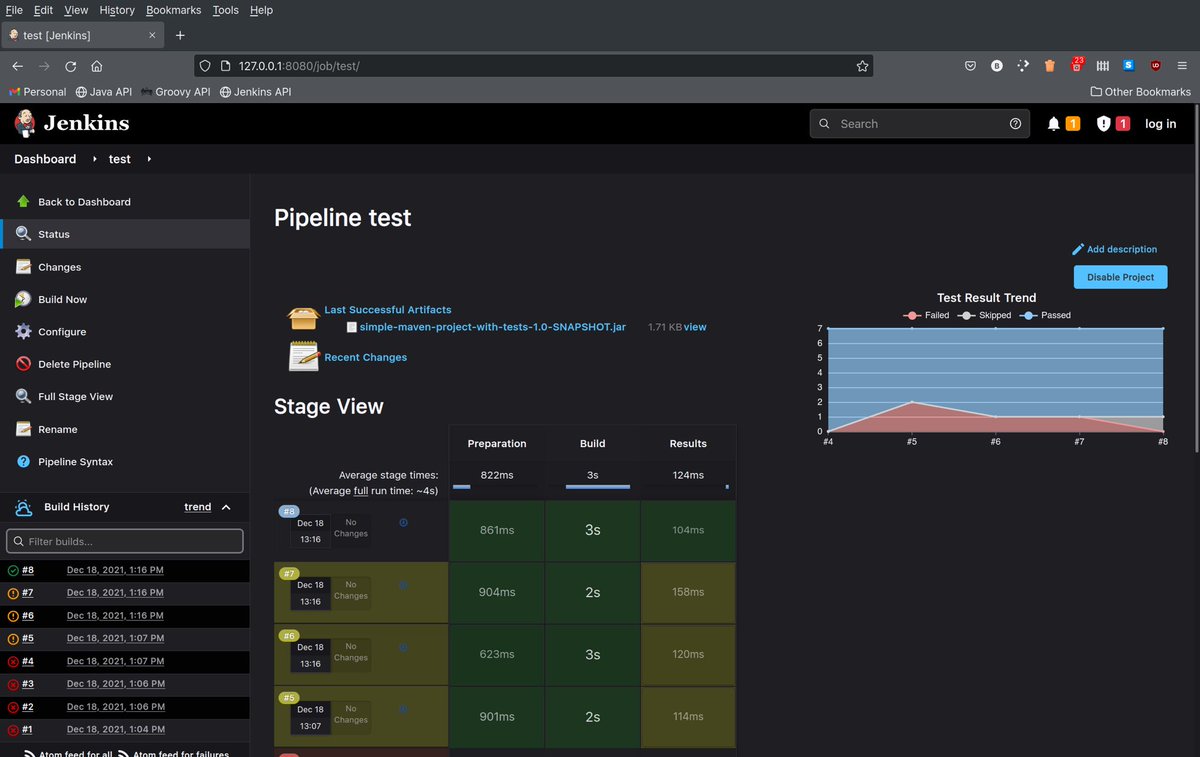
Jenkins, as more teams migrate to GitHub Actions for its seamless integration and scalability. It's not vanishing overnight, but its dominance is fading.

1
1
100
Jan 21
The Python 3 documentation for priority queues has a fun Theory section: docs.python.org/3/library/he…
Turns out it was written about 25 years ago by François Pinard mail.python.org/archives/lis…
Don’t miss the fun anecdote about tape sorting in the 1960s retrocomputing.stackexchange…
2
110
3 Dec 2025
“the indignities of trying to monetize open source infrastructure on a VC timeline”

Anthropic buying Bun is a beautiful act of corporate patronage. There's no compelling technical or strategic argument, but I fully support saving a great runtime from the indignities of trying to monetize open source infrastructure on a VC timeline 🎉 bun.com/blog/bun-joins-anthr…
1
133
10 Nov 2025
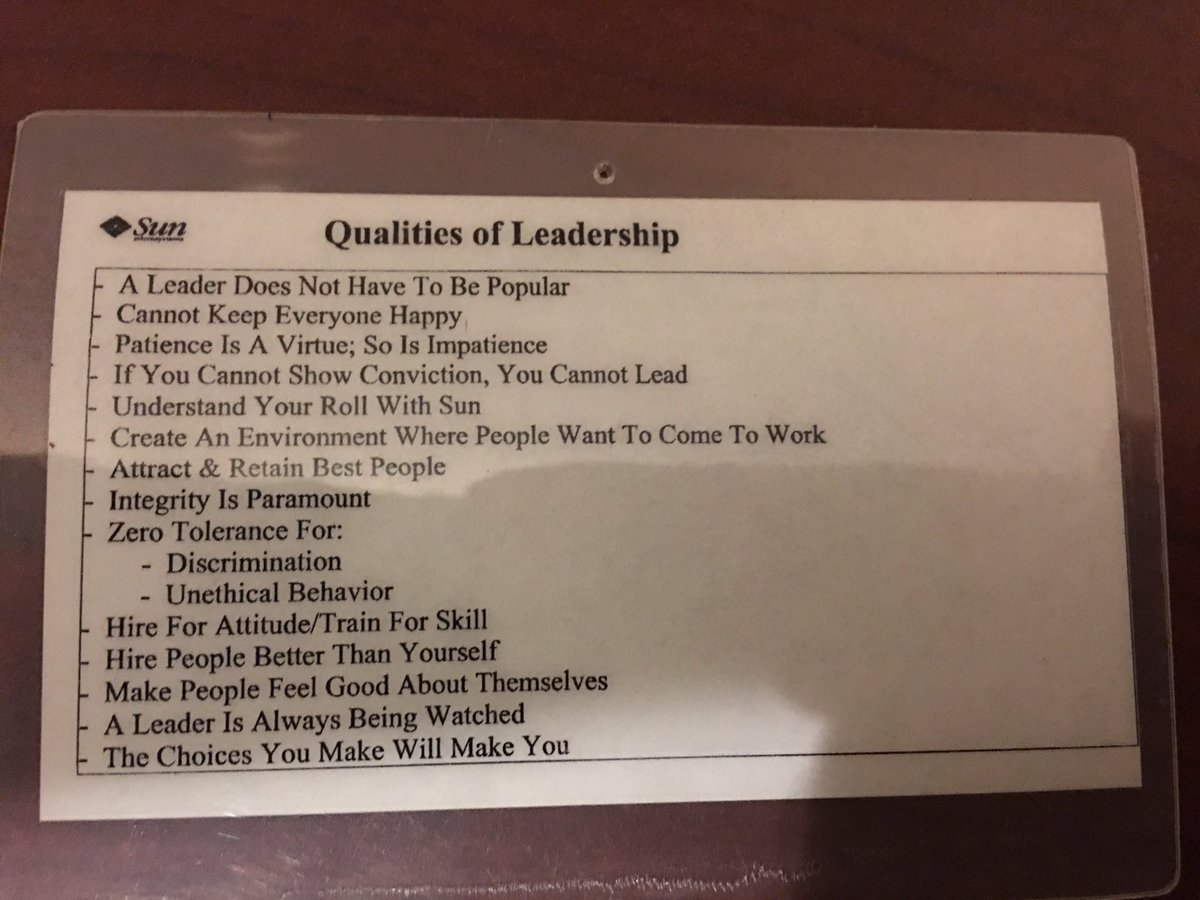
Sun Microsystems might be dead, but I still treasure its leadership principles.
5
201
31 Oct 2025
Don’t allow your sparkling prose – heaven forbid – to be mistaken for AI slop! Follow Robert Bringhurst’s advice about dashes:
“The em dash is the nineteenth-century standard, still prescribed by many editorial style books, but the em dash is too long for use with the best text faces. Like the oversized space between sentences, it belongs to the padded and corseted aesthetic of Victorian typography. Use spaced en dashes – rather than em dashes or hyphens – to set off phrases.”
2
901
14 Oct 2025
The inventor of the term “vibe coding” is writing his code by hand because agentic coding tools are “net unhelpful” and his repository is “too far off the data distribution.”
13 Oct 2025

Good question, it's basically entirely hand-written (with tab autocomplete). I tried to use claude/codex agents a few times but they just didn't work well enough at all and net unhelpful, possibly the repo is too far off the data distribution.
1
5
449
11 Oct 2025
Many companies moving away from open source these days theregister.com/2025/10/09/i…
1
104
3 Oct 2025
I just published my Manual of Me: a concise guide for teammates on working with me effectively. Covers why-first mindset (explain reasoning & I’ll move mountains), written/transparent communication (w/ exceptions), asking for help (problem-first), efficient PR reviews, & more. Past/future collaborators, check it out: github.com/basil/basil/blob/…
2
107
Basil Crow retweeted

30 Sep 2025
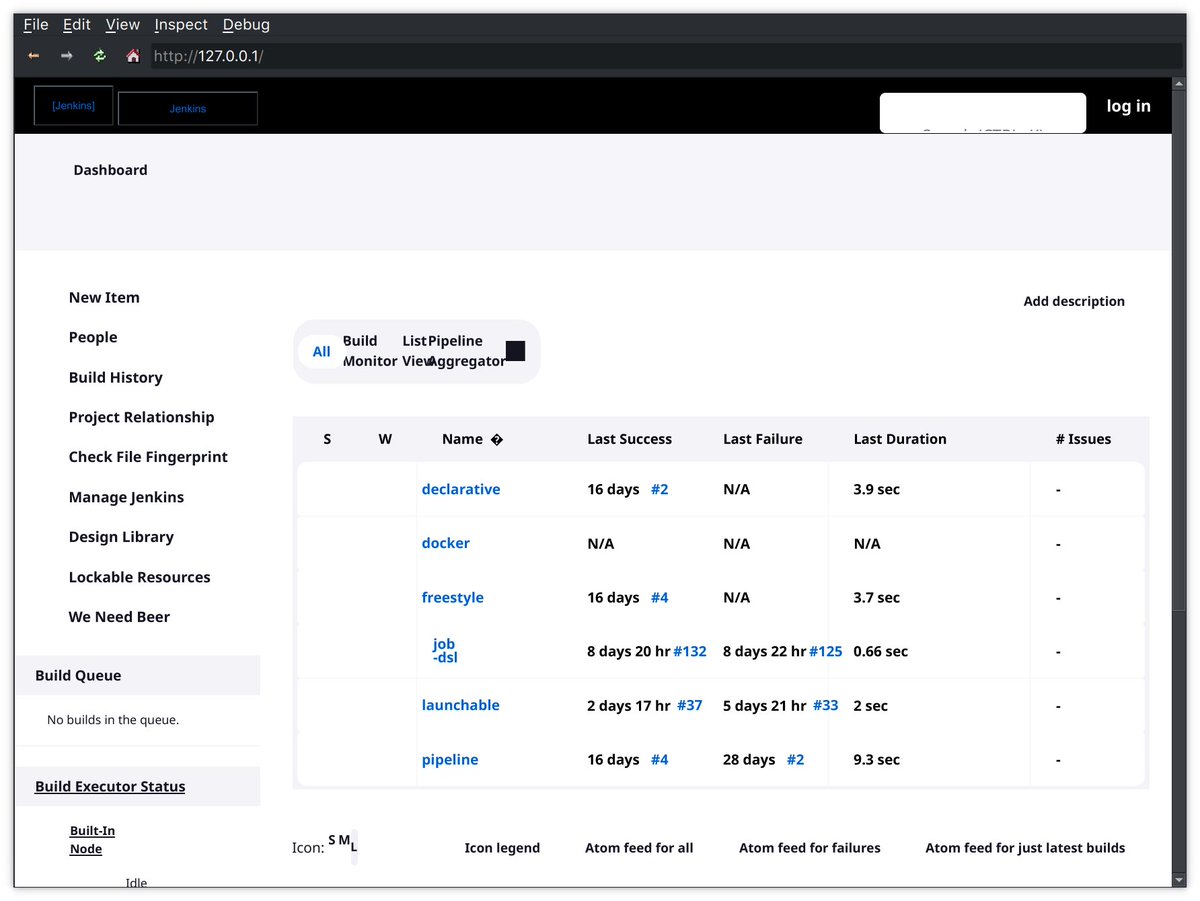
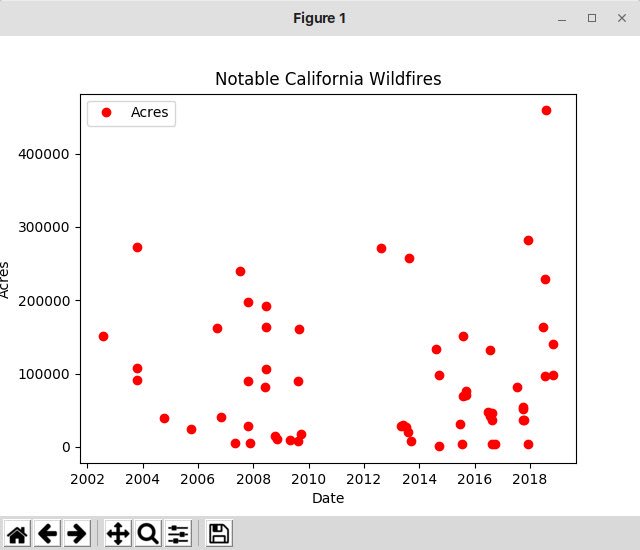
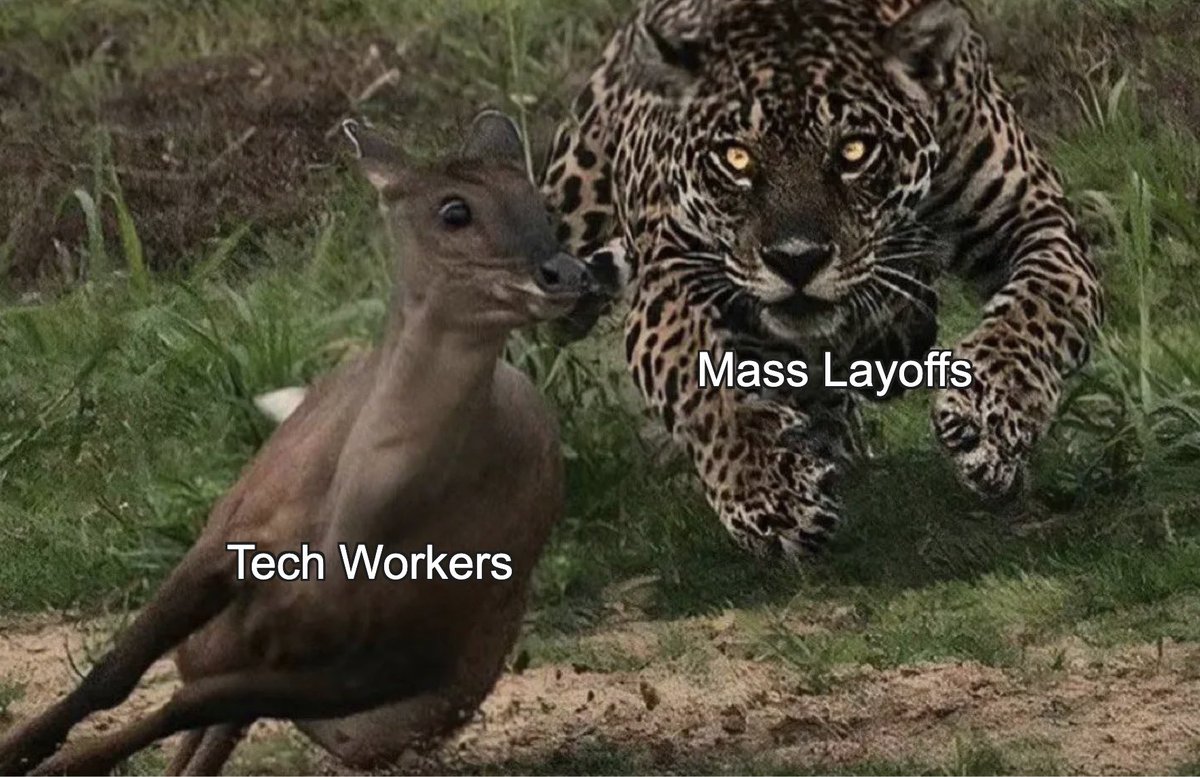
2025 job market summarized in one picture
8
10
227
11,555
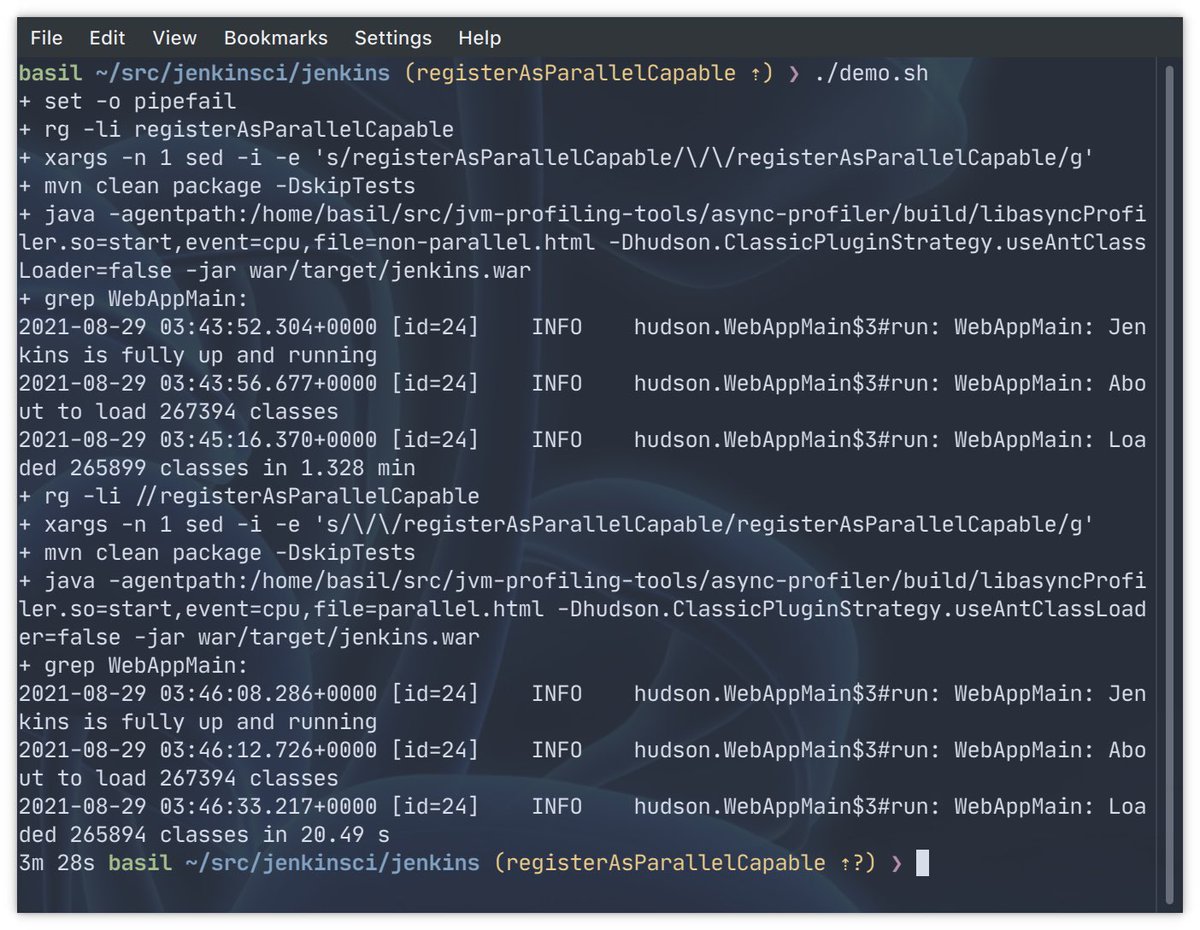
30 Aug 2025
Navigating the Security/Compatibility Tradeoff with Escape Hatches basilcrow.com/2025/08/30/nav…
2
218
22 Aug 2025
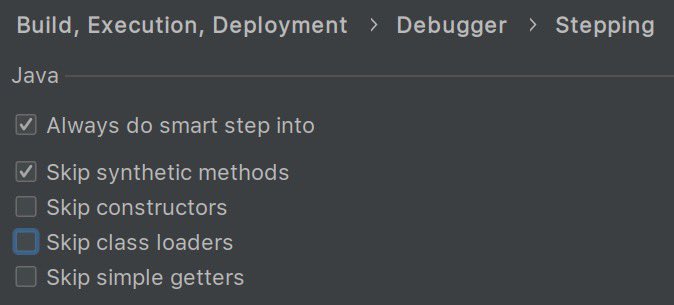
So the “let” keyword means the variable is immutable in Swift but mutable in TypeScript. 🤦♂️
155
18 Aug 2025
I want to run a terminal agent in an isolated Docker container on an internal network, connected to a proxy server with access to both internal & external networks—proxying requests only from allowed domains. What do I choose?
75%
Claude Code
0%
Codex CLI
25%
Gemini CLI
4 votes • Final results
1
185
14 Aug 2025
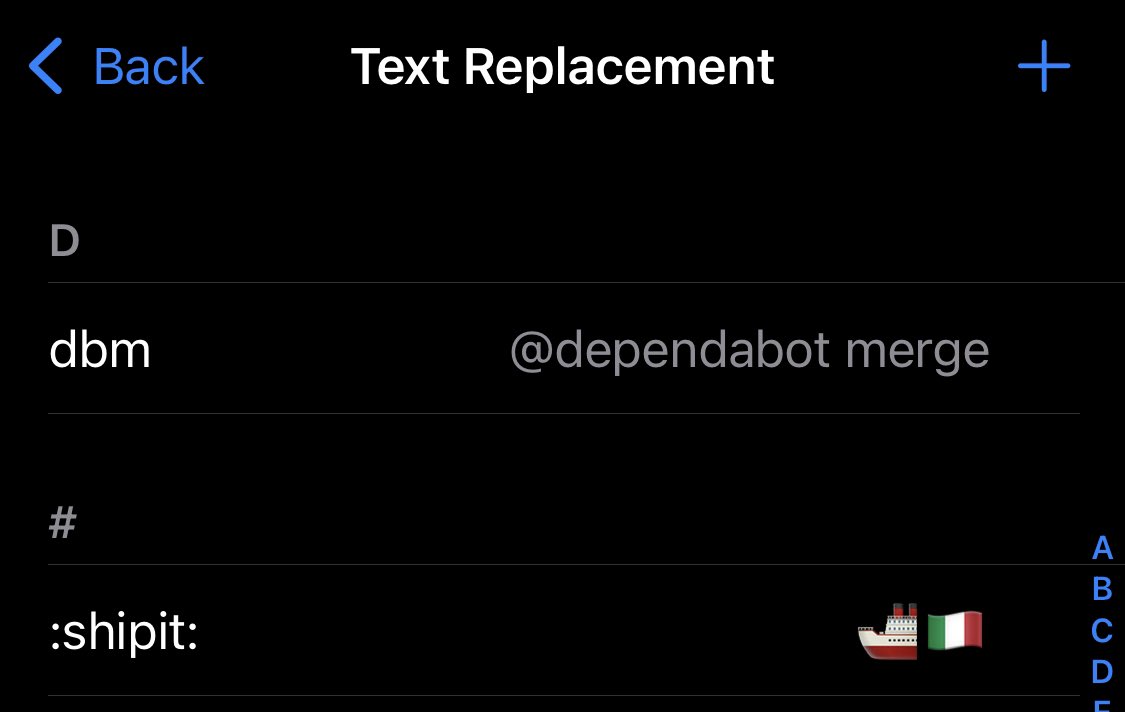
Ricers gonna rice
14 Aug 2025

Upgrade your terminal experience with these CLI tools:
1. fzf
2. ripgrep
3. bat
4. lsd
5. starship
6. just
7. nushell
8. procs
9. k9s
10. difftastic
11. hyperfine
3
213
6 Aug 2025
My small project of the day (POTD): packing @brendangregg’s Linux crisis tools in a Docker image for debugging performance issues in Kubernetes production environments github.com/basil/crisis-tool…
1
4
227
6 Jul 2025
I need to use the phrase “some intern at McKinsey is probably slopcoating a report on this but” more often
5 Jul 2025

some intern at mckinsey is probably slopcoating a report on this but let me give you an insider news: most large corps are not happy with the agentic systems & POCs they’ve done this year. 2025 was supposed to be the year of agents. so far it’s been the year of letdowns.
1
3
489