
I am a promoter Director of Sunidhi Securities & Finance Ltd a financial company and White Label E-Systems Pvt Ltd a financial technology company
Joined April 2010
- Tweets 193
- Following 475
- Followers 140
- Likes 139
2 Photos and videos

Pinned Tweet

15 Sep 2013
Time for elections in India coming near please ensure all eligible voters are registered
1
1
Bimal Parekh retweeted

"Let the strength of the market tell you where to put your money, not your personal opinion, which rarely is a good substitute for the wisdom of the market. Opinions mean nothing compared with the verdict of the market."
1
39
1,724
Bimal Parekh retweeted

25 Dec 2025
💯 MUST WATCH!
This video really puts into perspective how valuable our time truly is.
3
77
310
42,212
Bimal Parekh retweeted

12 May 2025
Please circulate this.
It should reach every Indian.
FM S JaiShankar ji clarification should be widely publicized..
Something which should be VIRAL .
Jai Hind 🇮🇳
174
13,841
32,641
890,224
Bimal Parekh retweeted

11 May 2025
Every single man on earth must watch this video 🙏
This video and more videos like this must go viral globally.
It's our responsibility to tell the truth to the world and burst Pakistan's fake news propaganda narrative.
60
4,134
9,750
224,856
Bimal Parekh retweeted

30 Aug 2024
In 1996 Intel was worth >$100B and practically owned the semiconductor industry. Nvidia was unknown.
Now Nvidia is worth $3 Trillion, 30X the market cap of Intel.
How did Jensen Huang take on Intel and win?
It's the 21st Century David vs Goliath story.
Thread
90
901
5,128
1,381,905
Bimal Parekh retweeted

4 Aug 2024
Nvidia CEO on how setbacks must be viewed as opportunities to learn and grow
8
331
1,134
88,295
Bimal Parekh retweeted

Stock P/E
BKT 46
Apollo 19
Ceat 17
One of the most common mistakes made by investors is looking at this data alone and saying:
“Avoid BKT and Buy Apollo & Ceat”
This is NOT even an Apple-to-Orange comparison.
Forget about Apple-to Apple.
Let's bust the myth here👇
The above example of BKT vs. Apollo Vs CEAT is a classic case of first-level thinking.
Howard Marks makes a compelling argument of first-level thinking vs second-level thinking in his newsletters to clients.
First-level thinking focuses on solving an immediate problem, with little or no consideration of the potential consequences. In Howard Marks' words, "First-level thinking is simplistic and superficial, and just about everyone can do it."
Most investment decisions need a deeper level of exploration, and this is the crux of second-level thinking.
So let’s make an attempt to wear the hat of Howard Marks here and explore second-level thinking.
Of course, the first-level thinking says BKT is expensive and Apollo and CEAT are cheap.
But let’s take a step back and ask, why does BKT trade at a higher multiple than Apollo & Ceat?
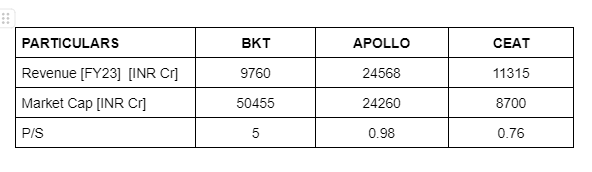
Let’s put some numbers here to get more clarity.
Anyone can deduce this from the above data:
BKT has the lowest revenue among all three. In fact, Apollo’s revenue is 2.5x BKT’s revenue. Yet, BKT’s market cap is 5x of Ceat’s market cap and 2X of Apollo’s market cap.
Rather than dismissing BKT as a highly overvalued stock, one should ask why there is such an anomaly.
That’s the start of walking on the path of second-level thinking.
While all three are in the business of making tires, you will appreciate the difference between them when we share more data points.
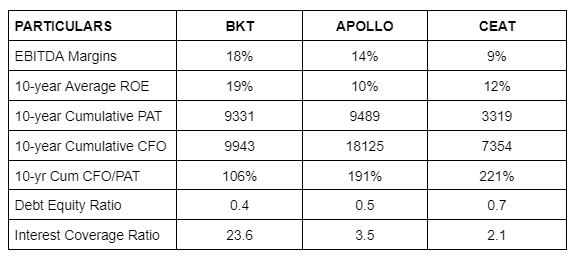
And what do we deduce from the above numbers?
Three major points:
1. Margins & ROEs of BKT are way better than Apollo and CEAT
2. BKT has a far better Balance Sheet with low debt and a high cushion of profits to serve the debt.
3. CFO/PAT is the only metric where Apollo and CEAT score drastically over BKT.
The next question that should come to your mind is this:
Why CEAT and Apollo have a higher CFO conversion of PAT than BKT?
The answer lies in the high depreciation.
Both CEAT and Apollo have had very high depreciation in the last 10 years with respect to the PAT they have generated in those years.
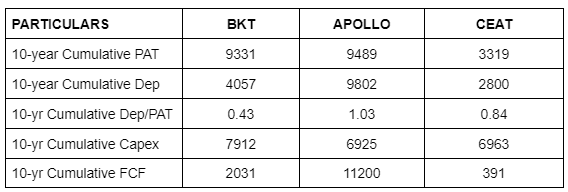
High depreciation reduces profits. But as depreciation is a non-cash expense, it does not affect your CFO. But high depreciation also means higher capex. Just having a higher Capex does not matter. It should reflect in terms of higher Sales, higher profits, and higher cash flow generation from operations in the future. This should eventually be reflected in the FCF generation over long periods.
Let’s have a look at that.
P.S. These are rough calculations. For example, Capex includes only assets purchased. We have not done the adjustment of assets sold as it was negligible in the larger scheme of things.
Now, this is interesting.
BKT having half the revenue of Apollo and slightly lower revenue than even CEAT, has invested the highest among all 3 in terms of Capex.
Also Depreciation numbers of BKT are higher than CEAT despite a similar scale and half of Apollo as scale is also half of Apollo's. But the interesting thing to note is that BKT produces far better profits to absorb this depreciation compared to the other two.
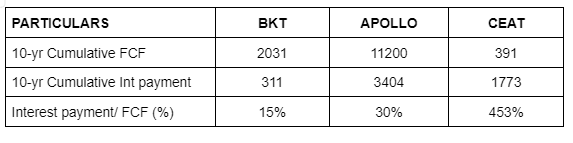
While the FCF of Apollo seems great at 11200 Cr compared to 2031 Cr of BKT and only 391 Cr of CEAT, the important point to notice is that a large part of this FCF is used for serving debt in the case of Apollo and CEAT, while in the case of BKT, it is used predominantly in strengthening the Balance Sheet.
So, now you understand how BKT is a superior business to Apollo and CEAT, even though all three businesses are in the field of manufacturing and selling tires.
Only with the help of studying the financials and asking simple logical questions as we have done above, you can also practice second-level thinking.
If you wish to know more about the business of BKT, we did a deep dive into BKT in 2021.
Nothing much has changed since then. So you can watch it even today.
BKT- Boring Business Steady Compounder [youtu.be/MTxccQ_sUmw]
Please note that this is not a recommendation to initiate a buy on BKT at the current valuation.
Also, it would be foolish to believe that a stock that has been a 20-bagger in the last 10 years will again be a 20-bagger in the next 10 years. Starting valuation matters a lot. BKT for example was available at 6 times TTM earnings in 2013. Today it is at 46 times.
The purpose of the post was just to highlight how investors often make the mistake of just taking one metric to decide which stock to buy and which one to avoid.
They fall prey to heuristic-led thinking which is what first-level thinkers do. If you wish to learn from the greats like Howard Marks, try to become a second-level thinker.
Our team works really hard to come up with these differential insights on different businesses.
It will do us a world of good if you can "REPOST" this post. It will help us reach out to more investors who may gain from our work. 🙏
If you wish to receive more long posts like this, do let us know in the comment section with a "YES".
If you find value in our research, do follow us @SmartSyncServ
Thank you for reading🙏
33
88
342
91,877
Bimal Parekh retweeted

11 Sep 2023
Best visual depiction of how the economic corridor will look like, see what the government has accomplished
35
394
1,287
139,241
Bimal Parekh retweeted
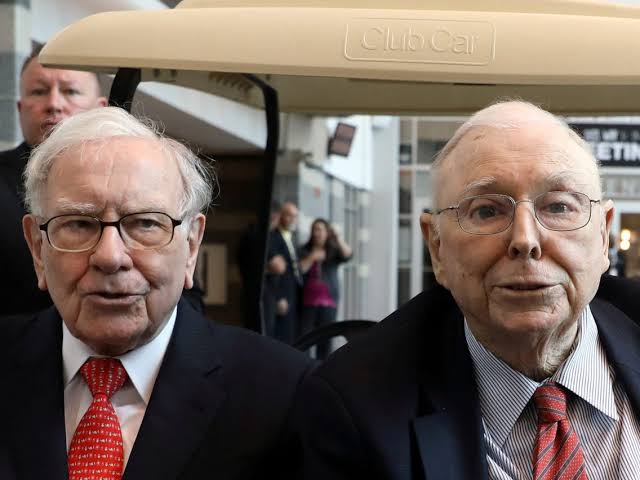
Berkshire Hathaway 2022 Letter is out.
It's fashionable these days to mock Buffett & Munger.
Statutory Warning ⚠️
You'll be disappointed if you are expecting any mockery here.
Top 15 quotes in the 2022 letter from Buffett & Munger.
A 🧵
5
63
131
90,473
Bimal Parekh retweeted

29 Jul 2022
Epic things start to happen when Indians own 🇮🇳 companies compounding profits at 10-15-20%
🇮🇳🇮🇳
3
24
183
Bimal Parekh retweeted

21 Jun 2022
"You gotta kiss a lot of frogs to find your prince."
- Investment strategy for Microcaps & Smallcaps
1
4
78
Bimal Parekh retweeted

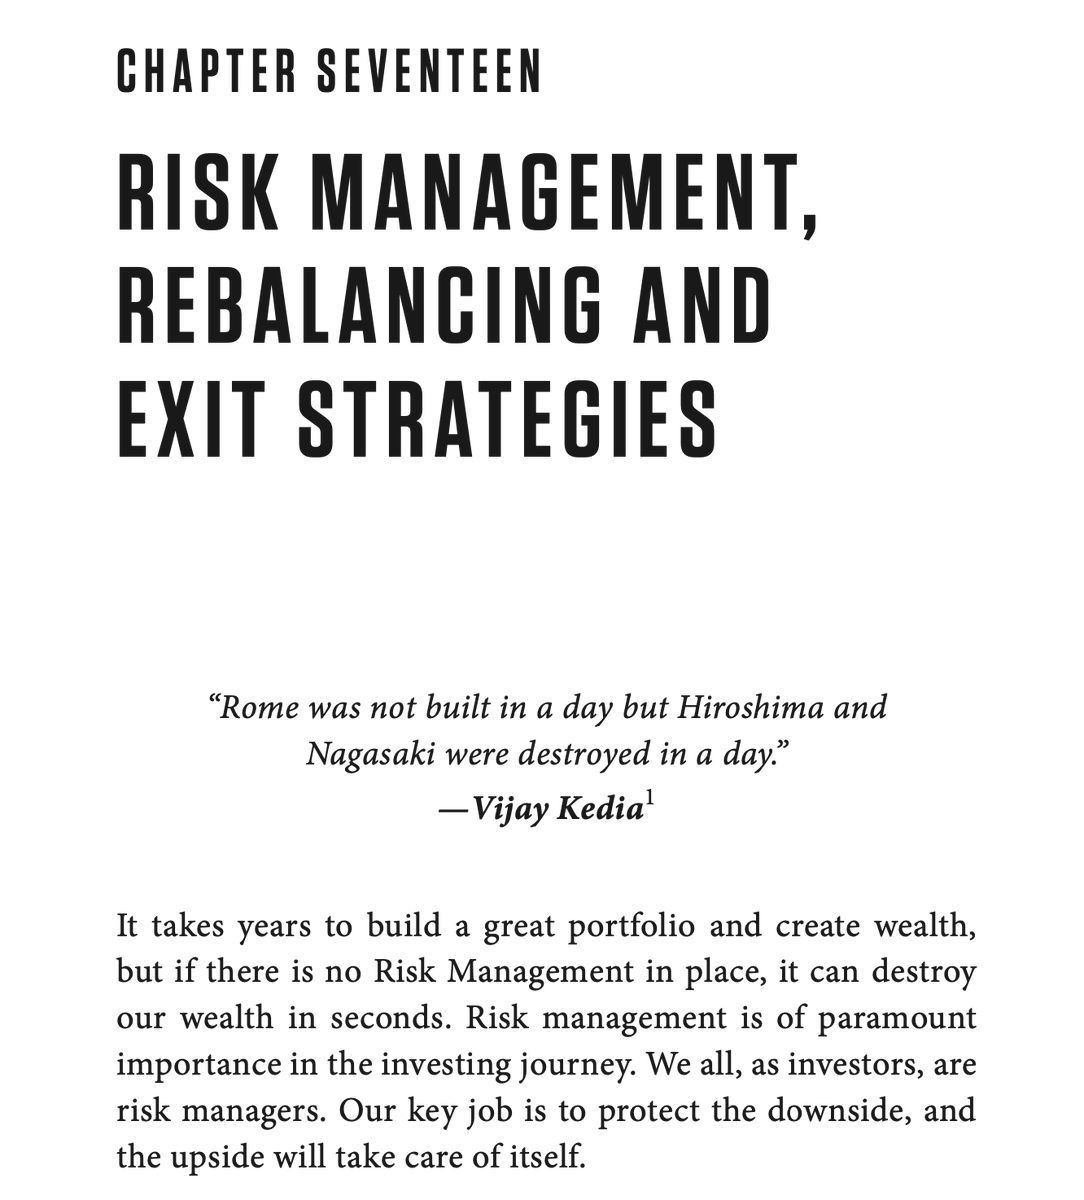
12 May 2022
💡
The biggest learning from #ARKK Cathie Wood fall is that we need to focus first on RISK MANAGEMENT.
Having no clue about cutting losses can be a disaster
In my upcoming book, I have dedicated chapters to Risk management & allocation
Starts with a quote from @VijayKedia1
10
18
101
Bimal Parekh retweeted
22 Nov 2021
"rationale” has not changed: that if India bans crypto it will fall behind the technology curve and the country will lose out on the innovation cycle. This is a bogey that needs to be demolished." news18.com/news/opinion/cryp… via @News18.com
7
3
9
Bimal Parekh retweeted

16 Oct 2021
@MashraniVivek One of the most beautiful groups of people I ever had the pleasure of speaking to. Love and best wishes to all of you. 😇🙏 Please pass my message to the group.


37
86
225
Bimal Parekh retweeted

2 Oct 2021
What a Brilliant Job RBI is doing
- Supporting Growth
- Managing Liquidity
- Managing Rupee
- Managing/ Supporting Govts massive borrowing Program
- Keeping Inflation within Target Range
- Ensuring Financial Market Functioning/ Stability
- Supervising Banks & NBFCs
1 Oct 2021

Real Central Bank Rates (rate minus inflation)...
Argentina: -13.4%
Poland: -5.4%
US: -5.2%
Peru: -4.0%
Eurozone: -3.9%
Canada: -3.9%
Australia: -3.7%
Brazil: -3.4%
Chile: -3.3%
Norway: -3.2%
UK: -3.1%
Philippines: -2.9%
Czech Rep: -2.6%
Sweden: -2.1%
Swiss: -1.7%
India: -1.3%
38
168
1,018
Bimal Parekh retweeted
1 Oct 2021
99% of investing ideas are wasted...
Only 1% will ultimately create wealth...
It's always quest to find those 1% ideas which you can then heavily allocate capital to create wealth..
This is where compounding J-curve will kick-in...
Same applies in other aspects of life
🚀
10
66
Bimal Parekh retweeted

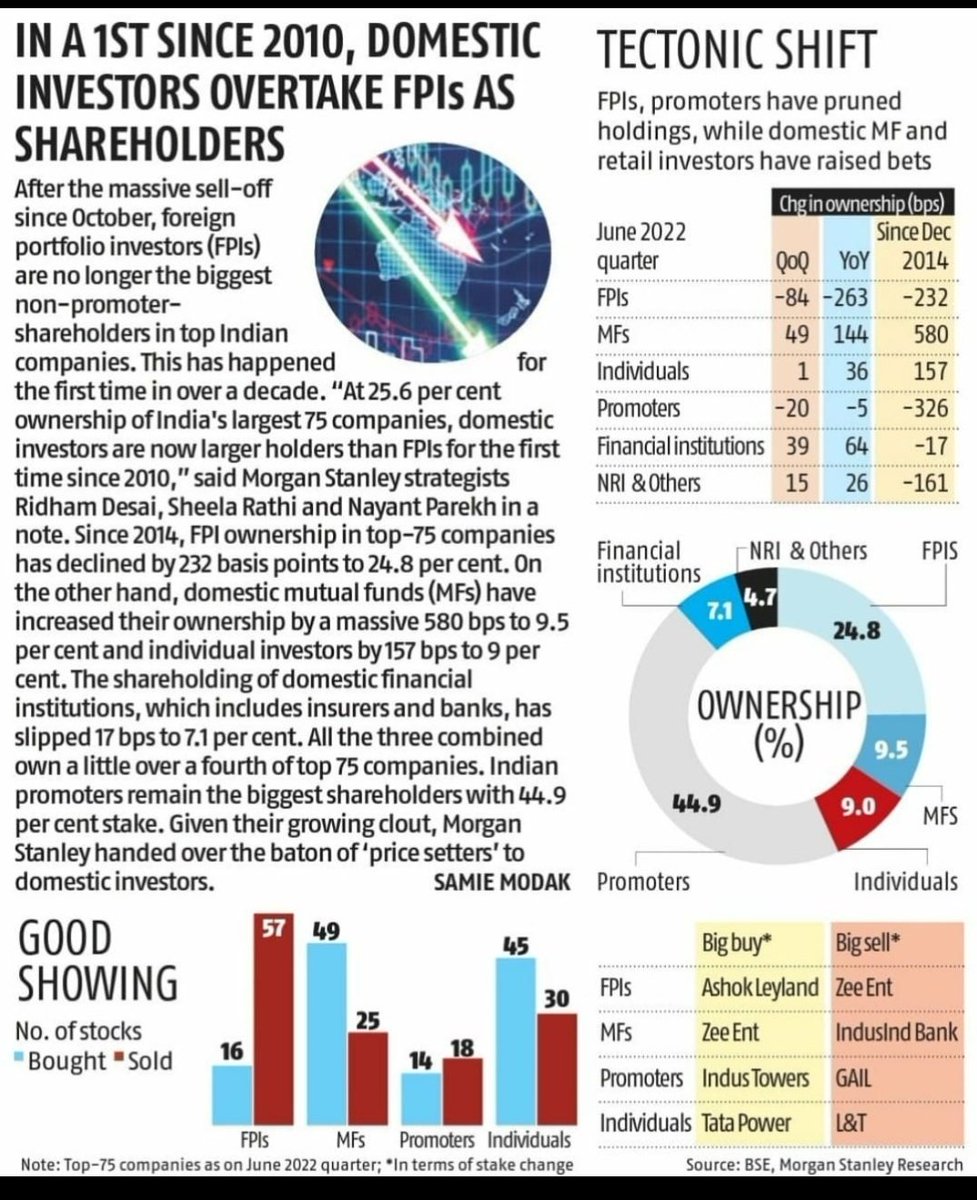
2 Oct 2021
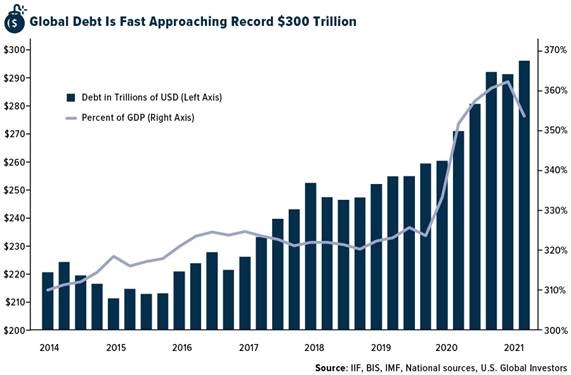
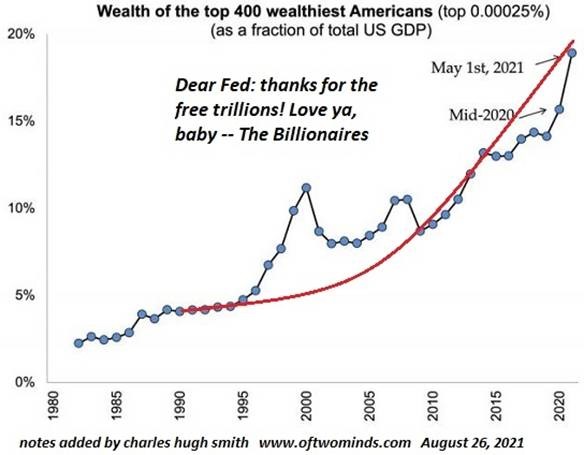
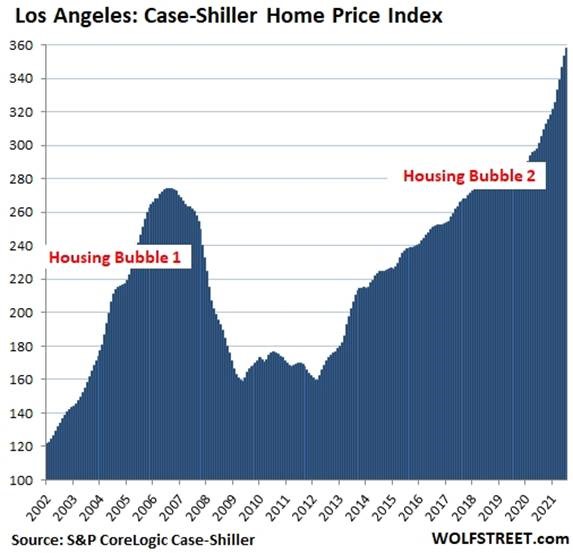
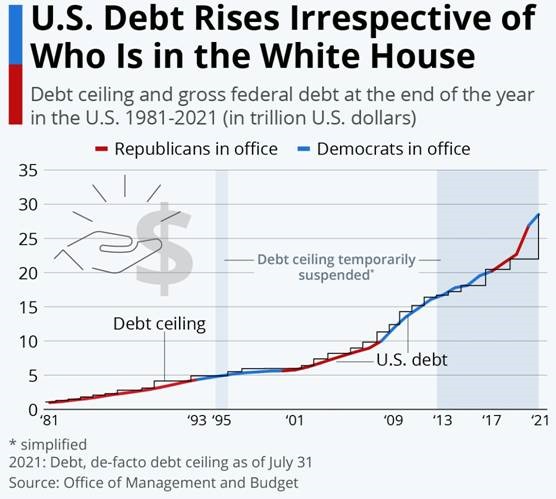
Important data points which should not be ignored.
3
3
Bimal Parekh retweeted
26 Sep 2021
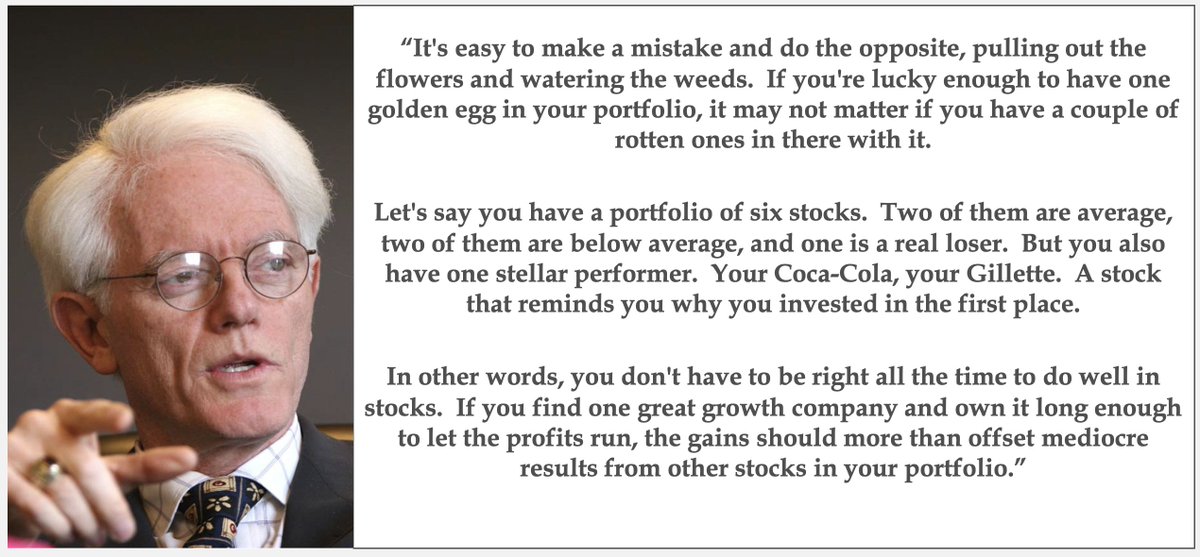
For initial research, one can have 2 parts in their portfolio...
1 - where capital protection is focus by investing in existing bluechips (here returns will be moderate)
2 - In laboratory of new ideas..you can call it satellite..
See how Peter Lynch made this point..
(4/n)

1
4
42
Bimal Parekh retweeted
26 Sep 2021
So the point is....we need to have such a process...where we put foot in the door where probability of winning seems high..
Then business executes..sector tailwinds further help the company..
Basically Riding winners as they perform..
What next?
(6/n)
1
5
35