
IT strategy, data analysis, machine learning, mountains hiking and skiing.
- Tweets 272
- Following 411
- Followers 764
- Likes 764


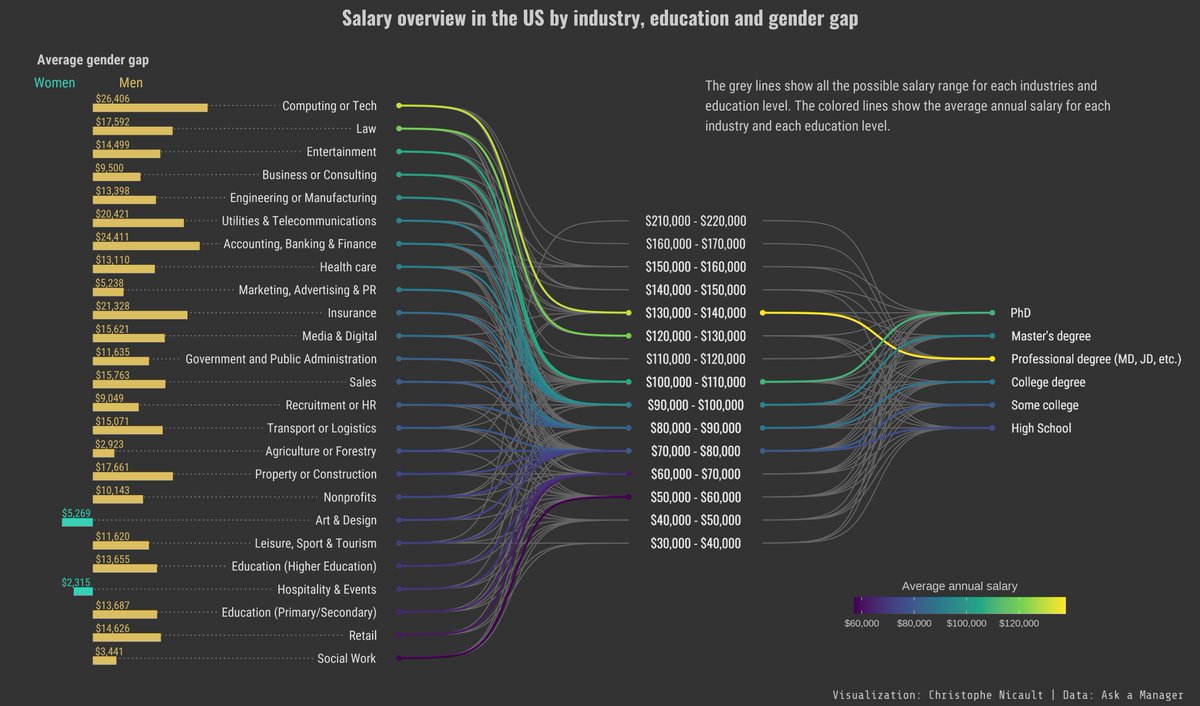
ALT The plot shows the average annual salary for each industry and each education level, as well as the gender gap per industry. The top industry are Computing or Tech with a annual salary in the range 130000 / 140000, and Law with a annual salary in the range 120000 / 130000. The lowest are social worker (50000 - 60000) and Retail (60000-70000). The annual salary range goes from 30000-40000 to 210000-220000. The education with the highest average salary is Professional degree (130000-140000) followed by PhD 130000-140000. The highest gender gap is in tech with $26400 difference. Only in art & design and Hospitality & events women earn more than men on average.
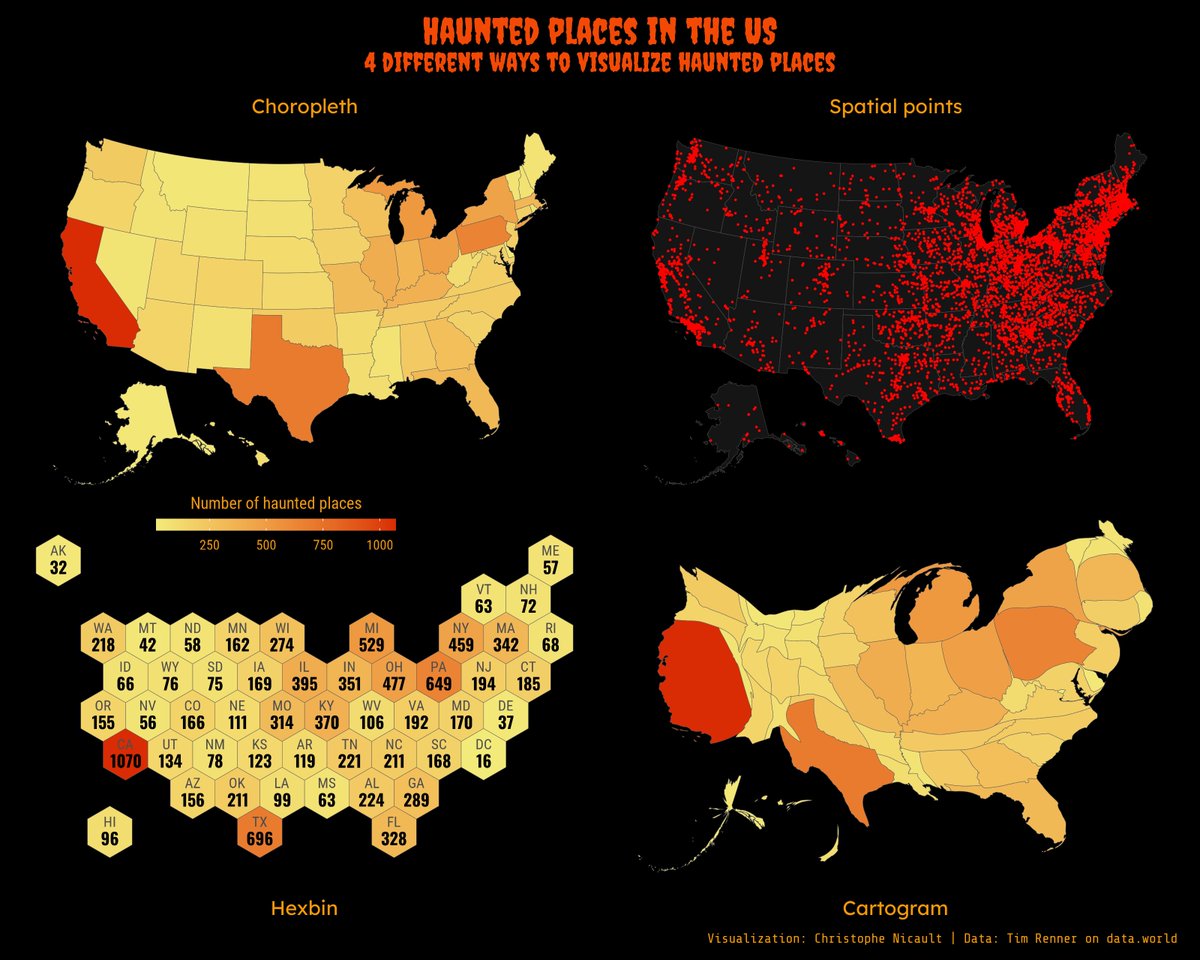
ALT There a are four visualizations showing the number of haunted places on a map. Three maps showing the total per states, with a choropleth map, an hexbin map, a cartogram, and a map with all the points.


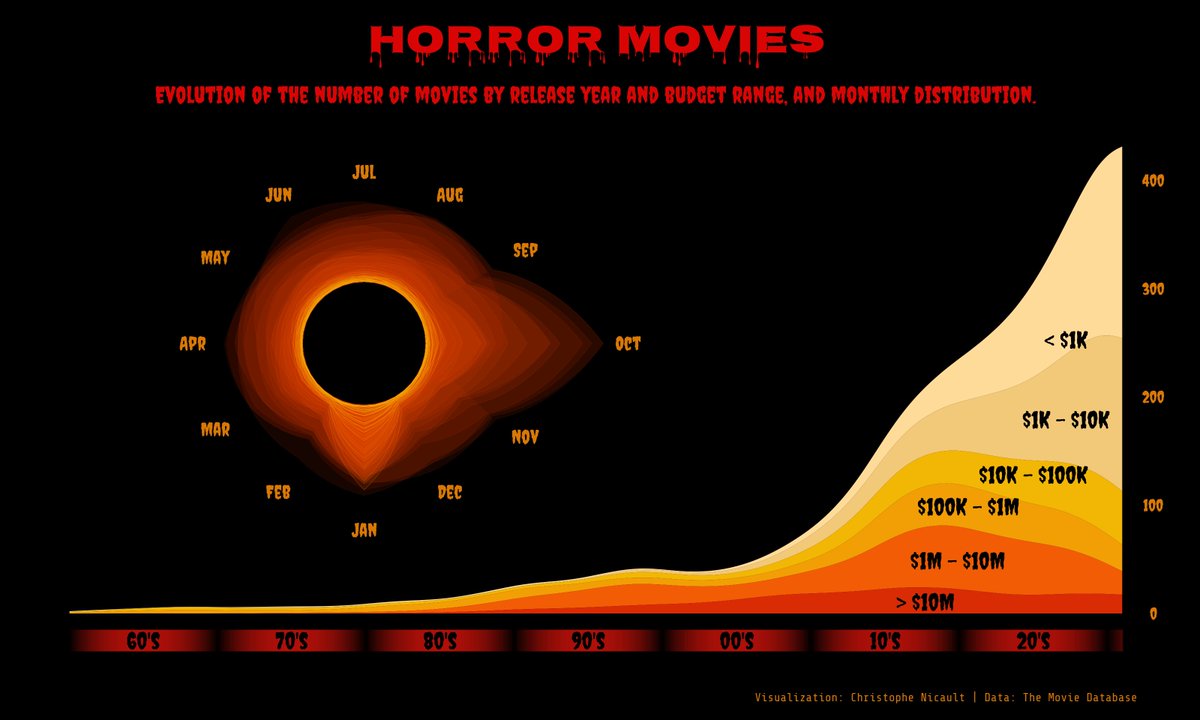
ALT One graph shows the number of movies per year by budget range, showing that the increase is mainly due to low-budget movies. The second graph shows the monthly distribution with a clear peak in October and a high number of releases in January.
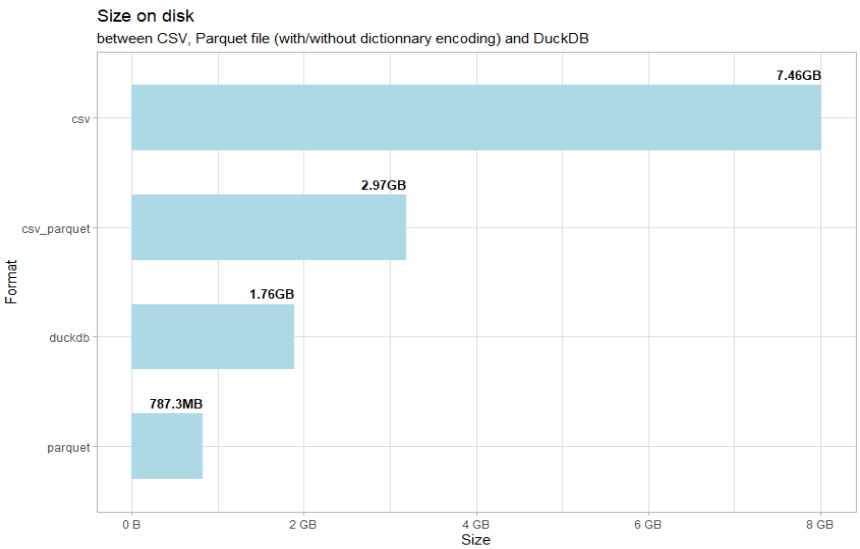
ALT Size of files on disk according to the different formats, showing that The DuckDB format is almost 4 times smaller than csv, and Parquet almost 10 times smaller.
ALT The top graph shows the evolution of the number of transistors (in million, log scale) in chips from 2020 to 2021. The bottom graph shows the process size (in nm) of those chips during the period they were manufactured.
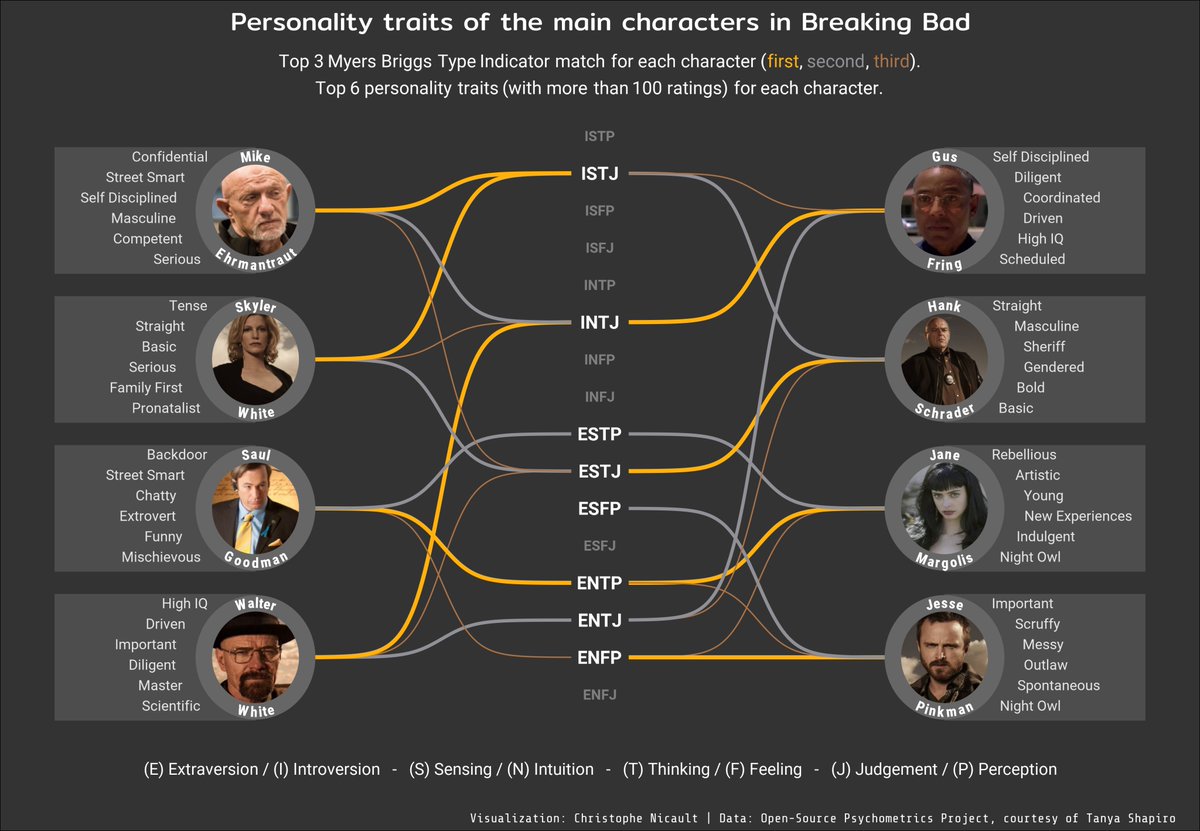
ALT The visualization shows the top 3 Myers Briggs Type Indicator match for each character in Breaking Bad, and their top 6 personality traits.
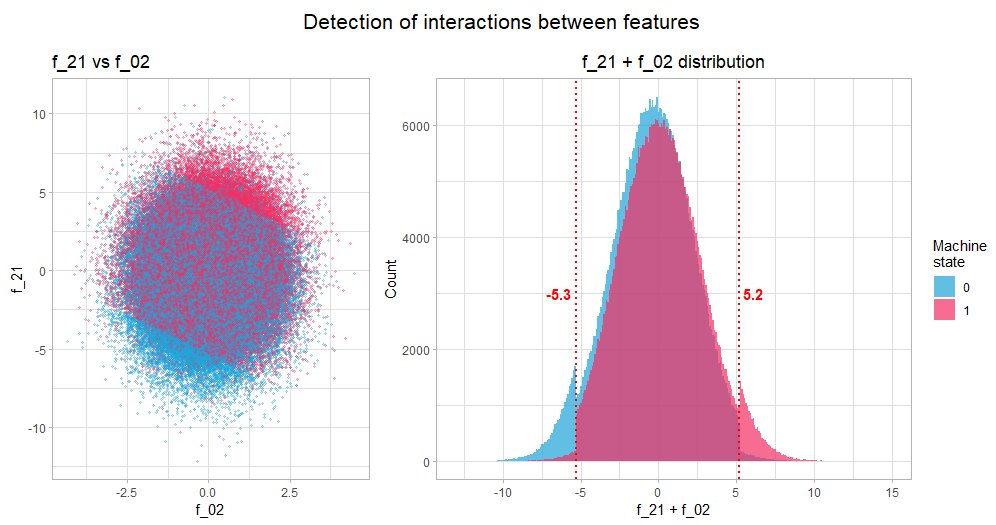
ALT A scatterplot and a distribution of 2 variables to show the feature interactions, as an example to create a new feature to improve a model.
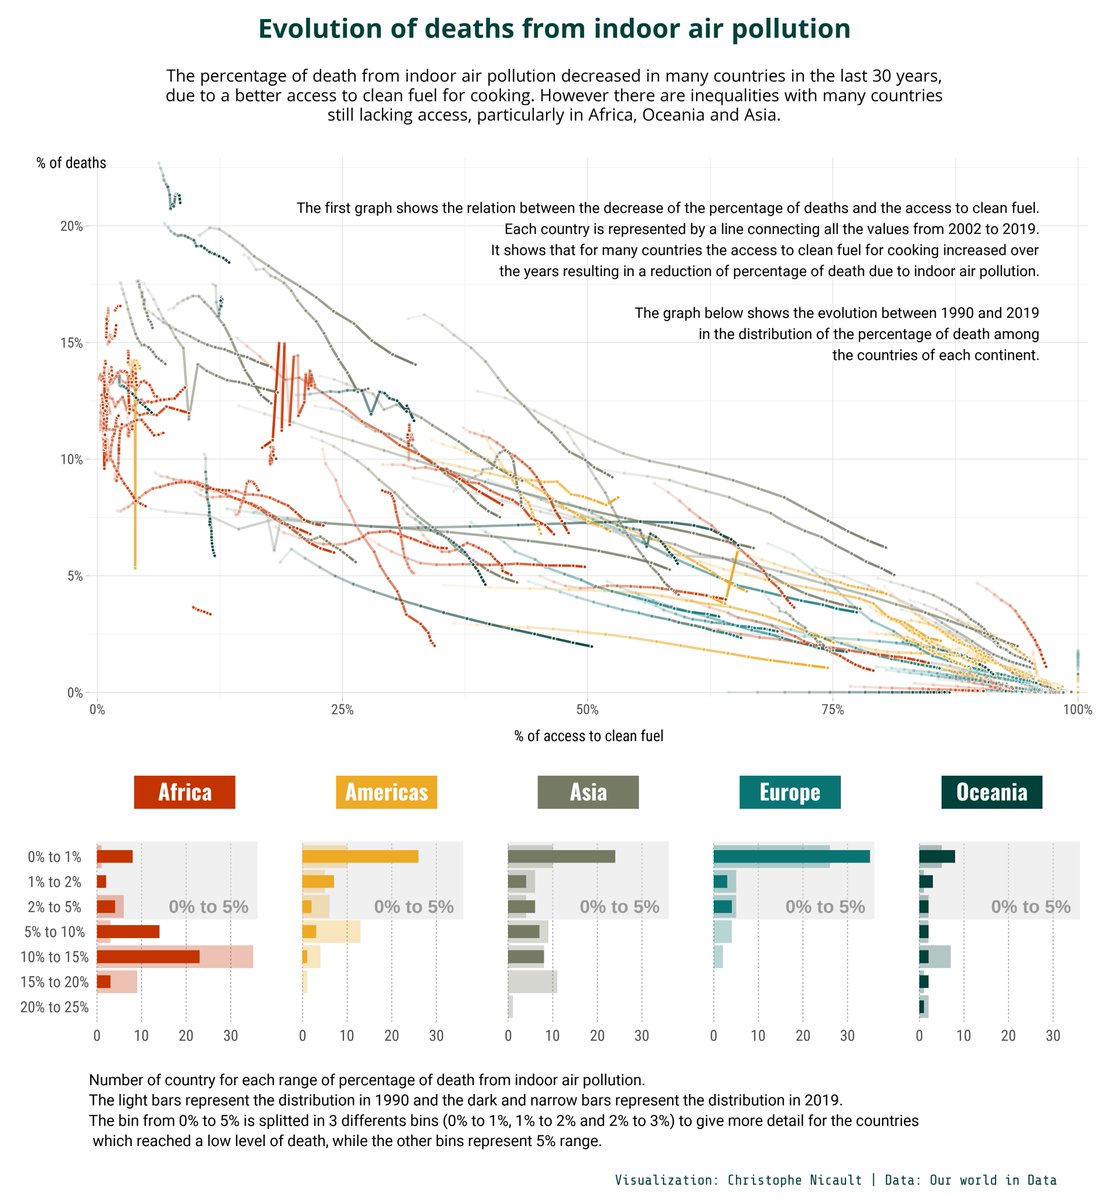
ALT The first graph shows the relation between the decrease of the percentage of deaths and the access to clean fuel. Each country is represented by a line connecting all the values from 2002 to 2019. It shows that for many countries the access to clean fuel for cooking increased over the years resulting in a reduction of percentage of death due to indoor air pollution. The graph below shows the evolution between 1990 and 2019 in the distribution of the percentage of death among the countries of each continent.

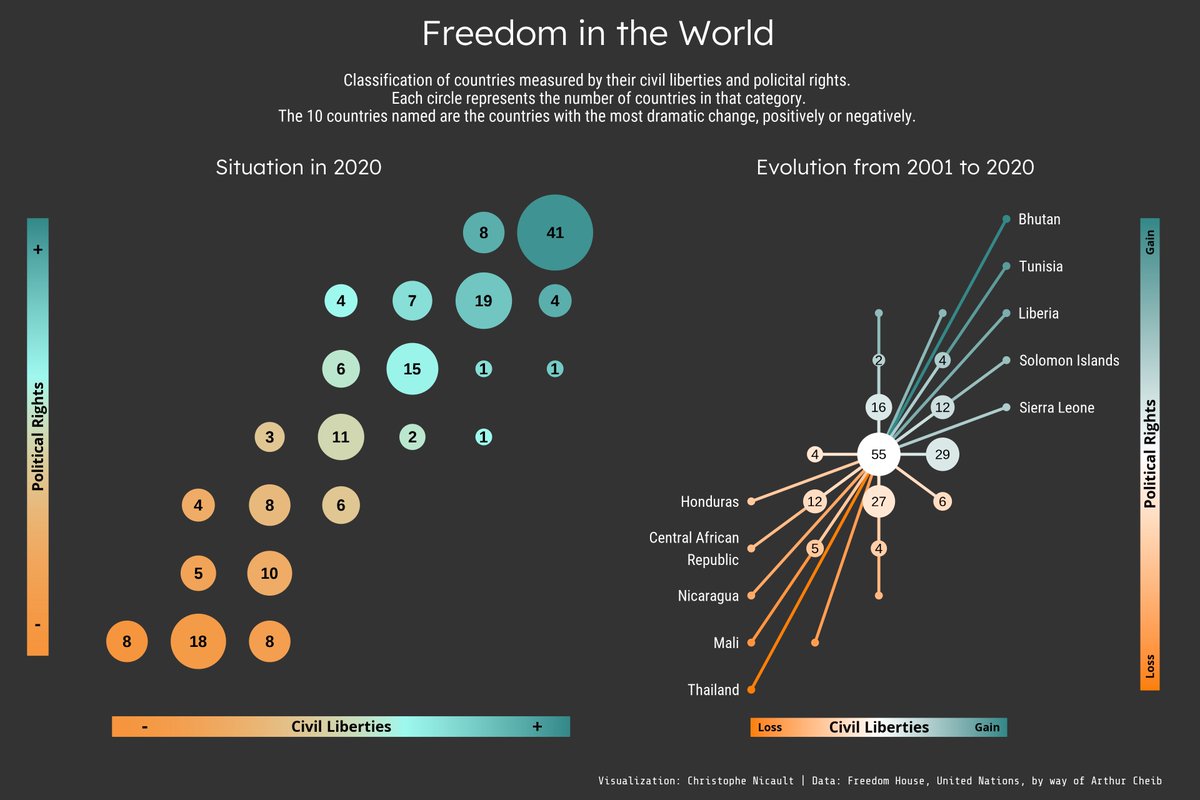
ALT The visualization shows the number of countries according to their position in the spectrum of civil liberties and political rights, as well as the evolution between 2001 and 2010. 70 countries improved while 65 have deteriorated.

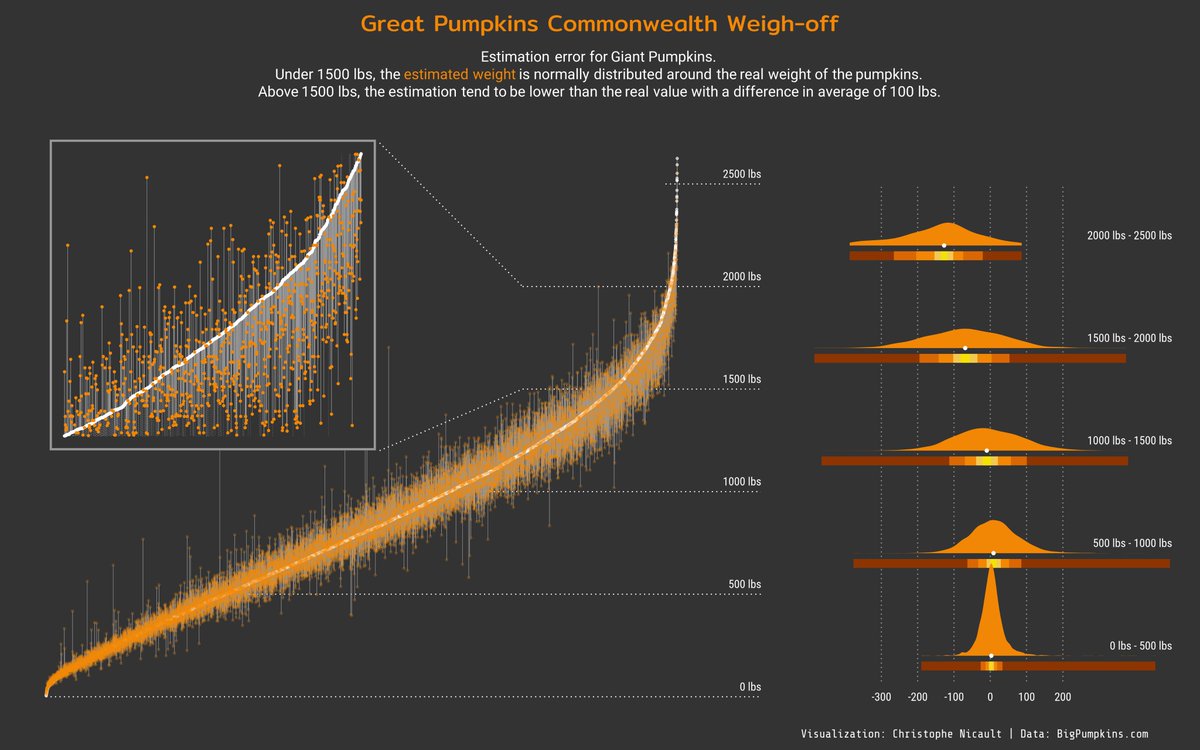
ALT Estimation error for Giant Pumpkins for Great Pumpkins Commonwealth Weigh-off. Under 1500 lbs, the is normally distributed around the real weight of the pumpkins. Above 1500 lbs, the estimation tend to be lower than the real value with a difference in average of 100 lbs.
ALT The visualization shows the upward evolution of the seafood production, and that 4 countries (China, India, Indonesia and Peru) fish about half the world production.
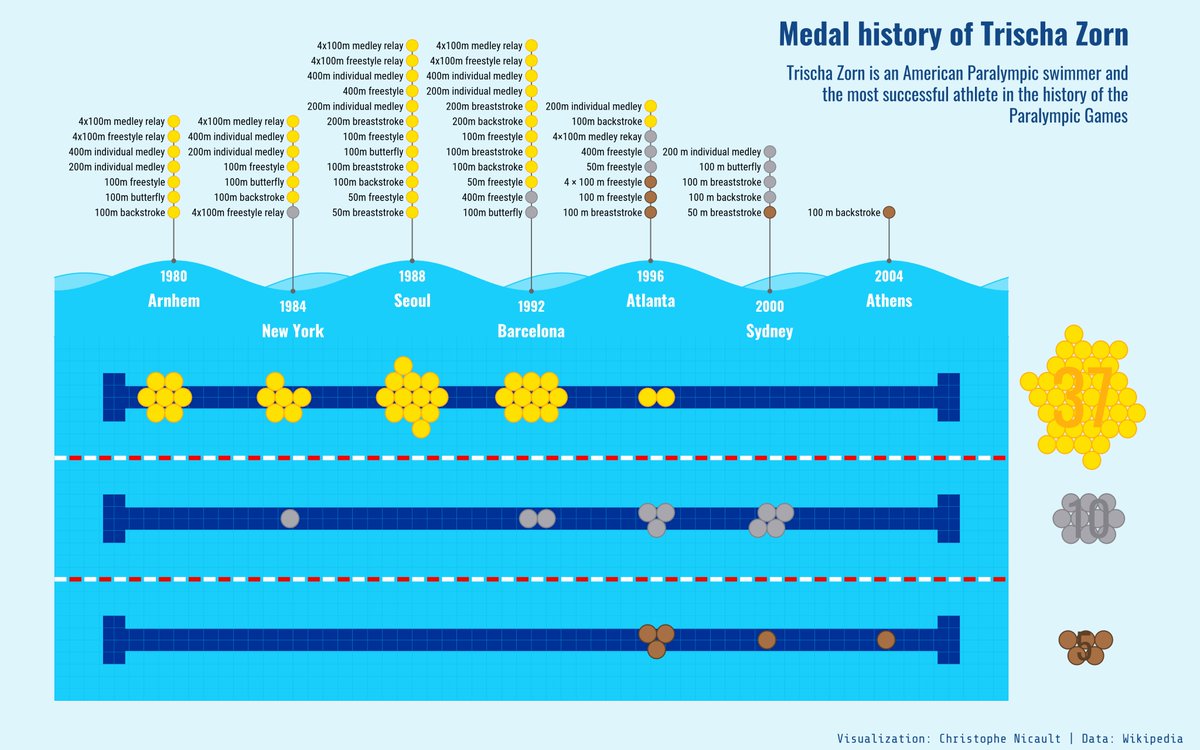
ALT The visualization shows the medal record of Trischa Zorn who is the most successful athlete in the history of the Paralympic Games. It represents a swimming pool which a lane per medal, and on the length, the 7 Games she participated. She won 37 gold medals, 10 silver, and 5 bronze.