Grateful and present. We all have a positive role to play. Find yours and get in character. My views are mine.
Joined June 2009
- Tweets 55,399
- Following 2,776
- Followers 663
- Likes 20,565
15,859 Photos and videos

A call 4 Voting Rights & gun reform 202-224-3121 retweeted

8 Nov 2024
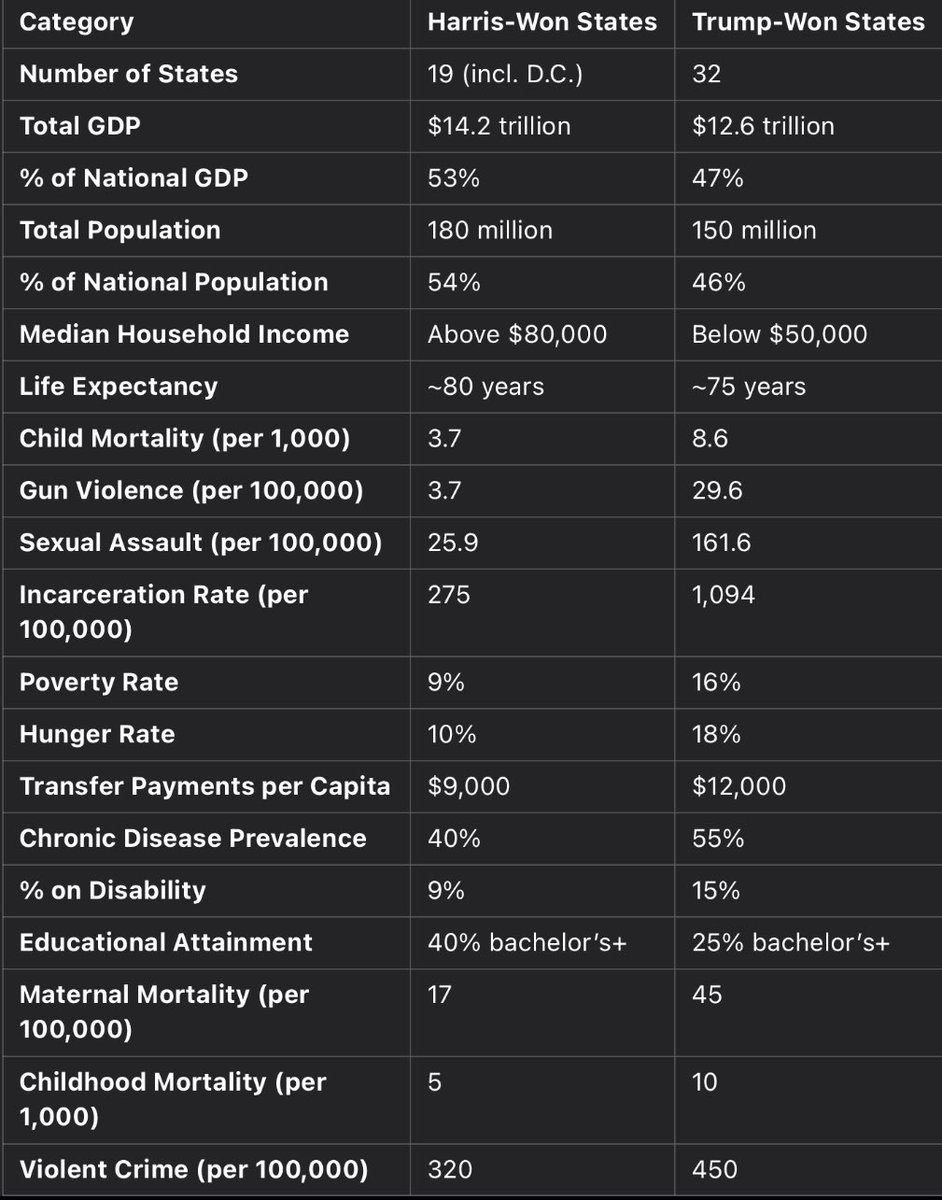
🧵Harris-won states perform better economically, contributing more to GDP, with higher incomes, better education levels, and longer life expectancies. They also have lower rates of poverty, crime, and chronic illness. Trump-won states, in contrast, face higher poverty, more gun violence, higher incarceration, and more chronic disease prevalence.
Economic Performance
•GDP Contribution: Harris-won states contribute a larger share of the national GDP (53%) compared to Trump-won states (47%), even though they represent a smaller number of states. This higher economic output correlates with generally higher incomes, greater population density in urban areas, and a concentration of industries like technology and finance, which tend to generate higher GDP.
•Median Household Income: The median household income in Harris-won states is significantly higher, with an average above $80,000, compared to below $50,000 in Trump-won states. This suggests a disparity in economic opportunity, wage levels, and possibly cost of living, with Harris-won states generally offering higher-paying jobs.
Public Health Indicators
•Life Expectancy: Residents in Harris-won states have a higher average life expectancy (around 80 years) compared to Trump-won states (approximately 75 years). This difference may be influenced by factors such as access to healthcare, lifestyle, and economic conditions, which can directly impact overall health outcomes.
•Child and Maternal Mortality: Both child and maternal mortality rates are notably lower in Harris-won states, suggesting better access to healthcare services, more robust public health systems, and potentially better social safety nets.
•Chronic Disease and Disability: Trump-won states show higher rates of chronic disease (55% vs. 40%) and a larger percentage of the population on disability (15% vs. 9%). These metrics may indicate challenges with healthcare accessibility, preventive care, and lifestyle factors.
Social and Crime Indicators
•Incarceration Rate: Trump-won states have a significantly higher incarceration rate (1,094 per 100,000) compared to Harris-won states (275 per 100,000). This may reflect differences in criminal justice policies, socioeconomic conditions, and crime rates, with higher incarceration often associated with poverty and limited access to social services.
•Violent Crime and Gun Violence: Violent crime and gun-related mortality are higher in Trump-won states. Gun violence, specifically, is considerably more prevalent (29.6 vs. 3.7 per 100,000), suggesting possible differences in gun laws, cultural attitudes towards firearms, and socioeconomic pressures that contribute to crime.
Education and Poverty Indicators
•Educational Attainment: Harris-won states have a higher percentage of residents with at least a bachelor’s degree (40% vs. 25%). Higher educational attainment is often linked to better job prospects, higher incomes, and overall economic growth, which could partially explain the income and GDP differences.
•Poverty and Hunger: Poverty and hunger rates are higher in Trump-won states, with poverty at 16% compared to 9% in Harris-won states, and hunger at 18% vs. 10%. These disparities suggest greater economic hardship and food insecurity in Trump-won states, likely affecting overall quality of life and contributing to poorer health outcomes.
Key Takeaways
1.Economic and Educational Advantages in Harris-Won States: Higher GDP, median income, and educational attainment in Harris-won states indicate stronger economic foundations, which support better living standards and health outcomes.
2.Public Health and Crime Challenges in Trump-Won States: Trump-won states face significant challenges related to public health, with higher rates of chronic disease, disability, maternal and child mortality, as well as crime and gun violence. These factors reflect systemic issues in healthcare access, economic conditions, and public health issues.🧵
79
662
1,481
117,398
A call 4 Voting Rights & gun reform 202-224-3121 retweeted

5 Nov 2024
70 Tribal/Native American Leaders Endorse #KamalaHarrisForPresident; Going into Election Day Harris Leads Trump - @nativenews_net
#Kamala will support Tribal families, strengthen nation-to-nation relationships, and create pathways for Native Americans to thrive. 🧵for link

1
1
4
278
A call 4 Voting Rights & gun reform 202-224-3121 retweeted

3 Nov 2024
Unearthed audio of Steve Bannon from 2020: “What Trump is gonna do is declare victory. That doesn’t mean he’s the winner. He’s just gonna say he’s the winner… He’s just gonna say they stole it. Trump is gonna do some crazy shit”
1,800
18,611
53,950
4,937,859
A call 4 Voting Rights & gun reform 202-224-3121 retweeted

31 Oct 2024
Trump supporter calls one Black woman a b*tch and assaults another because he doesn’t want to remove his Trump hat to obey the rules against wearing campaign paraphernalia in the polling location.
This is the prototype racist Trump supporter.
10,940
22,676
130,145
11,645,044
A call 4 Voting Rights & gun reform 202-224-3121 retweeted

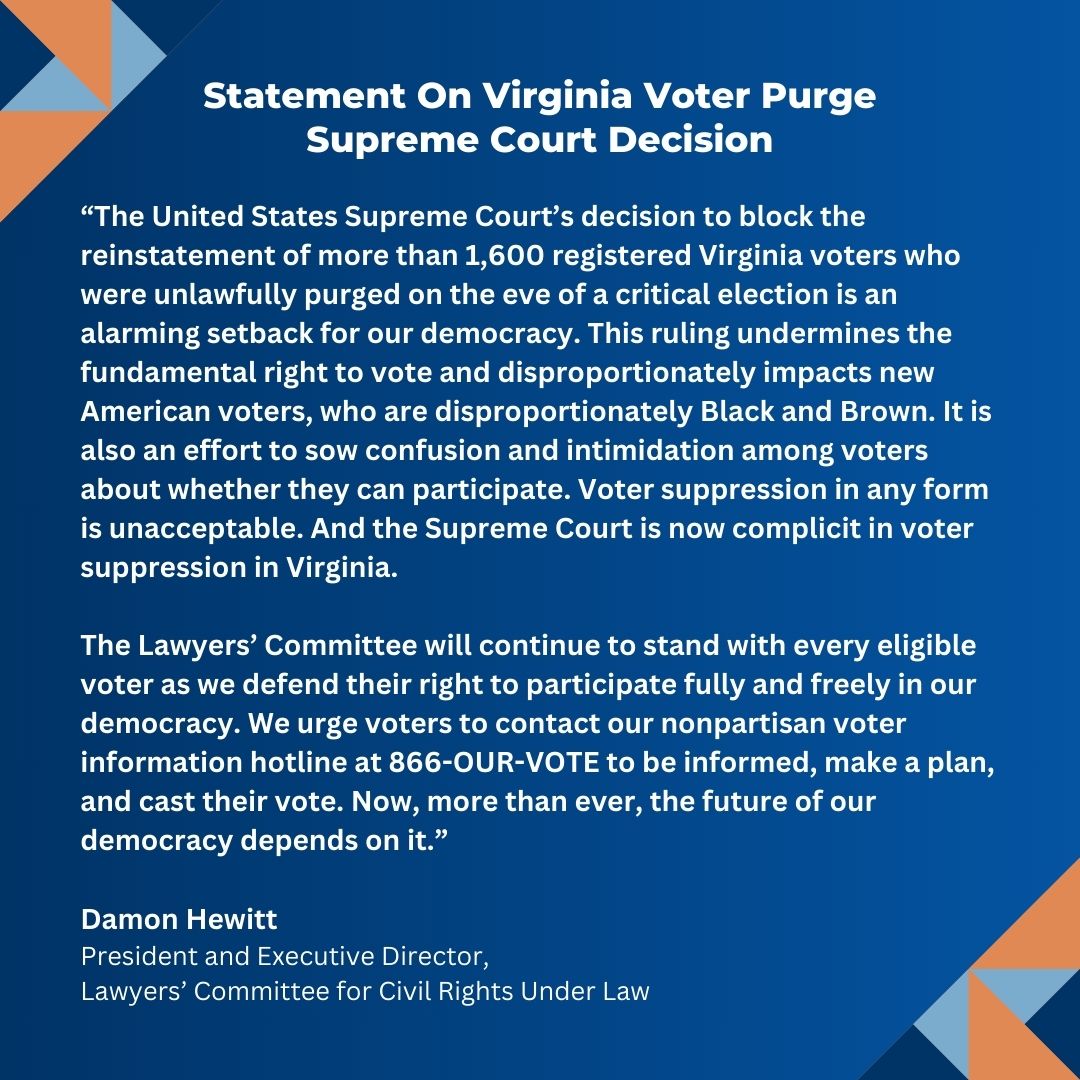
Statement by Lawyers’ Committee President and Executive Director, Damon Hewitt, on today’s Supreme Court decision which purged over 1,600 registered voters from registration rolls.
1
4
5
710

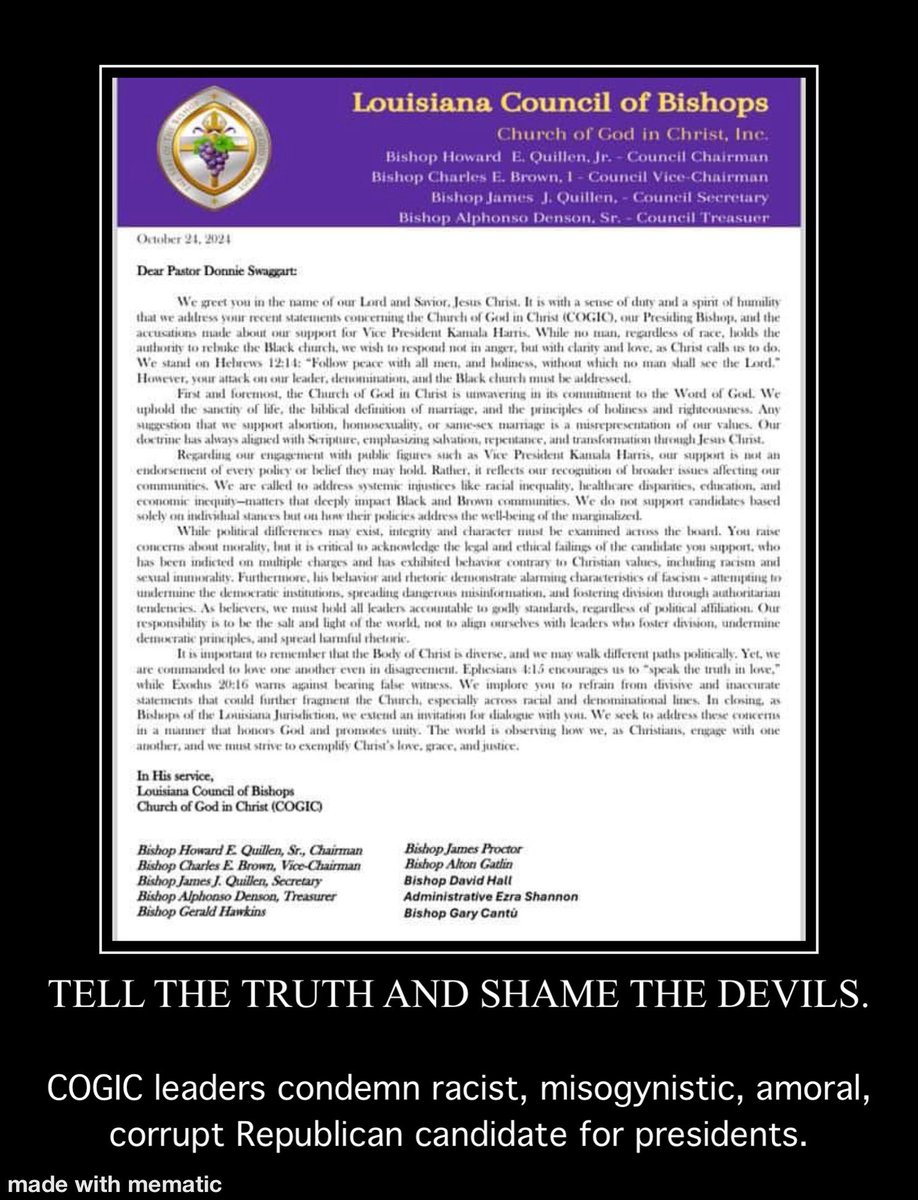
GOPvangelicals defends a pathological liar. eddmarv.medium.com/the-convi… See @GOP embrace Nebuchadnezzar 2.0 of MAGA Babylon. apple.news/AUwNSuNOyT7ifesWg… & medium.com/@eddmarv/thingsje… @jdrewsheard_JDS @COGICisLIVE @VoteCommon @SojoAction @FIAnational @CBNOnline @CTmagazine @ChristianSocAct
24 Oct 2024

Evangelicals, please learn to keep the Black Church’s name out of your mouth!
soulprospermedia.com/the-bla…
15
A call 4 Voting Rights & gun reform 202-224-3121 retweeted

29 Oct 2024
In case you missed this, you can sign up and watch, now & receive the recording, later: abfe.org/events/ferguson-fut… #ChosenForChange Phillip Agnew, @blackmenbuild & Alethea Bonello @BlackVotersMtr. @Mvmnt4BlkLives @byp100 @Mvmnt4BlkLives @Funders4Justice @CapitalBNews @FaithInAction
1
34
A call 4 Voting Rights & gun reform 202-224-3121 retweeted

26 Oct 2024
Michelle Obama really hit this one out of the park! If there is anything you watch today make sure it's this!
608
2,907
10,475
1,380,853
A call 4 Voting Rights & gun reform 202-224-3121 retweeted

26 Oct 2024
60,000 Americans die unnecessarily every year because they can't afford to see a doctor.
1 out of 4 cancer patients in this country go bankrupt or lose their home.
Insane. Cruel. Wrong.
We need a health care system that works for all of us.
562
1,752
6,002
498,661
Amen & say it louder! eddmarv.medium.com/thingsjes… Pray & ACT! eddmarv.medium.com/election-… @COGICisLIVE @VoteCommon @zionchurchorg @AlfredStreetBC @MethodistGB @USCCB @FaithInAction @newbirthmbc @FBCG @UnionSeminary @blackchurchpac @NBCIBlackChurch A FALSE prophet eddmarv.medium.com/finding-r…

23

“We are grabbing back the pen to write a new American story.” - @kellyrowland
#KellyRowland joined #kamalaharris at a Houston rally where she delivered a spirited speech, and encouraged Texans to vote in this pivotal election.
More on #NewsOne.com
🎥: @KamalaHarris
33
293
1,118
24,360
A call 4 Voting Rights & gun reform 202-224-3121 retweeted
26 Oct 2024
.@Beyonce’s full remarks in support of Vice President Harris
3,688
13,121
71,217
11,910,904
Remember when President 45 called the National Guard against peaceful protestors? nbcnews.com/think/amp/ncna12… Ex-gov & senate candidate Larry Hogan, thanked him. eddmarv.medium.com/no-thank-… @GOP will do it again, if given the chance. cnn.com/2024/10/13/politics/… @americansunited #VoteBlue
10

Obama performs Eminem’s 'Lose Yourself' at Kamala Harris' Detroit rally
x.com/__0___0___o/status/184…
75
127
1,449
622,712
A call 4 Voting Rights & gun reform 202-224-3121 retweeted

18 Oct 2024
Wow, this video of Kamala and Molly Shannon made for the Al Smith Dinner is gold!
2,561
1,990
12,230
928,205
A call 4 Voting Rights & gun reform 202-224-3121 retweeted

16 Oct 2024
As the election nears, political disinformation is on the rise. @brandyzadrozny takes us inside the world of a Russian disinformation generator and shows how phony propaganda ends up in your social media feeds.
19
122
195
34,940
A call 4 Voting Rights & gun reform 202-224-3121 retweeted

15 Oct 2024
Jimmy Carter Achieves His Goal, Lives Long Enough to Vote for Kamala Harris meidasnews.com/news/jimmy-ca… via @troy_in_tahoe
#DemVoice1 #ProudBlue #DemsUnited
Jimmy Carter will vote for Kamala Harris today. 100 year old Jimmy Carter wanted to live long enough to vote for Kamala Harris and he did it. Now let’s make sure he sees Kamala Harris elected on Nov 5.
Jimmy Carter holds a special place in the hearts of Southern Democrats like myself. He was the first person I ever voted for in 1976 and the first president elected from the Deep South since reconstruction. Jimmy Carter stands for all that is good in politics and life. Congratulations President Jimmy Carter.
14
109
237
3,138
A call 4 Voting Rights & gun reform 202-224-3121 retweeted

13 Oct 2024
Bryan Cranston is the fucking man! 🥰🙌🙏💪👏👊🌊🇺🇸
255
2,179
6,933
184,420
What? apple.news/AP2EqJ8JPTCiIsg_7… Never forget women supported godless: KKK daily.jstor.org/a-brief-hist… & medium.com/afrosapiophile/th… Nazism encyclopedia.ushmm.org/conte… Abuse eddmarv.medium.com/party-loy… False prophets eddmarv.medium.com/ive-got-q… @americansunited @CTmagazine @CBNOnline @BaptistPress
12