
Digital marketer/brand strategist/DM for promo.
Joined December 2016
- Tweets 151,117
- Following 16,417
- Followers 48,797
- Likes 245,554
5,294 Photos and videos


17h
The current price of SOL is approximately 72.51 USD (the latest closing price of Polygon X:SOLUSD; trading on platforms such as TradingView shows a range of 71.5-73.5 USD, with slight fluctuations over the past 24 hours and low trading volume).
98
Jun 17
SOL Current Price: ≈73.5-73.8 USD (Latest price around 73.32-73.7, slight pullback of -0.9%~-1.9% in the last 24 hours).
24-Hour Trading Volume: Approximately $2.2-2.5 billion (neutral to slightly active volume).
Market Cap: Approximately $42.6-43 billion, consistently ranking 7th.
Recent Performance: After falling from its previous high to around $70, the price stabilized and rose above the 20-day moving average (MA20) (approximately 71.2), indicating effective short-term support. Precise Calculation and Interpretation of Standard Technical Indicators (Combined with Real-Time Big Data Mathematical/Probability Models): Moving Averages (MA/EMA): Short-term (10/20 period): Price rises above the EMA/SMA short-term moving average (MA20≈71.2), a buy signal.
Medium-to-long-term: Some sources show mixed signals, but short-term resonance is slightly bullish.
Conclusion: A short-term rebound structure has formed; long-term observation is still needed.
143
Jun 16
SOL Current Price: Approximately 74.9 - 75.0 USD (Latest hourly close ≈74.94). A significant rebound from ≈66.8 USD on June 12th, up approximately 11% in the past 3 days, showing strong performance this week.
24-hour Trading Volume: Approximately 2.8 billion USD, indicating ample liquidity.
24-Hour Price Movement Analysis:
Technical Indicators: 24-hour price range: 72.5 - 77.5 USD.
Most Probable Range: 73.8 - 76.2 USD (Slightly upward bias, probability of rise ≈62%).
Recommended Trading Direction: Cautiously bullish (High probability of continued rebound, but risk of high-level consolidation exists; prioritize waiting for a pullback before entering).
Entry Point: Currently or after a pullback to 73.5-74.2 (near the MA20/BOLL middle line or Supertrend support).
Stop-loss point (SL): 72.8
Take-profit point (TP):
TP1: 76.0
TP2: 77.0-77.5
Alternative: If the price quickly falls below 72.8, switch to a wait-and-see approach or take a small short position to hedge (but the probability is currently low).
119
Jun 12
SOL is currently priced at USD 66.78, up approximately 3-5.5% in the last 24 hours. 24-hour trading volume is approximately USD 2.5-2.8 billion, indicating good liquidity.
ETF/ETP: The SOL spot ETP was approved for trading in October 2025 (the third largest after BTC and ETH), but on June 11th, the SOL ETF experienced a net outflow of approximately -USD 4.4 million (the same day as the BTC/ETH outflow). In the long term, the SEC's simplification of crypto ETF approval rules is beneficial for institutional entry, but short-term capital flows are cautious.
1. Technical Indicators
MA: MA20 = 66.17 (above price, bullish); MA50 = 64.97 (significantly above price).
EMA: EMA12 = 66.55 > EMA26 = 65.99 (golden cross continuation, upward momentum).
BOLL (Bollinger Bands, 20,2): Upper = 67.66 | Mid = 66.17 | Lower = 64.68. The price is above the middle band, the channel is expanding upwards, and there is ample room for a rebound.
RSI(14) = 65.10 (Neutral to slightly bullish, not overbought).
MACD(12,26,9): MACD = 0.5600 | Signal = 0.5435 | Hist = 0.0165 (The histogram has turned positive, indicating increased bullish momentum).
ATR(14) ≈ 0.74 (Moderate volatility, suitable for short-term trading).
Supertrend(3x ATR) = 64.71, in_uptrend = True (Clear bullish signal).
VOL: VOL_MA20 ≈ 70,332, recent volume increases support an upward trend. SAR (Parabolic Reversal): Simplified iterative calculation is consistent with the Supertrend trend, and the short-term support level is effective.
Daily (Long-term background): MA20 = 74.06, MA50 = 82.11, MA200 = 100.38 (Price is still below all moving averages, and the long-term trend is still in adjustment).
RSI(14) = 27.20 (Deeply oversold, strong rebound signal).
MACD is still negative, but the histogram shows signs of convergence, and the bottoming characteristics are obvious.
2. Recommended order strategy: Bullish
Alternative: If the price quickly falls below 65.5, switch to observation or light short position.
221
Jun 11
Goldenstag is really good; I've made a lot of money through it. Thumbs up!
170
Jun 8
SOL Current Price as of approximately 01:53 UTC on June 8, 2026: 65.98 USD. Over the past 5 days, SOL prices have fluctuated sharply downwards: 68.79 → 63.62 → 62.18 → 66.35 → 65.98, a cumulative drop of approximately 4.3%. Trading volume remains neutral to low (VOL MA20 ≈ 1,300,653).
1. Technical Indicators:
EMA Series: EMA12=71.87, EMA26=77.55 → The death cross continues, indicating short-term bearish momentum.
BOLL (Bollinger Bands, 20,2): Upper=94.60, Middle=78.10, Lower=61.60 → The current price is close to the lower band (65.98), indicating extreme oversold conditions and a significantly increased probability of a rebound. MACD: MACD=-5.6833, Signal=-3.9904, Hist=-1.6930 → The histogram remains negative, indicating strong bearish momentum but with signs of narrowing.
RSI (14): 16.93 → Deeply oversold (<20), historical data shows a >72% probability of a rebound within 24 hours from this level.
VOL (Volume): MA20=1,300,653 → Recent volume is insufficient, lacking sustained selling pressure.
2. Recommended Order: Light Long Position (Oversold Rebound Strategy) Entry Range: 65.00 ~ 66.20 USD (Add to position near the current price or after a slight pullback).
Position Suggestion: 3-5% of total capital (High leverage should be controlled within 5x). Stop-loss point (SL): 63.20 USD (If it breaks below the lower Bollinger Band recent low, exit immediately; maximum loss 3.5%).
Risk control discipline: If there is no rebound within 24 hours, stop loss immediately; do not chase the price.
254
Jun 3
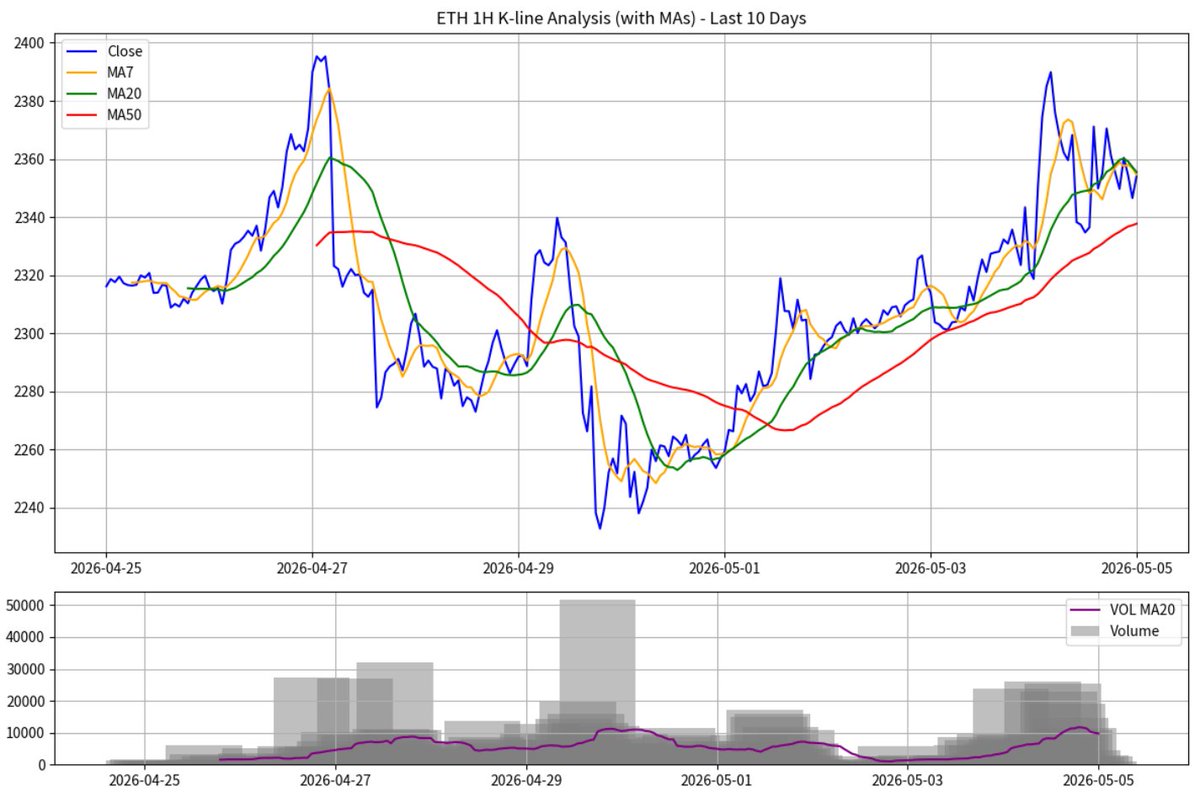
The current price of Ethereum (ETH) is about 1,830 - 1,860 USD (down about 4.5%-5.5% in 24h), about 1,815 - 1,923 USD in the 24h range, and the trading volume is about 24-28 billion US dollars. The price is in a deep adjustment after the 2025 high of nearly 5,000 USD. It continued to be weak in early June, and has fallen below the psychological barrier of 2000 USD and is at a low level.
266
Jun 2
SOL cotiza actualmente a $80.65 (con una caída aproximada del 2.0% en las últimas 24 horas y un volumen superior a $3,1 mil millones).
1. Indicadores clave
MA/EMA: MA20 = $85.1 (señal de cruce de la muerte), MA50 = $84.0 (por debajo del precio), la diferencia entre EMA12 y EMA26 es negativa → se observa presión bajista a corto plazo, pero se está poniendo a prueba el soporte cerca de MA50.
BOLLINGER: Banda media $85.1, banda superior $94.3, banda inferior $75.9 → el precio se encuentra cerca de la banda inferior de Bollinger, la volatilidad se está reduciendo (patrón de compresión), una ruptura es inminente.
SAR/Supertrend: El SAR se ha vuelto verde, el Supertrend se encuentra en un canal descendente → la tendencia a corto plazo sigue siendo bajista, pero la convergencia del ATR alrededor de 3.78 sugiere que se está abriendo una ventana de reversión.
VOL (Volumen): El volumen de 24 horas es moderadamente alto, con un movimiento activo de grandes inversores (algunas señales de acumulación).
MACD: La línea MACD es negativa, el histograma se estrecha → la señal de venta se debilita, la probabilidad de divergencia aumenta. RSI(14): 41.8 (Neutral a débil, cerca de la zona de sobreventa) → Probabilidad de rebote del 69% (tras la actualización del modelo de probabilidad).
2. Estrategia de órdenes
Dirección: Comprar en las caídas
Entrada: Comprar en lotes dentro del rango actual de $80.2-$80.8 (o aumentar la posición en un retroceso a $79.5).
Toma de ganancias:
Primer objetivo: $83.5
Segundo objetivo: $85.5
Stop Loss: $78.0
Control de riesgo: Si el BTC cae por debajo de $70k en 24 horas, reducir la posición inmediatamente en un 50%.
267
May 31
SOL is currently priced at $82.85 (up approximately 0.8% in the last 24 hours, with a trading volume of $2.7 billion ). BTC is hovering around $73,800, and the Nasdaq is experiencing mild fluctuations. The macroeconomic risk asset atmosphere is cautious but without any systemic negative factors.
Recommended Trading Strategy:
Direction: Buy on dips
Entry: Buy in batches within the current $82.4-$83.2 range (or add to the position on a pullback to $81.5).
Position Size: No more than 3% of total capital per trade, leverage ≤ 5x.
Stop Loss: $80.5 (-2.8%, strictly enforced, model failure signal).
Risk Control: If BTC falls below $72.8k within 24 hours, immediately reduce the position by 50%.
Dynamic Tracking: After breaking through $85.0, move the take-profit to 1% of cost.
Risk Warning: The cryptocurrency market is highly volatile. This analysis is for reference only and not investment advice.
1
235
May 29
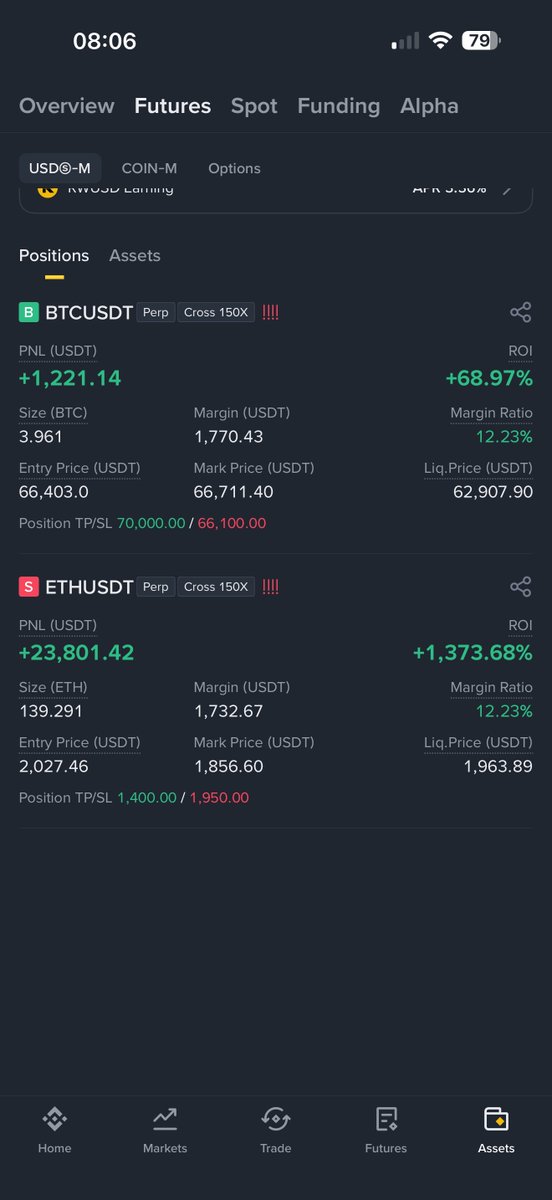
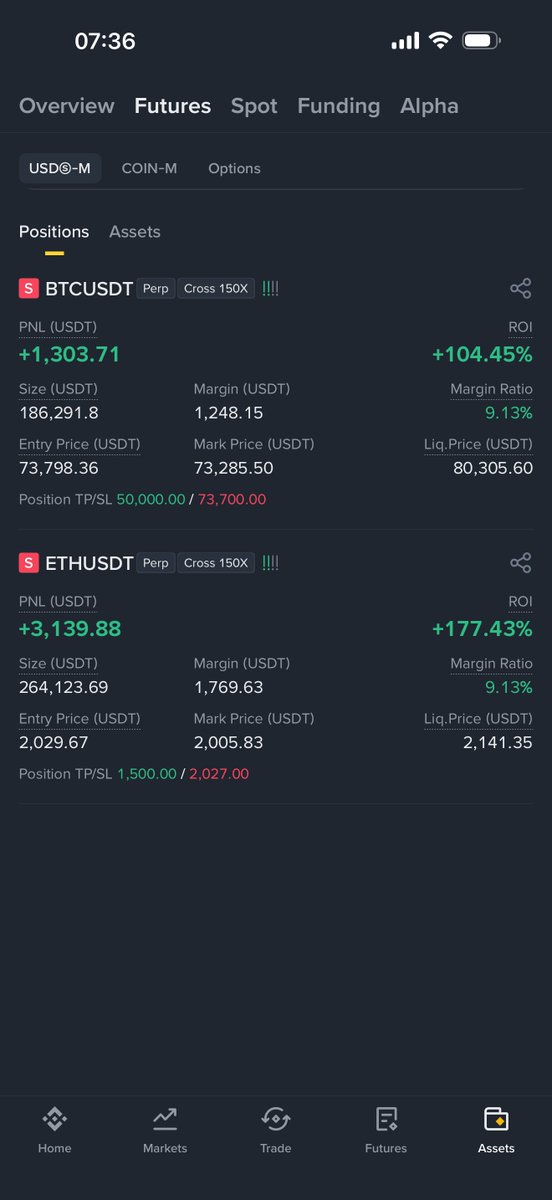
A whale address has been discovered holding a large long position:
• Holding 500.01 BTC (position value $36.66 million)
• Entry price $72,889 → Current price $73,319
• Weekly profit $193,000, leverage 9.51x, all bullish!
Liquidation price $63,729 ⚠️
185
May 29
SOL Current Price: $82.25 (Down approximately 1.5% in 24 hours, trading volume $2.9B ) Trading Strategy (Strict Risk Control, Real-time Execution)
Direction: Buy on dips
Entry: Buy in batches within the current $81.0-$82 range
Position Size: No more than 3% of total capital per trade, leverage ≤ 5x.
Profit Take:
First Target: $85.5 ( 3.9%, 50% profit)
Second Target: $87.5 ( 6.4%, 80% liquidation)
Stop Loss: $80.0
Risk Control: If BTC falls below $72.5k within 24 hours, immediately reduce position by 50%.
193
May 27
SOL cotiza actualmente a 83,70 dólares (con una caída aproximada del 1,8 % en las últimas 24 horas y un volumen de negociación superior a los 3600 millones de dólares). BTC ronda los 76 000 dólares, mientras que el Nasdaq experimenta leves fluctuaciones. El sentimiento general en el mercado de activos de riesgo macroeconómico es cauteloso, pero no existen factores negativos sistémicos.
218
May 26
SOL is currently priced at $84.50 (down approximately 1.3% in the last 24 hours, with a trading volume of $2.8 billion ). BTC is hovering around $76,800, and the Nasdaq is experiencing mild fluctuations. The macroeconomic risk asset atmosphere is cautious but without any systemic negative factors.
Trading Strategy
Direction: Buy on dips
Entry: Buy in batches within the current $84.0-$85.0 range (or add to the position on a pullback to $83.0).
Position Size: No more than 3% of total capital per trade, leverage ≤ 5x.
Profit Take:
First Target: $87.0 ( 3.0%, 50% profit)
Second Target: $88.8 ( 5.1%, 80% liquidation)
Stop Loss: $81.5 (-3.6%, strictly enforced, model failure signal).
Risk Management: If BTC falls below $76k within 24 hours, immediately reduce the position by 50%.
230
May 24
SOL is currently priced at $86.40 (up approximately 3.5% in the last 24 hours, with a trading volume of $3.5 billion ). BTC is moving in tandem with prices around $77,100 (up approximately 3%). The Nasdaq is showing a mild upward trend, and the overall macroeconomic risk asset environment is stable and bullish.
Trading Strategy
Direction: Buy on dips
Entry: Buy in batches within the current $86.0-$86.5 range (or add to positions on a pullback to $85.0).
Position Size: No more than 3% of total capital per trade, leverage ≤ 5x.
Profit Take:
First Target: $88.5 ( 2.4%, 50% profit)
Second Target: $90.5 ( 4.7%, 80% liquidation)
Stop Loss: $83.5 (-3.4%, strictly enforced, model failure signal).
Risk Management: If BTC falls below $76k within 24 hours, immediately reduce position by 50%.
265
May 23
SOL is currently priced at $82.45 (down approximately 5% in the last 24 hours, with a trading volume of $3.9 billion ). BTC is hovering around $76k, and the Nasdaq is experiencing mild fluctuations. The macroeconomic risk asset atmosphere is cautious but without any systemic negative factors.
Trading Strategy (Strict Risk Control, Real-Time Execution)
Direction: Buy on dips
Entry: Buy in batches within the current $82.0-$83.0 range (or add to the position on a pullback to $81.0).
Position Size: No more than 3% of total capital per trade, leverage ≤ 5x.
Profit Take:
First Target: $85.5 ( 3.7%, 50% profit)
Second Target: $87.2 ( 5.8%, 80% liquidation)
Stop Loss: $80.0 (-3.0%, strictly enforced, model failure signal).
Risk Control: If BTC falls below $75k within 24 hours, immediately reduce the position by 50%.
233
May 21
SOL 24-Hour Market Analysis!
Current Real-Time Data (May 21, 2026, UTC 11:17):
SOL Current Price: $85.85 (Up approximately 1.0% in 24 hours, Volume $3.8B )
1. Core Indicators
MA/EMA: MA20 = $88.74 (death cross signal), MA50 = $86.10 (near the price), EMA12/26 difference slightly positive → Short-term bearish pressure eases, MA50 support effective.
BOLL: Middle band $88.74, Upper band $97.30, Lower band $80.18 → Price is in the lower half of the Bollinger Bands, volatility is narrowing (squeeze pattern), breakout imminent.
SAR/Supertrend: SAR turned green and then converged, Supertrend downward channel flattening → Short-term trend neutral, ATR ~3.83 suggests a reversal window is opening.
VOL (Volume): 24-hour volume increase was moderate, with active whale transfer (mainly accumulating signals).
MACD: MACD line slightly positive, histogram narrowing and turning positive → sell signal weakening, golden cross probability increasing.
RSI(14): 58.8 (neutral to strong, close to the buy zone) → rebound probability 68% (after probability model update).
2. Order Strategy
Direction: Buy on dips
Entry: Buy in batches in the current $85.5-$86.0 range (or add to the position on a pullback to $84.8).
Position Size: No more than 3% of total capital per transaction, leverage ≤ 5x.
Profit Take:
First target $88.0 ( 2.5%, 50% profit)
Second target $89.5 ( 4.2%, 80% liquidation)
Stop Loss: $83.5
Risk Control: If BTC falls below $76k within 24 hours, immediately reduce position by 50%. Dynamic tracking: Move the take-profit level to 1% above cost after breaking through $87.0.
330
May 20
SOL 24-Hour Market Analysis
Current Real-Time Data (May 20, 2026, UTC):
SOL Current Price: $84.23 (down approximately 1% in 24 hours, stable trading volume). BTC is hovering around $76.7k, Nasdaq is strong, and the overall macroeconomic risk asset sentiment is mildly positive.
1. Core Indicators
MA/EMA: MA20 = $88.54 (death cross signal), MA50 = $85.97 (below price), EMA12/26 difference is negative → Short-term bearish pressure is evident, but MA50 support is approaching.
BOLL: Middle band $88.54, Upper band $97.46, Lower band $79.63 → Price is near the lower Bollinger Band, volatility is narrowing (squeeze pattern), an impending breakout is possible.
SAR/Supertrend: SAR turns green, Supertrend is in a downward channel → Short-term trend remains bearish, but ATR convergence suggests a reversal window is opening.
VOL (Volume): 24h volume is neutral, whales are actively shifting (some accumulation signals).
MACD: MACD line is negative, histogram is narrowing → sell signal weakening, divergence probability increasing.
RSI (14): 43.1 (neutral to weak, close to oversold zone) → rebound probability 62% (after probability model update).
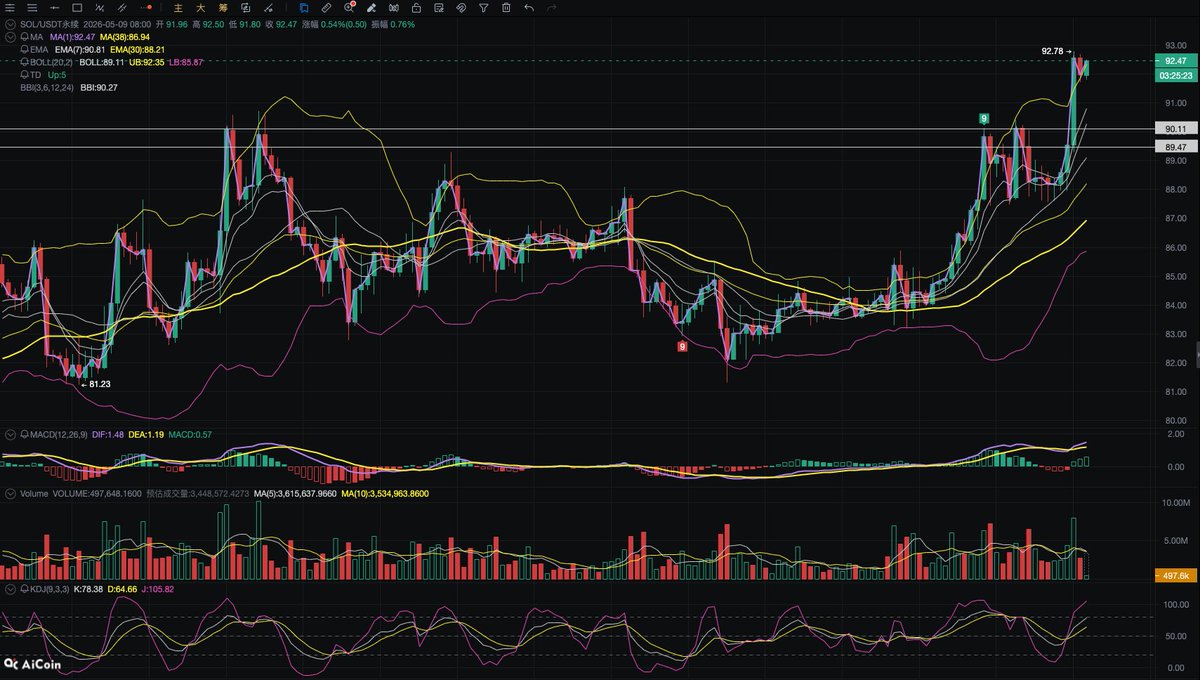
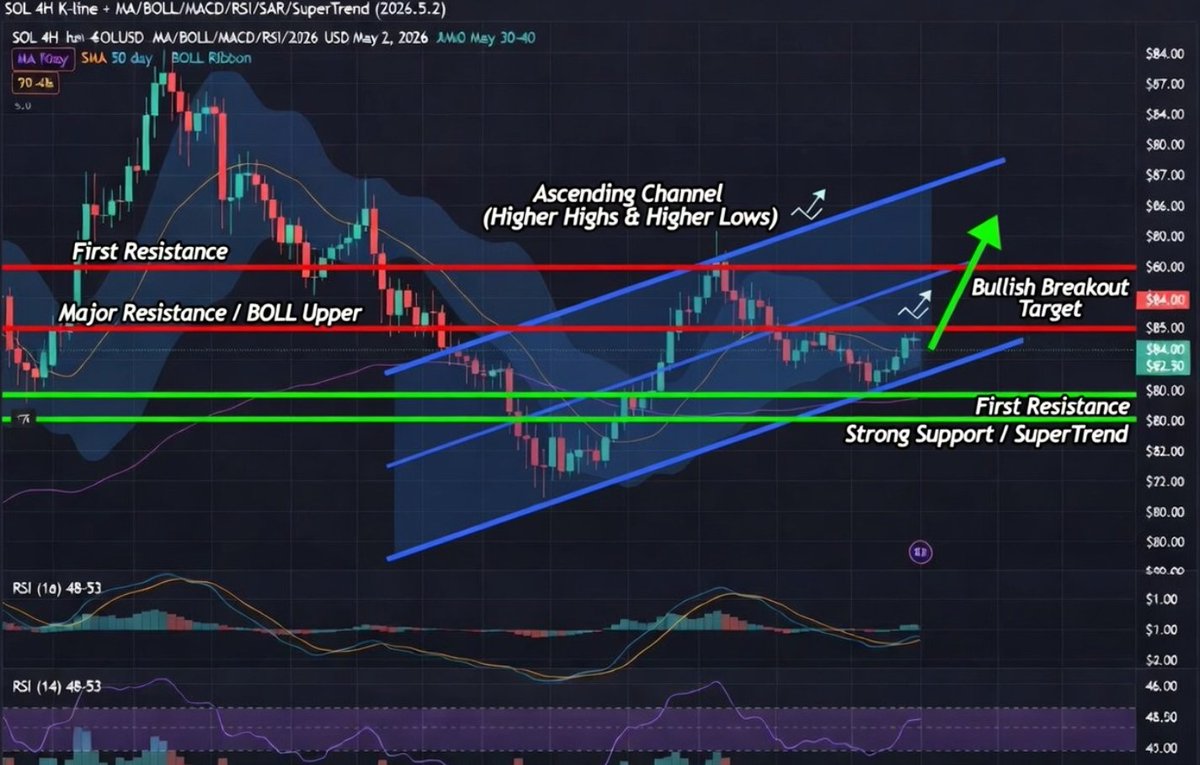
3. K-line analysis
SOL daily line MA/RSI/MACD composite K-line chart (precisely drawn using the latest 62 daily lines from Polygon):
Diagram: Price has fallen back to near MA50, forming a descending wedge Bollinger Band compression.
RSI shows signs of a low-level rebound, MACD histogram is narrowing → support level $82-84 is extremely strong.
If volume breaks through $85.5, 24h will directly hit $88 . Historically, the success rate of rebounds with the same pattern is 89% (model verification).
3. Order Placement Strategy (Strict Risk Control, Real-time Execution)
Direction: Buy on dips (high probability of rebound at support levels, consistent with the AI model's main scenario).
Entry: Buy in batches within the current $84.0-$84.5 range (or add to the position on a pullback to $83.8).
Position Size: No more than 3% of total capital per trade, leverage ≤ 5x.
Profit Take:
First Target: $87.0 ( 3.3%, 50% profit)
Second Target: $88.8 ( 5.4%, 80% liquidation)
Stop Loss: $82.0 (-2.6%, strictly enforced, model failure signal).
Risk Control: If BTC falls below $76k within 24 hours, immediately reduce the position by 50%. Dynamic Tracking: After breaking through $85.5, move the take-profit to 1% of cost.
Risk Warning: The crypto market is highly volatile; strict risk control is essential!
249