
Crypto Content Creator on Bitget Insights, Binance Square , CmC & Gate Moments .
Joined October 2023
- Tweets 8,875
- Following 119
- Followers 5,279
- Likes 4,263
6,569 Photos and videos


Pinned Tweet

11 Feb 2025
Our Telegram channel delivers daily crypto signals, market trends, and insider tips to keep you ahead of the curve.
👉 Join Now: t.me/ 59eDt3_3b5E1MzU1

9 Jul 2024

Join our community to get #BTC updates, swing trades, scalping trades, and #crypto info.
#Growth
x.com/i/communities/18105463…
19
48
115
89,248
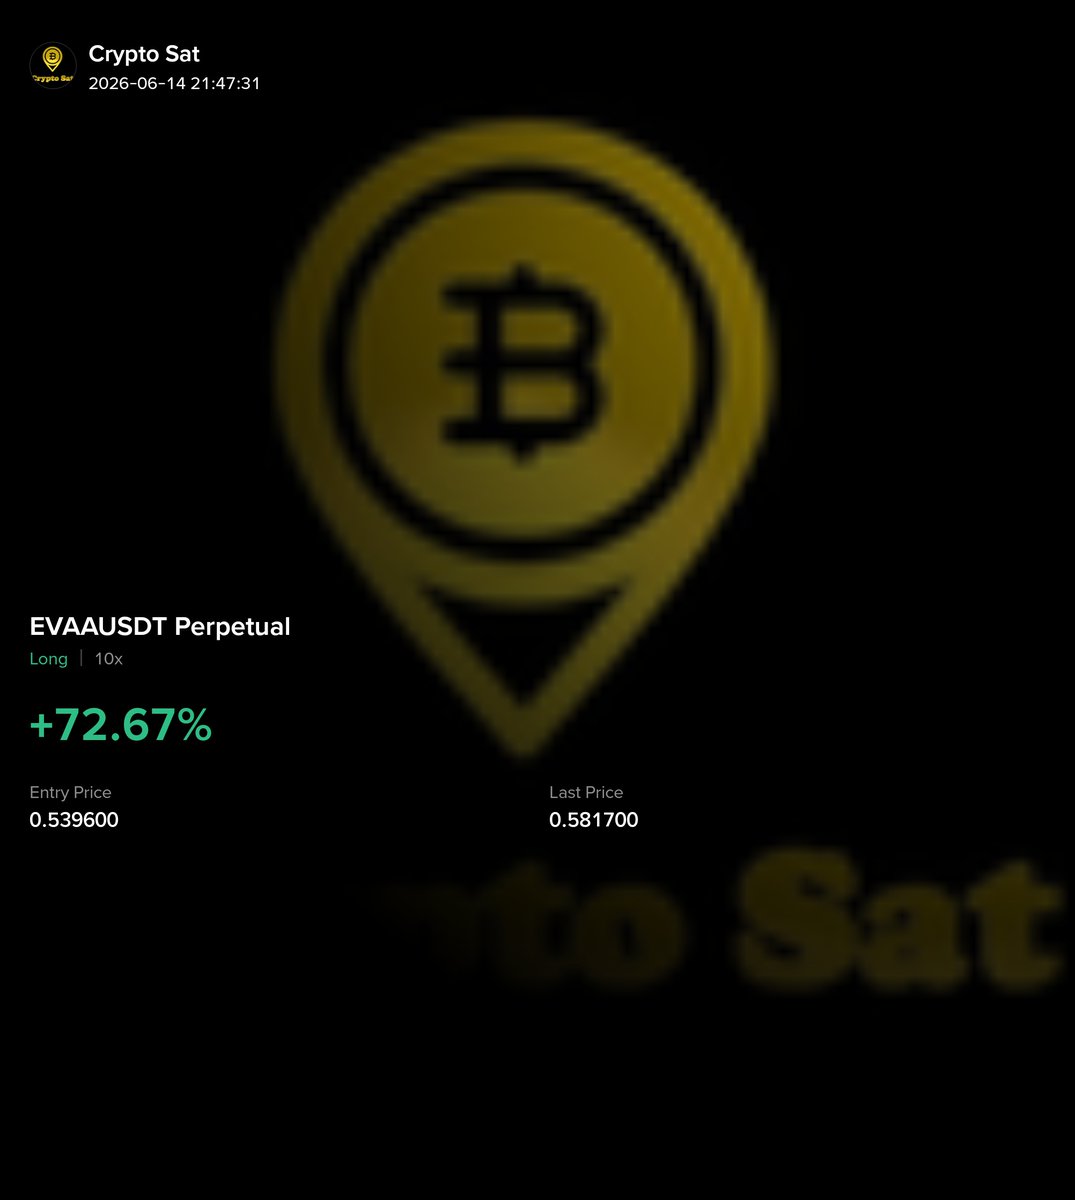
72% profit cooked in $EVAA 🚀
Close 30-40% position atleast
It's time to set Stoploss at entry price and wait for 0.6-0.64 👍🏻
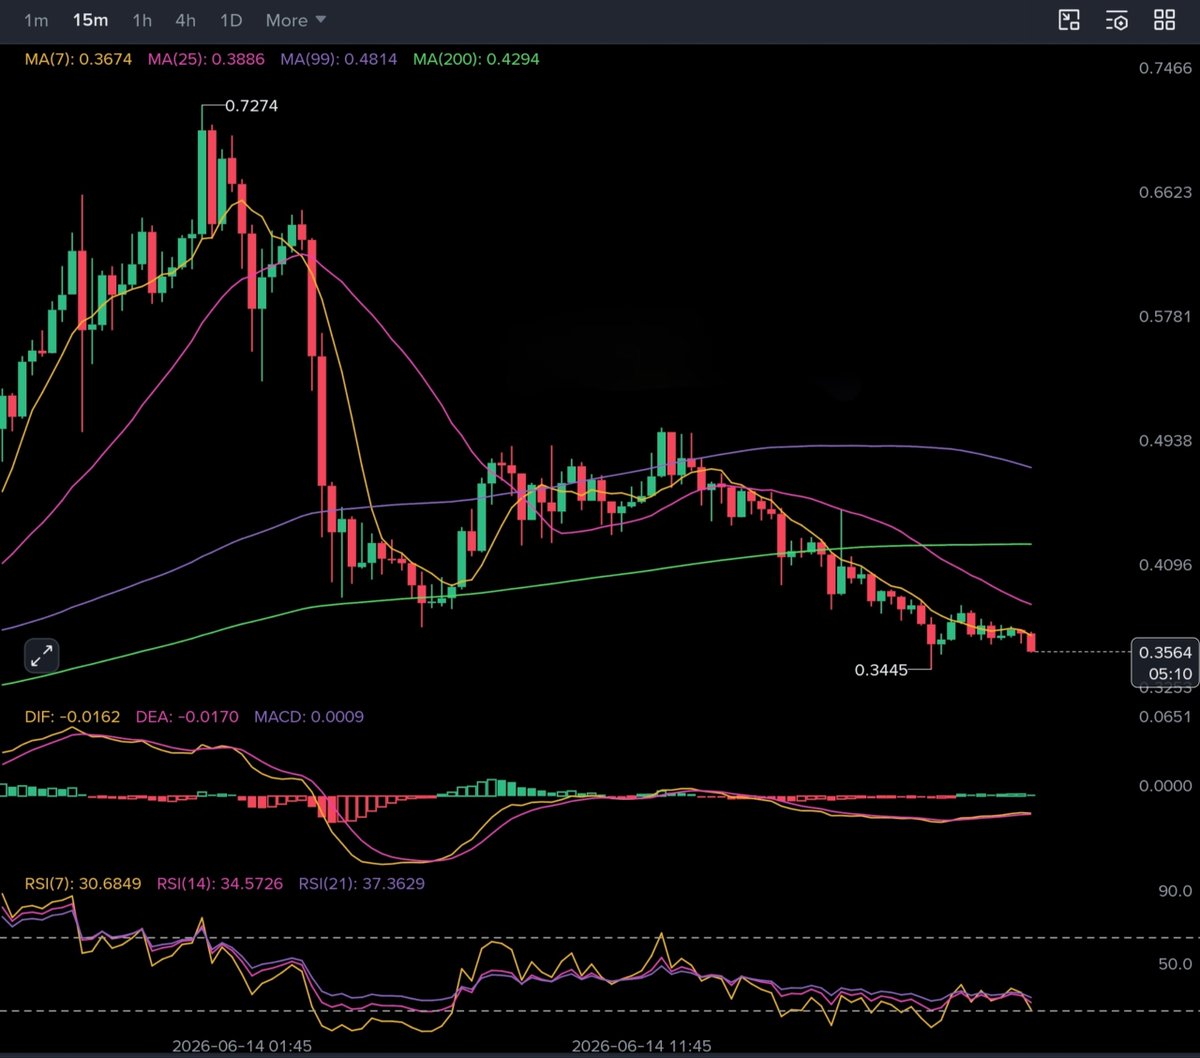
$EVAA Looking Strong After Major Breakout
Price has successfully reclaimed the Daily MA99 (0.52), which acted as a key resistance for weeks. This breakout is supported by a strong bullish candle, rising MACD histogram, and RSI pushing higher, showing momentum is accelerating.
On the 1H chart, price is trading well above MA7, MA25, MA99, and MA200, confirming a strong bullish structure. The MA99 and MA200 around 0.42-0.40 are now acting as dynamic support zones.
As long as price holds above 0.52, bulls remain in control.
🎯 Next Targets: 0.60 → 0.64
📍 Support: 0.52 → 0.47 → 0.42
A successful hold above the Daily MA99 could open the door for another strong leg higher.
5
💰 $COAI
🔻 SHORT
✳️ ENTRY: 0.3700 - 0.3785 - 0.3863
🎯 TARGETS: 0.3640, 0.3570, 0.3490, 0.33650, 0.300, 0.2750, 0.2000
🀄️ LEVERAGE: 10x
🔴 STOPLOSS: 0.3930
1
20
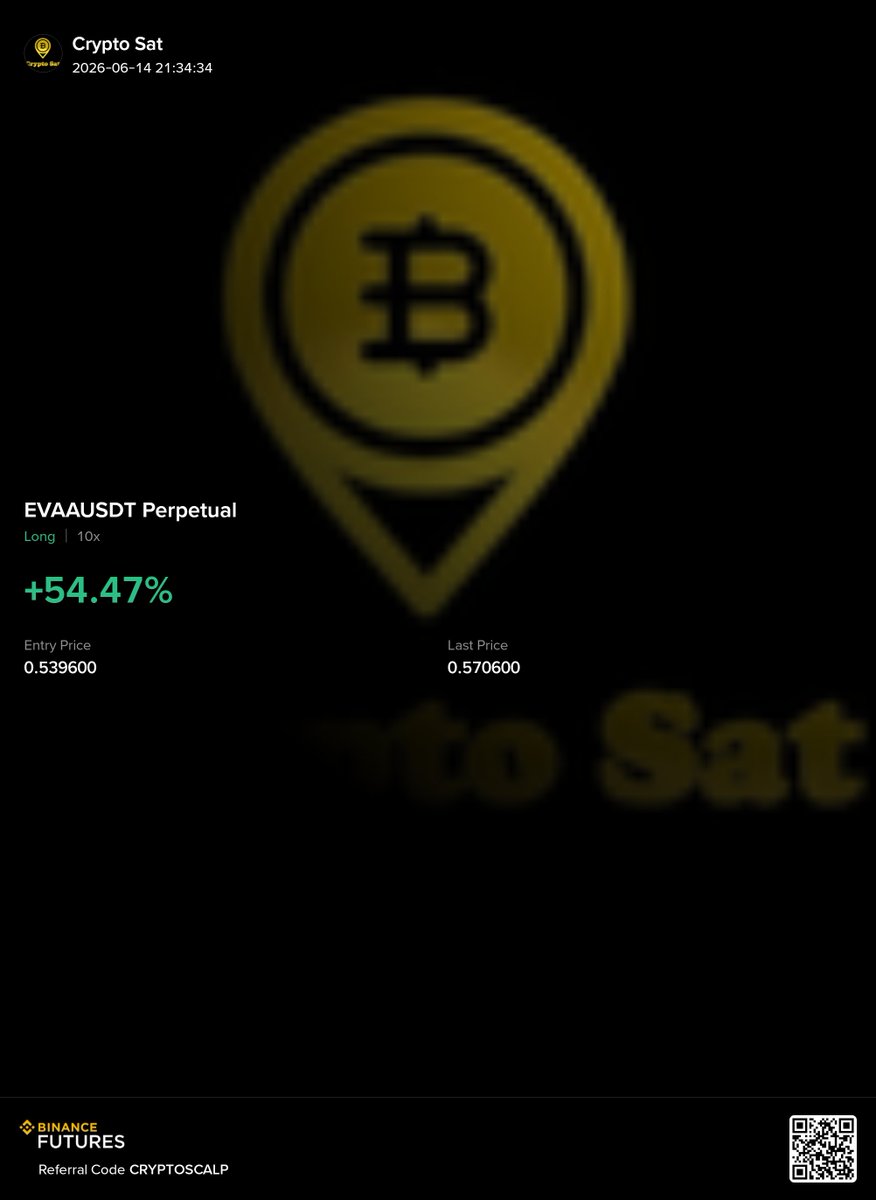
$EVAA coming into Target range 😍
$EVAA Looking Strong After Major Breakout
Price has successfully reclaimed the Daily MA99 (0.52), which acted as a key resistance for weeks. This breakout is supported by a strong bullish candle, rising MACD histogram, and RSI pushing higher, showing momentum is accelerating.
On the 1H chart, price is trading well above MA7, MA25, MA99, and MA200, confirming a strong bullish structure. The MA99 and MA200 around 0.42-0.40 are now acting as dynamic support zones.
As long as price holds above 0.52, bulls remain in control.
🎯 Next Targets: 0.60 → 0.64
📍 Support: 0.52 → 0.47 → 0.42
A successful hold above the Daily MA99 could open the door for another strong leg higher.
66
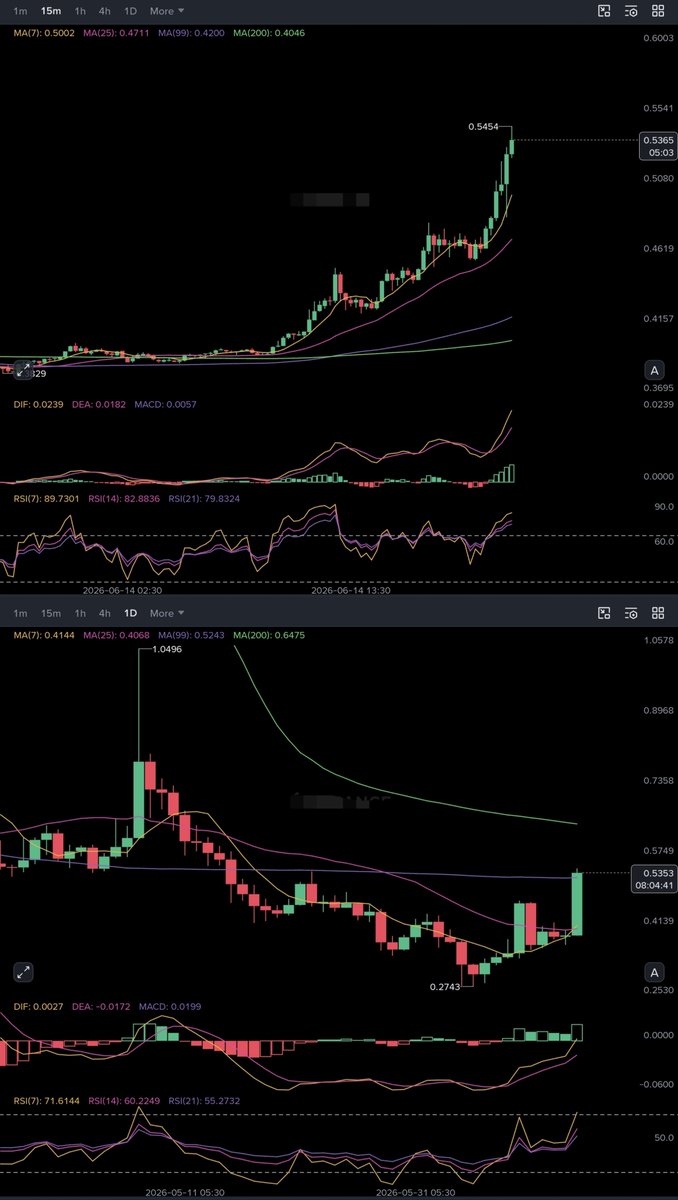
$EVAA Looking Strong After Major Breakout
Price has successfully reclaimed the Daily MA99 (0.52), which acted as a key resistance for weeks. This breakout is supported by a strong bullish candle, rising MACD histogram, and RSI pushing higher, showing momentum is accelerating.
On the 1H chart, price is trading well above MA7, MA25, MA99, and MA200, confirming a strong bullish structure. The MA99 and MA200 around 0.42-0.40 are now acting as dynamic support zones.
As long as price holds above 0.52, bulls remain in control.
🎯 Next Targets: 0.60 → 0.64
📍 Support: 0.52 → 0.47 → 0.42
A successful hold above the Daily MA99 could open the door for another strong leg higher.
140
$BTC TRADE back to profits 😉
I strongly recommend you cut atleast 30-40% at TP1/ tp2.
Jun 12
💰 $BTC Breakdown Trading Strategy
🔽 SHORT
✳️ ENTRY: 64300, 64800, 65200
🎯 TARGETS: 63,800, 63,000, 62,000, 61,000, 60,000, 59,000, 58,000
🀄️ LEVERAGE: 50x
🔴 STOPLOSS: 65500
#Bitcoin is approaching a major resistance zone near the upper Bollinger Band, where previous rallies have struggled to sustain momentum. Price has recovered strongly from the 59K region, but the current move is beginning to look stretched after several consecutive bullish candles.
The MACD remains bullish, with the signal line above zero and positive histogram bars still present. However, momentum expansion is slowing compared to earlier in the rally, suggesting buyers may be losing some strength as price approaches resistance.
RSI(7) is already near the overbought region while RSI(14) and RSI(21) continue trending higher. This confirms bullish momentum but also increases the probability of a short-term correction or consolidation before another major move.
The key level to watch is the 64.3K–64.5K resistance area, which aligns closely with the upper Bollinger Band. Failure to break and hold above this zone could trigger profit-taking and a move back toward the middle Bollinger Band around the 62.5K region.
This setup is a counter-trend short, so patience is important. Ideally, wait for rejection confirmation before entering aggressively. A clean break above resistance would invalidate the bearish idea and favor continuation toward higher levels.
As long as sellers defend the current resistance zone, a retracement toward the lower targets remains possible. 🐻

1
92
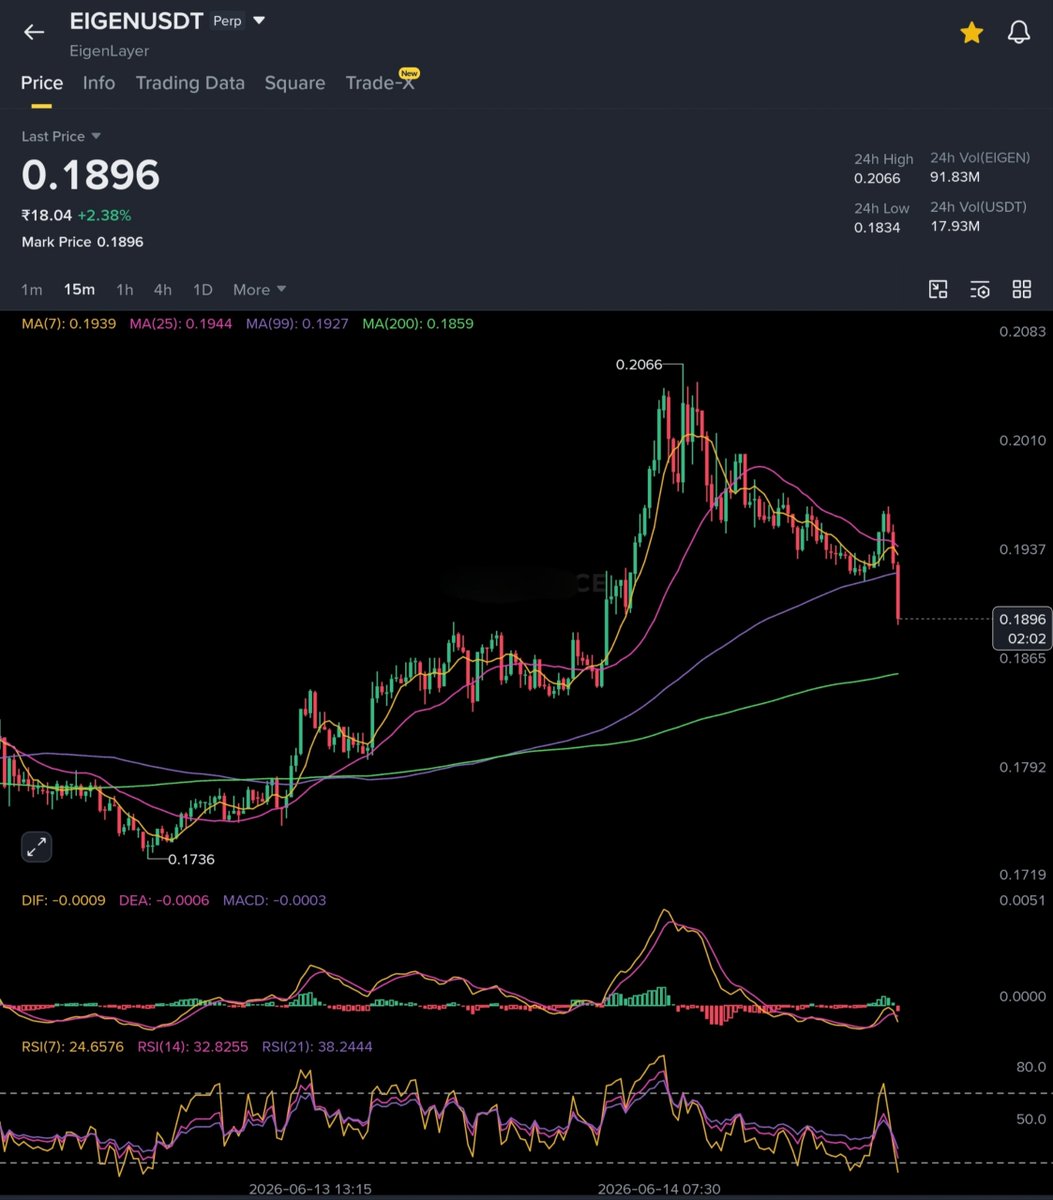
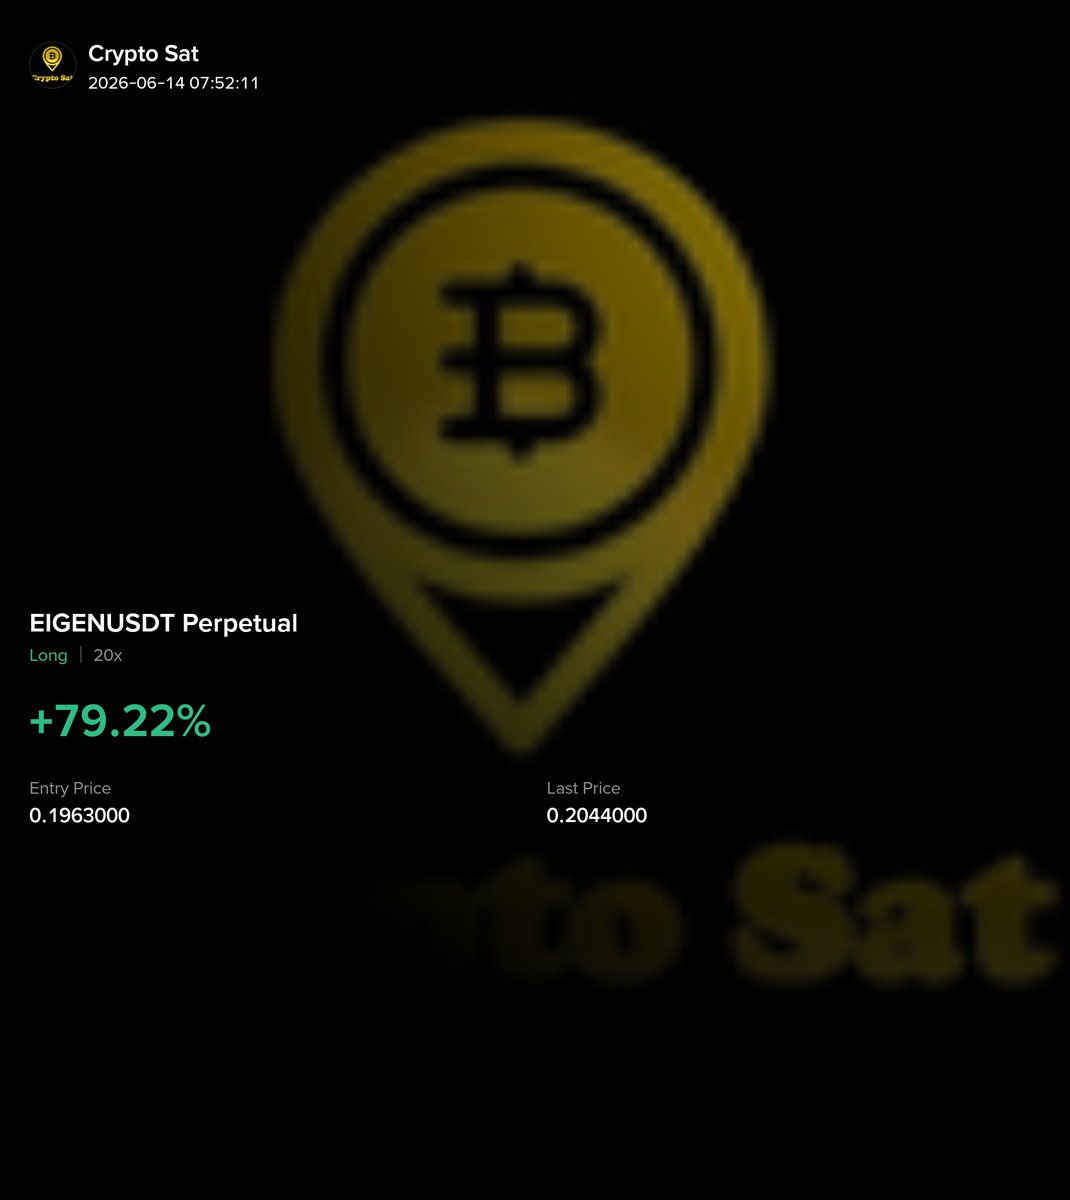
Close $EIGEN long trade, if you're still holding it
💰 $EIGEN /USDT
🔼 LONG
✳️ ENTRY - 1956, 1919, 1870
🎯 TARGETS - 1977, 1994, 2014, 2050, 2120, 2300, 2600, 3000
🀄️ LEVERAGE - cross 20x
🔴 STOPLOSS - 1810

1
112
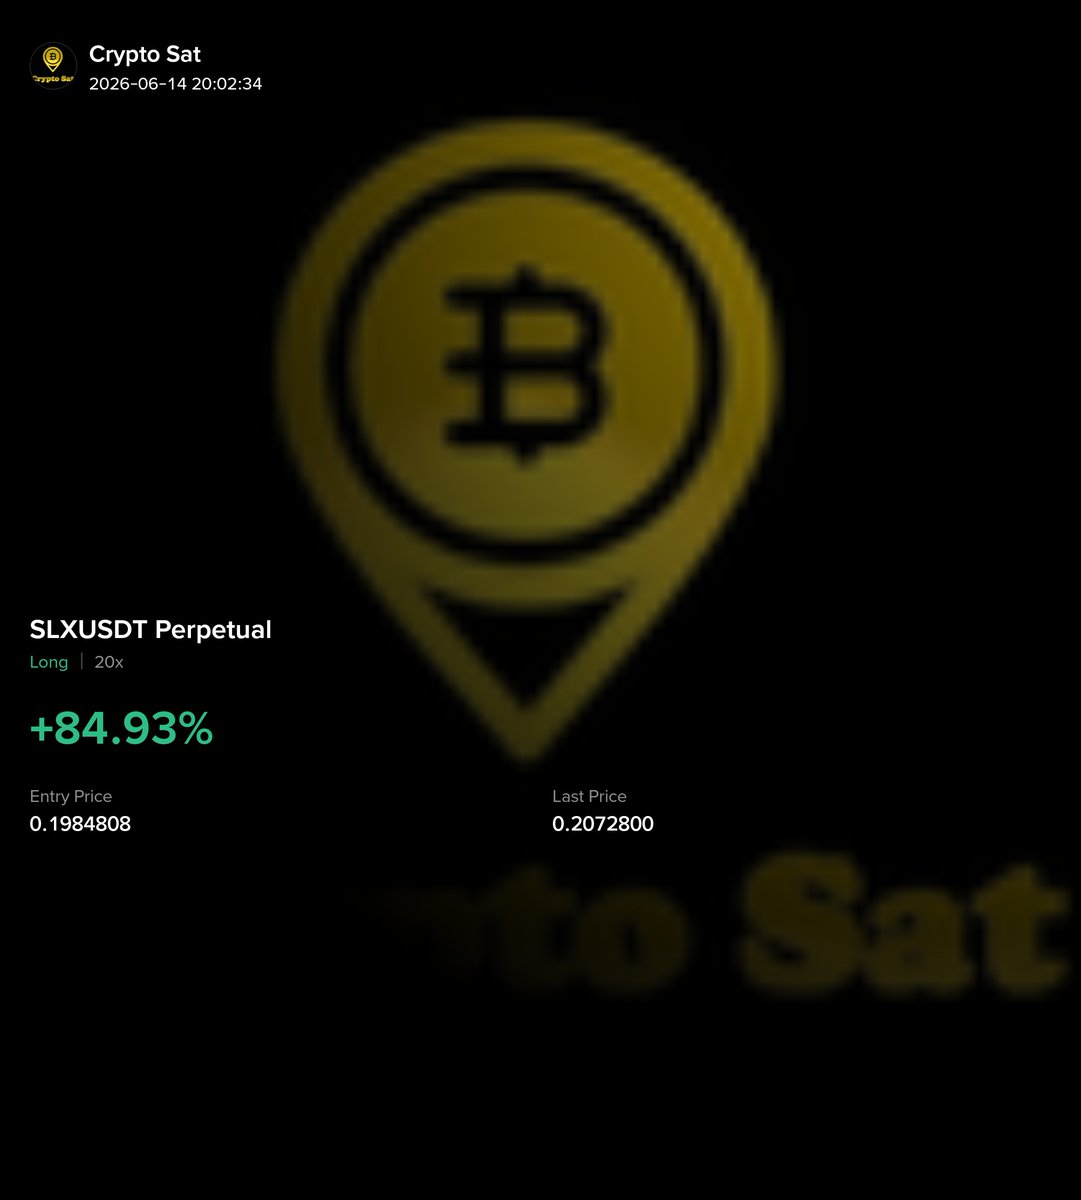
$SLX 1st Target completed✊
💰 $SLX Trading Strategy
🔼 LONG
✳️ ENTRY: 0.195 - 0.1850 - 0.1750
🎯 TARGETS: 0.2030, 0.2150, 0.22750, 0.250, 0.2850, 0.350, 0.5000
🀄️ LEVERAGE: 10x
🔴 STOPLOSS: 0.1680
#SLX is showing a constructive recovery structure across the lower and mid timeframes. Price has reclaimed MA7, MA25, MA99, and MA200 on the 15M chart, while the 1H and 4H timeframes continue printing higher highs and higher lows. MACD remains in bullish territory with positive histogram expansion, indicating momentum is still favoring buyers. RSI is elevated but not yet at extreme levels, suggesting room for continuation if volume remains strong.
The key zone to monitor is the 0.193 support area, where a healthy retest remains possible before the next expansion move. Holding this level would keep the bullish structure intact. Immediate resistance sits around 0.206, while the major breakout level is near 0.220. A decisive close above that region could trigger a stronger momentum phase toward higher targets.
As long as price remains above 0.170, the probability of a larger trend reversal remains valid. The moving averages are beginning to align bullishly, and continued acceptance above MA200 on higher timeframes would further strengthen the setup.
⚠️ Execution Plan: A retest toward 0.193–0.183 should not be viewed as weakness but rather as a potential accumulation opportunity. Avoid chasing green candles aggressively. Scale in gradually using the DCA entries provided and manage risk carefully. If momentum accelerates above 0.220, #SLX could transition from recovery mode into a full trend reversal phase with significantly higher upside potential. 🚀
1
92
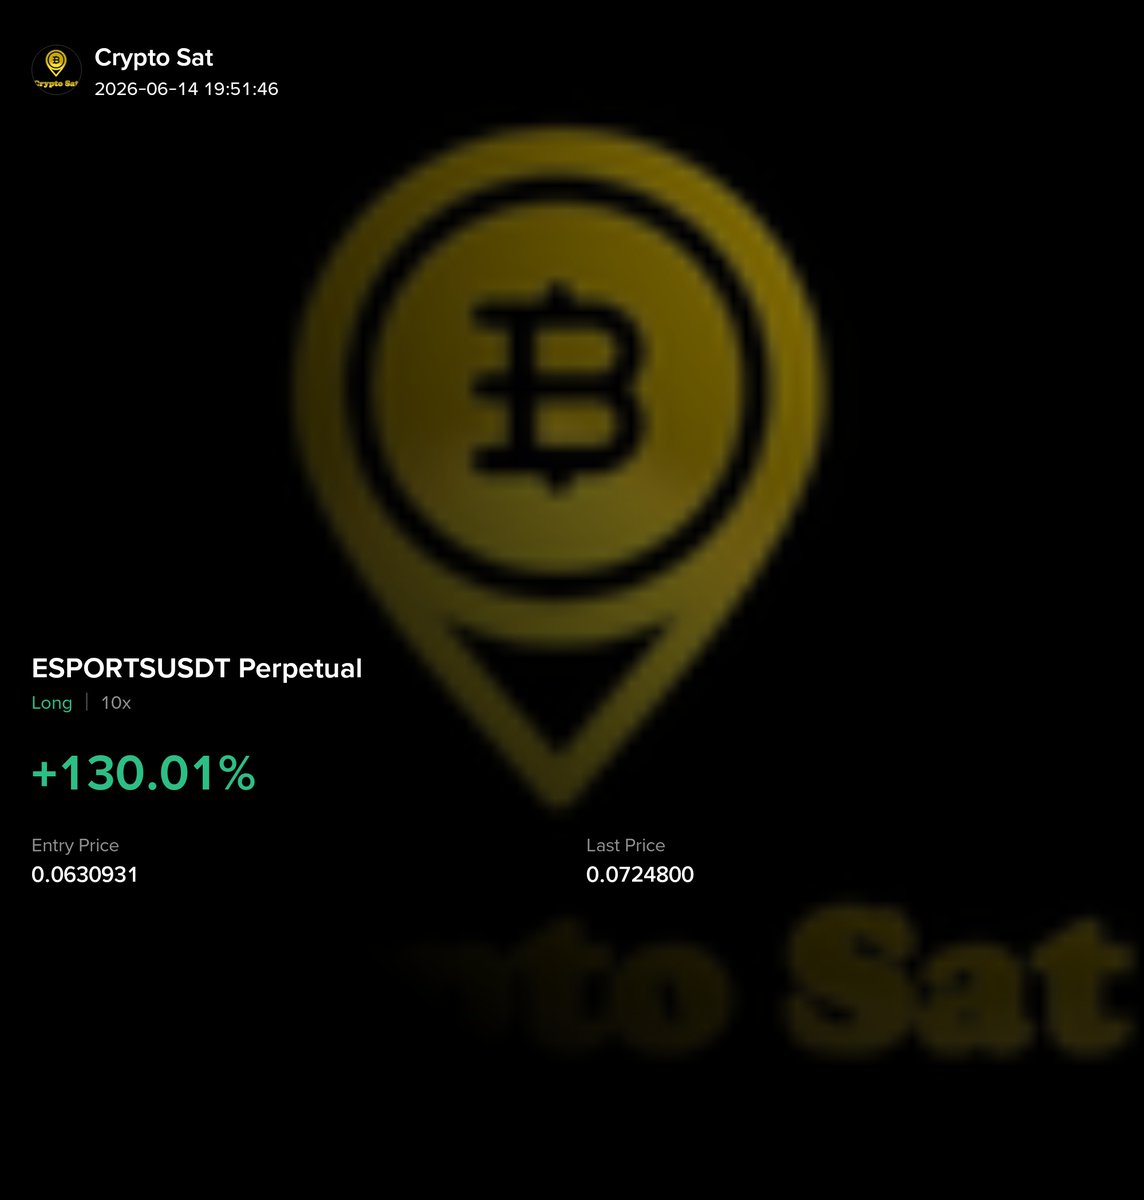
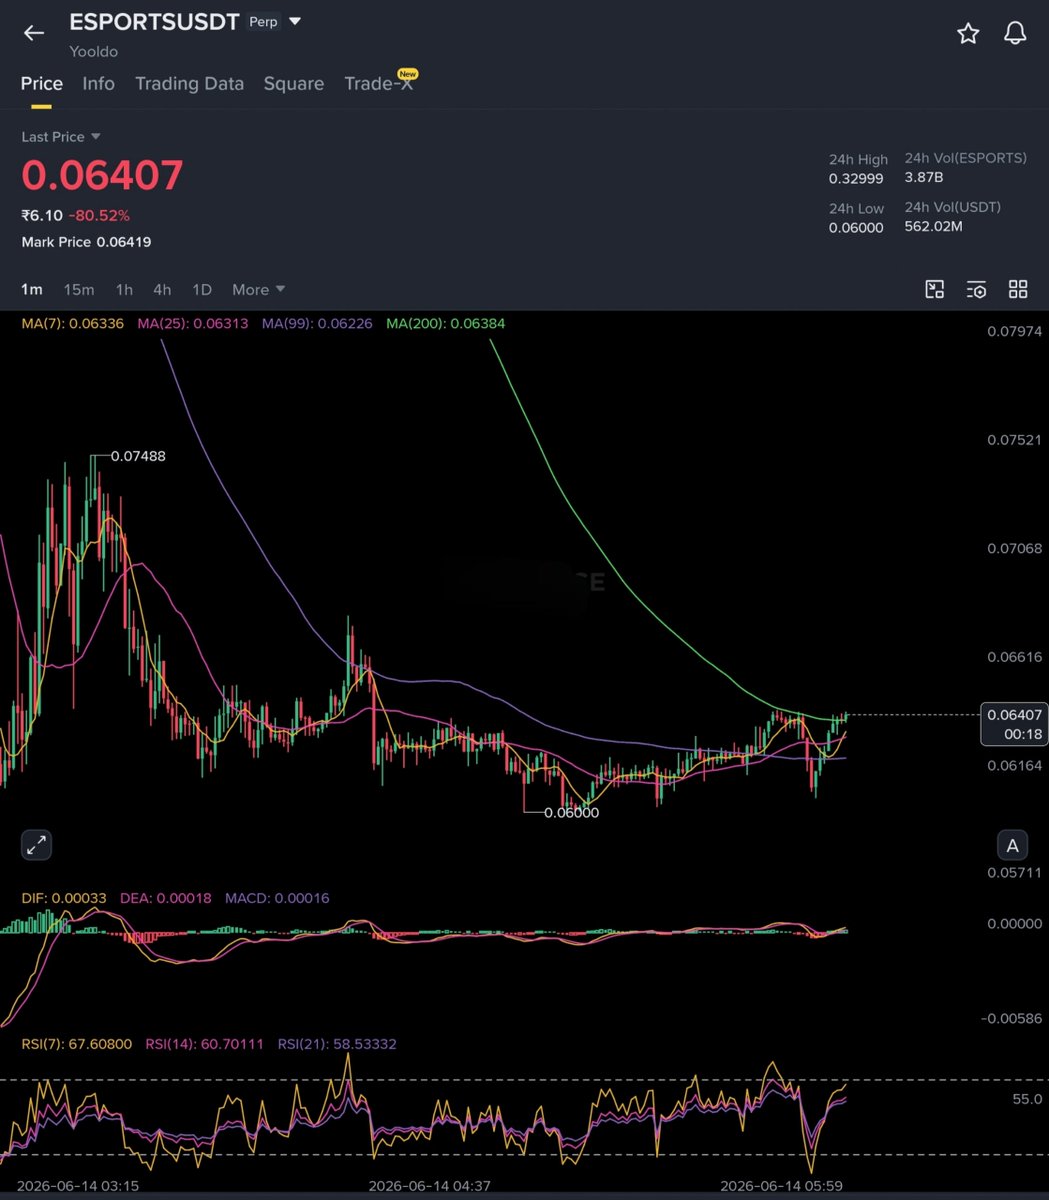
4 targets completed again in the 2nd round of profits of $ESPORTS trade 😜
Still expecting higher targets, but the price needs to build a healthy uptrend momentum; only then is it possible.
I recommend you close at least 30-40% of profits and set SL at entry or TP1 👍🏻
💰 $ESPORTS Trading Strategy
🔼 LONG
✳️ ENTRY: 0.06330 - 0.06195 - 0.06040
🎯 TARGETS: 0.06460, 0.06570, 0.06790, 0.07086, 0.07540, 0.820, 0.100
🀄️ LEVERAGE: 20x
🔴 STOPLOSS: 0.05960
2
154
Public Apology to Crypto Sat Traders 💔
I owe all of you an apology regarding the $BEAT signal.
I shared that setup believing the correction was temporary and that buyers would defend the support zone. Instead of waiting for a proper bullish confirmation, I anticipated the move too early.
That was my mistake.
As traders, we can analyze charts, study indicators, and prepare the best possible plans, but sometimes the market proves us wrong. When that happens, the right thing to do is accept responsibility, not make excuses.
I know some of you trusted my analysis, entered the trade, and experienced losses. For that, I am genuinely sorry.
At the same time, I also want this to be a lesson for all of us. Trading is never about one signal, one trade, or one day. It's about consistency, risk management, and surviving long enough to catch the next opportunity.
I failed by giving a signal before confirmation.
Some of you failed by ignoring the warning signs, position-sizing advice, and risk management guidelines included in the analysis.
Let's learn from this together.
I promise to review my process, become more selective, and focus even harder on quality over quantity. My goal has never been to be right 100% of the time. My goal is to help build disciplined traders who can succeed over the long run.
Thank you to everyone who continues to trust, support, and learn alongside me.
Let's leave this loss in the past, take the lesson with us, and come back stronger tomorrow.
A bad trade doesn't define us. How we respond to it does.
— Crypto Sat 🍸
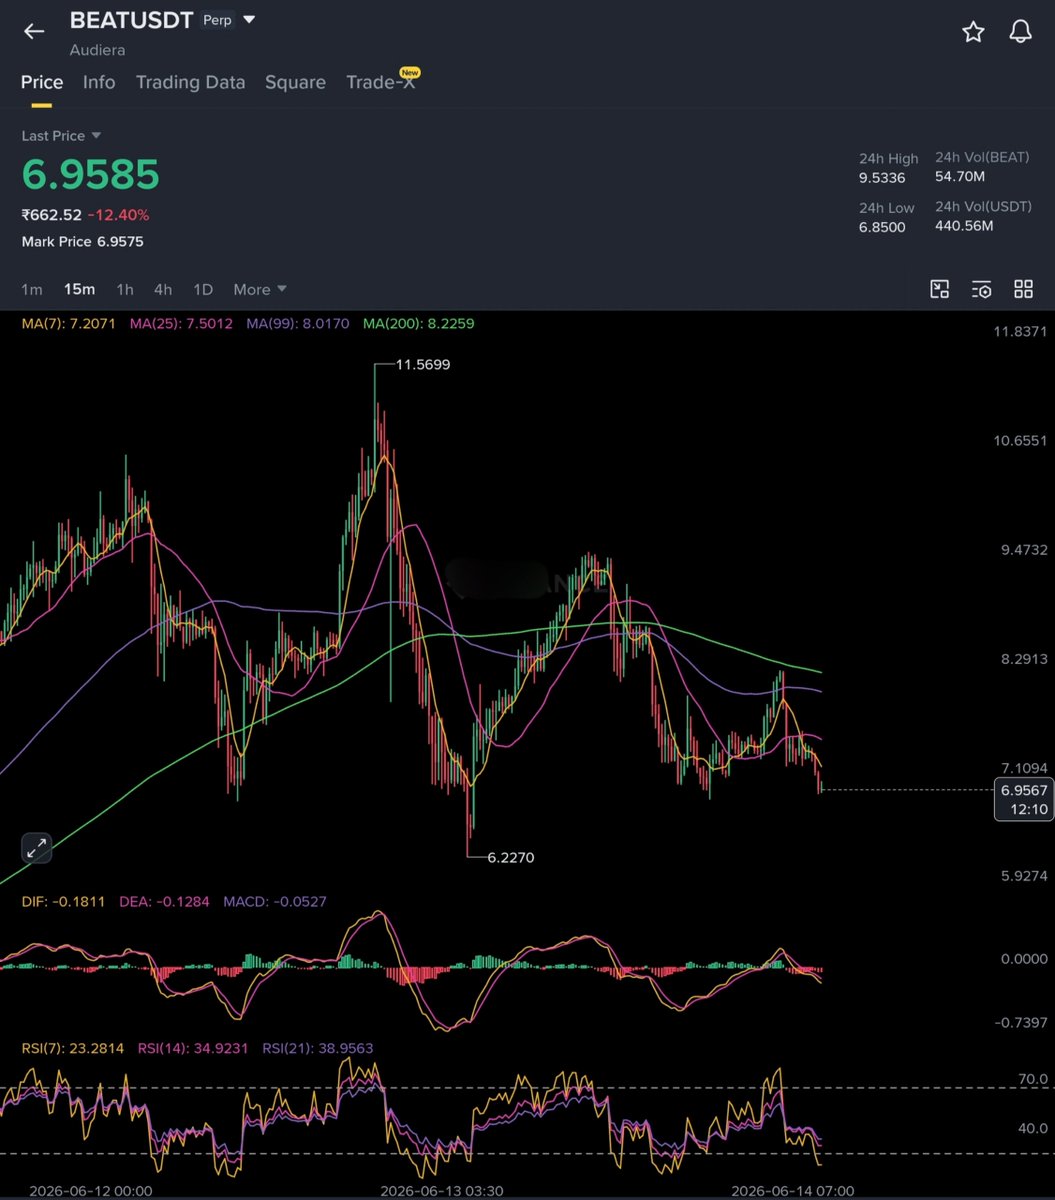
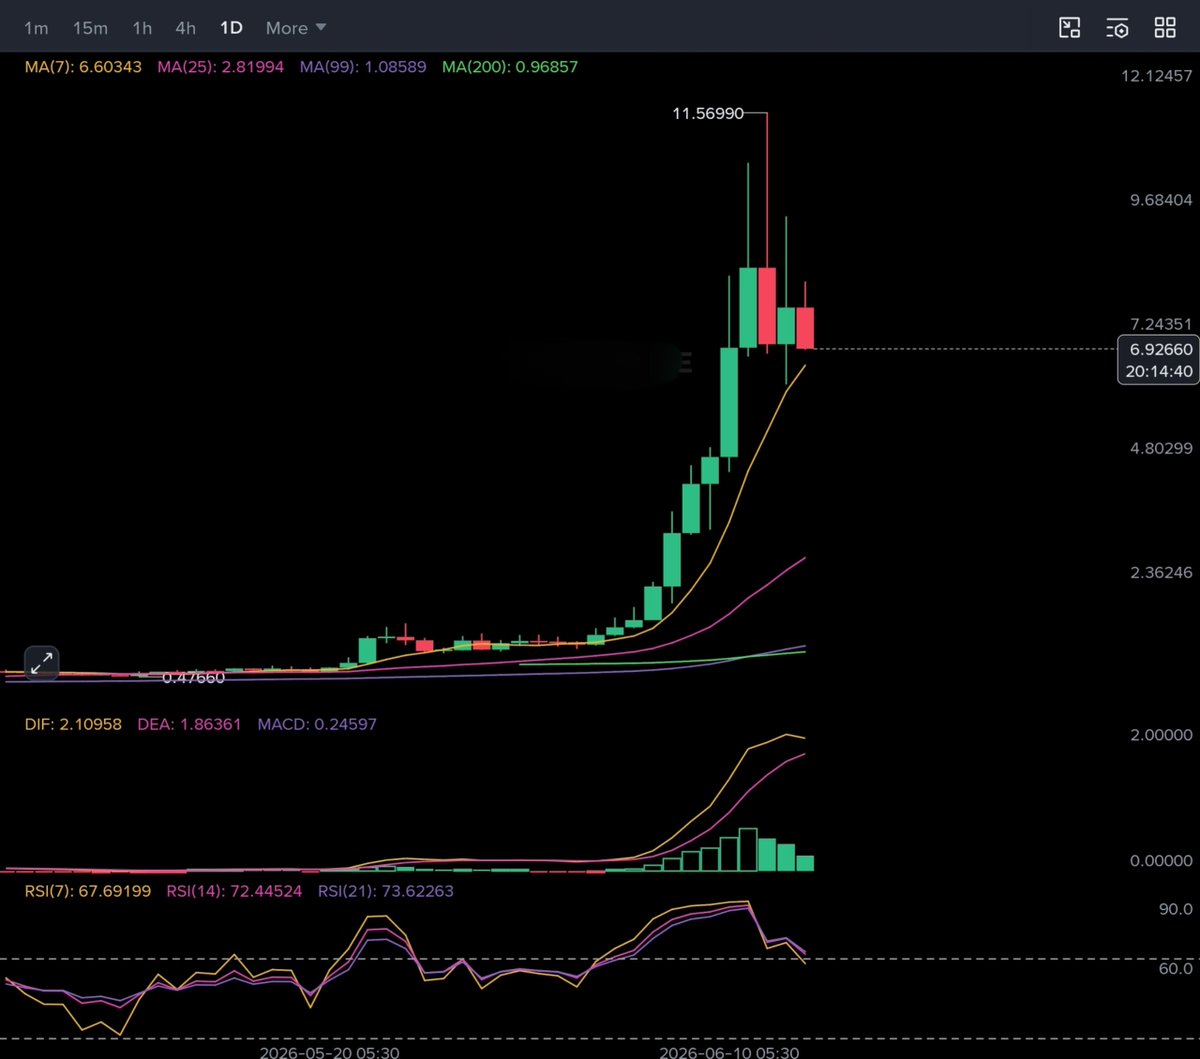
💰 $BEAT Trading Strategy
🔼 LONG
✳️ ENTRY: 6.80 - 6.35 - 5.820
🎯 TARGETS: 7.20, 7.70, 8.250, 9.150, 10.00, 13.00, 16, 20
🀄️ LEVERAGE: 10x
🔴 STOPLOSS: 5.50
#Audiera is showing bearish momentum across most lower timeframes after the massive rally toward 11.57. MACD remains bearish with negative histogram expansion, while RSI continues cooling from previously overbought levels. This suggests the correction phase may not be fully completed yet.
Price is currently testing the MA7 on the Daily timeframe, while the 4H chart remains below MA25, indicating short-term weakness. The first bullish confirmation would be a strong bounce from MA7 followed by a reclaim of MA25 on the 4H timeframe.
I believe this move is a correction rather than the end of the trend. If momentum returns, #BEAT has enough strength to deliver another aggressive expansion leg. However, a deeper retest toward 6.60-5.80 remains highly possible before continuation.
⚠️ IMPORTANT: Don't you dare allocate more than 2-3% of your portfolio to this setup. If this correction extends deeper, oversized positions will make you regret entering. Treat this as a speculative opportunity and focus on proper risk management.
The safest accumulation zone remains 6.60-5.80. If buyers defend that region and momentum shifts bullish again, #BEAT could become one of the strongest recovery plays in the market. 🚀

5
7
445
🚨 $SIREN — From Paradise to Panic in Just Days
Just last Sunday, $SIREN was trading around $1.30
A few weeks earlier, on May 1, it was sitting near $0.50
If you had invested $10,000 at $0.50 and sold near $1.30...
Your portfolio would have grown to $26,000
Profit: $16,000 Return: 160%
This is where smart traders take profits.
But many didn't.
They watched the gains.
They dreamed of $2. Then $3. Then "just one more candle."
What Happened Next?
Price collapsed from $1.38 all the way to $0.075
A brutal decline of roughly 94.5%
The market gave profits.
Then took them back.
Let's compare two traders:
Trader A Bought at $0.50 Sold near $1.30
Profit: $16,000
Trader B Bought at $0.50 Never sold
Today at $0.075...
Portfolio value: $1,500
Loss from initial investment: -$8,500 Return: -85%
The difference wasn't entry.
It was the exit.
💡 The Real Lesson
Most traders lose money not because they buy bad coins.
They lose because they never take profits.
Every cycle creates:
•Early winners ->Late dreamers - > Exit liquidity
•Whales understand this.
•Retail usually learns it the hard way.
📊 Current Situation
Current price: $0.075
•Major support is attempting to hold around $0.074
•If that level breaks, the next important area sits near $0.06
•The historical ATL is around $0.03
•So traders should be watching these levels carefully.
🎯 Investor Mindset would be :
•Taking profit is not weakness.
•Taking profit is the reason you entered the trade.
•A 160% gain that is realized is wealth.
•A 160% gain that isn't realized is just a number on a screen.
"Greed whispers 'hold longer.' The market often replies with a red candle."
2
4
926
💰 $SLX Trading Strategy
🔼 LONG
✳️ ENTRY: 0.195 - 0.1850 - 0.1750
🎯 TARGETS: 0.2030, 0.2150, 0.22750, 0.250, 0.2850, 0.350, 0.5000
🀄️ LEVERAGE: 10x
🔴 STOPLOSS: 0.1680
#SLX is showing a constructive recovery structure across the lower and mid timeframes. Price has reclaimed MA7, MA25, MA99, and MA200 on the 15M chart, while the 1H and 4H timeframes continue printing higher highs and higher lows. MACD remains in bullish territory with positive histogram expansion, indicating momentum is still favoring buyers. RSI is elevated but not yet at extreme levels, suggesting room for continuation if volume remains strong.
The key zone to monitor is the 0.193 support area, where a healthy retest remains possible before the next expansion move. Holding this level would keep the bullish structure intact. Immediate resistance sits around 0.206, while the major breakout level is near 0.220. A decisive close above that region could trigger a stronger momentum phase toward higher targets.
As long as price remains above 0.170, the probability of a larger trend reversal remains valid. The moving averages are beginning to align bullishly, and continued acceptance above MA200 on higher timeframes would further strengthen the setup.
⚠️ Execution Plan: A retest toward 0.193–0.183 should not be viewed as weakness but rather as a potential accumulation opportunity. Avoid chasing green candles aggressively. Scale in gradually using the DCA entries provided and manage risk carefully. If momentum accelerates above 0.220, #SLX could transition from recovery mode into a full trend reversal phase with significantly higher upside potential. 🚀
11 Feb 2025
Our Telegram channel delivers daily crypto signals, market trends, and insider tips to keep you ahead of the curve.
👉 Join Now: t.me/ 59eDt3_3b5E1MzU1
324
🚨 Crazy $SIREN Whale Selling More
A massive SIREN whale (holding 478M $SIREN) is aggressively cashing out:
• Received 28M $USDT from on-chain $SIREN sales in the last 24h
• Deposited 25.7M $USDT to Bitget & Bybit
• Still sitting on 478M $SIREN (~$62.4M at current prices)
Portfolio value: $64.75M (token down -72% in 24h)
The dump is far from over 👀

Jun 13
$SIREN Whale Just Started DUMPING!
Huge move just hit the books. A massive whale just offloaded over 7.5M USDT worth of $SIREN. That’s real money hitting the sell button. 📉
But wait... they’re still sitting on a MONSTER position. 🐬
They hold 595.7M $SIREN tokens (valued at ~$91.86M)!


1
3
291
🎭 $VELVET : Not Dead Yet, But The Real Test Starts Here
Back on 03/23/2026, #VELVET was trading near $0.057, a level where very few traders paid attention. From that base, the token delivered an explosive rally all the way to $1.92, producing one of the strongest moves seen in the market. Such vertical rallies rarely move in a straight line forever, and the sharp correction that followed was expected as early buyers secured profits. After losing more than 70% from the peak, the market has finally started stabilizing around the current range. The big question now is whether this is accumulation before another expansion or simply a pause before another leg lower
⏱️ 15-Minute Chart Analysis
The short-term structure remains relatively healthy despite the pullback from 0.64. Price is still trading above both the MA25 (0.44) and MA99 (0.42), which are acting as dynamic support zones. MACD remains positive, although momentum has cooled slightly after the recent pump. RSI has also pulled back from overbought territory, which is actually constructive because it reduces overheating.
As long as price remains above 0.44-0.45, bulls maintain short-term control.
⏱️ 1-Hour Chart Analysis
This is currently the most important timeframe.
Price has recovered significantly from the lows and is now challenging the 1H MA200 resistance around 0.52-0.53. This moving average is acting as a ceiling and remains the key barrier preventing a stronger breakout. MACD is positive and RSI remains above neutral levels, showing buyers are still active.
A successful reclaim of the MA200 would be a strong signal that the recovery phase is evolving into a genuine trend reversal.
⏱️ 4-Hour Chart Analysis
The 4H chart continues to show signs of rebuilding structure after the crash from $1.92. Price is holding above the MA7, while MACD has crossed upward from deeply negative territory. RSI is steadily recovering, indicating improving momentum.
However, the major challenge remains overhead resistance near 0.60-0.62. Breaking and holding above that region would significantly improve the medium-term outlook.
🎯 Key Levels
Bullish Path
MA200 resistance: 0.52-0.53
Next target: 0.60-0.62 extended towards 0.72
Major resistance: 0.78
Extended targets: $1.00
If buyers reclaim the MA200 and establish support above 0.60, momentum could accelerate rapidly toward the higher resistance zones.
Bearish Path
Minor support: 0.44-0.45
Major support: 0.36-0.38
Breakdown Target : 0.23-0.25
Extreme support: 0.13
📝 Conclusion
Price has already proven what it can do by climbing from $0.057 to $1.92 at its peak. Now the token is attempting to rebuild after a massive correction. The recovery remains valid while price holds above 0.44-0.45, but the real battle is happening at the 1H MA200 resistance around 0.52-0.53.
If bulls reclaim that level and push through 0.60-0.62, the market could begin talking about 0.72, 0.78, and eventually $1 again. If support fails, traders should be prepared for deeper retracements toward 0.36-0.38.
For now, $VELVET is standing at a crossroads—trying to prove that the story which started at $0.057 is not over yet. 🚀
3
3
509
$EIGEN, $ESPORTS and $RIF remain valid for entry
Current Plan:
• Safe entry can still be taken at CMP
• Use DCA only if price offers lower levels
• Keep position size under control
• Don't overexpose your portfolio chasing extra profits
🎯 We're looking for Round 2 Profits, not unnecessary risks.
Once TP3 or TP4 is reached: Move Stoploss to Entry
✅ Let the remaining position run risk-free
Enjoy your Sunday, stay away from revenge trading, and don't let the charts steal your fun day. 😅
We'll come back tomorrow with fresh eyes, better setups, and new opportunities.
Protect capital today so you can attack the market again tomorrow. 📈
2
309
💭 A Thought That Hits Hard
"One day you'll fall asleep for the last time. The question is: did you truly live before that day arrived?"
Most people spend 40, 50, even 60 years following the same routine.
Wake up.
Work.
Complain.
Sleep.
Repeat.
Then one day it's over.
No dreams chased.
No risks taken.
No story worth telling.
And let's be honest...
The world judges quickly.
People respect confidence.
They respect achievement.
They respect those who build themselves mentally, physically, and financially.
Not because looks define your worth.
But because the effort you put into yourself becomes visible to everyone around you.
So ask yourself:
Are you building the life you want? Or just surviving the life you were given?
Because time doesn't care about your excuses.
The biggest risk isn't failing. It's reaching the end of your life and realizing you never truly tried.
3
6
254

💰 $BEAT Trading Strategy
🔼 LONG
✳️ ENTRY: 6.80 - 6.35 - 5.820
🎯 TARGETS: 7.20, 7.70, 8.250, 9.150, 10.00, 13.00, 16, 20
🀄️ LEVERAGE: 10x
🔴 STOPLOSS: 5.50
#Audiera is showing bearish momentum across most lower timeframes after the massive rally toward 11.57. MACD remains bearish with negative histogram expansion, while RSI continues cooling from previously overbought levels. This suggests the correction phase may not be fully completed yet.
Price is currently testing the MA7 on the Daily timeframe, while the 4H chart remains below MA25, indicating short-term weakness. The first bullish confirmation would be a strong bounce from MA7 followed by a reclaim of MA25 on the 4H timeframe.
I believe this move is a correction rather than the end of the trend. If momentum returns, #BEAT has enough strength to deliver another aggressive expansion leg. However, a deeper retest toward 6.60-5.80 remains highly possible before continuation.
⚠️ IMPORTANT: Don't you dare allocate more than 2-3% of your portfolio to this setup. If this correction extends deeper, oversized positions will make you regret entering. Treat this as a speculative opportunity and focus on proper risk management.
The safest accumulation zone remains 6.60-5.80. If buyers defend that region and momentum shifts bullish again, #BEAT could become one of the strongest recovery plays in the market. 🚀
2
4
1,035

$EIGEN 4th target completed 👍🏻
No more new entries. I will recommend if we need a re-entry. Do you understand?
💰 $EIGEN /USDT
🔼 LONG
✳️ ENTRY - 1956, 1919, 1870
🎯 TARGETS - 1977, 1994, 2014, 2050, 2120, 2300, 2600, 3000
🀄️ LEVERAGE - cross 20x
🔴 STOPLOSS - 1810
236