
Joined May 2022
- Tweets 1,518
- Following 433
- Followers 3,442
- Likes 1,403
621 Photos and videos


Pinned Tweet

Jan 20
📢 Today’s Update
🔥 Tracking Swap Global Orders (private group) is back to normal operation.
🔥 Cardano Wallet Alert [@DCOneCryptoBot] is now active with LV5 support.
❌ Note: From version v1.0.4, the BOT will no longer send notifications for transactions below 2 ADA.
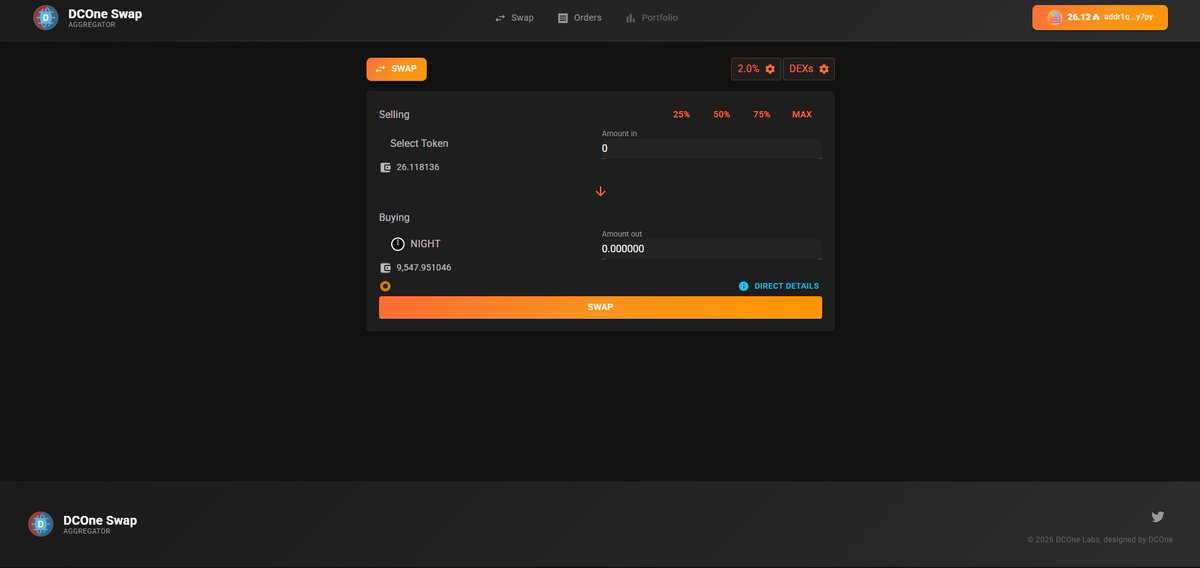
🔥 DCOne Swap Aggregator 2.0 UI is under finalization and remains operational (not available for Vietnam IPs) app.dconecrypto.finance
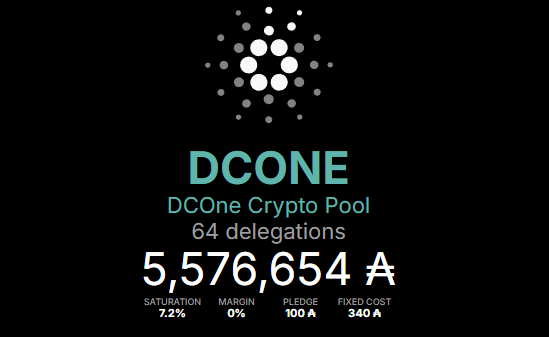
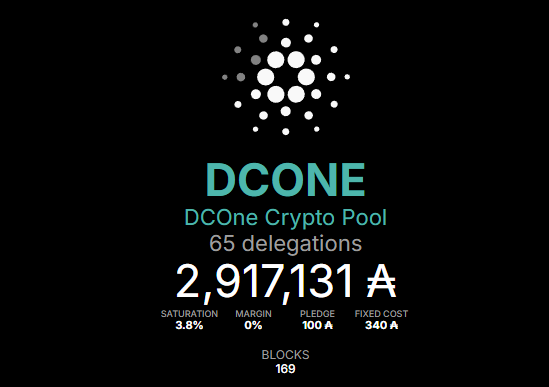
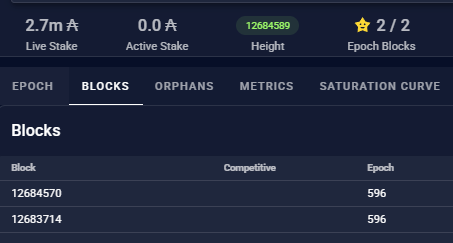
🔥 DCONE Pool Active Stake: 1.9M ADA (sincere thanks to everyone 🙏) pool.pm/333bd4419f2847f1a9f7…
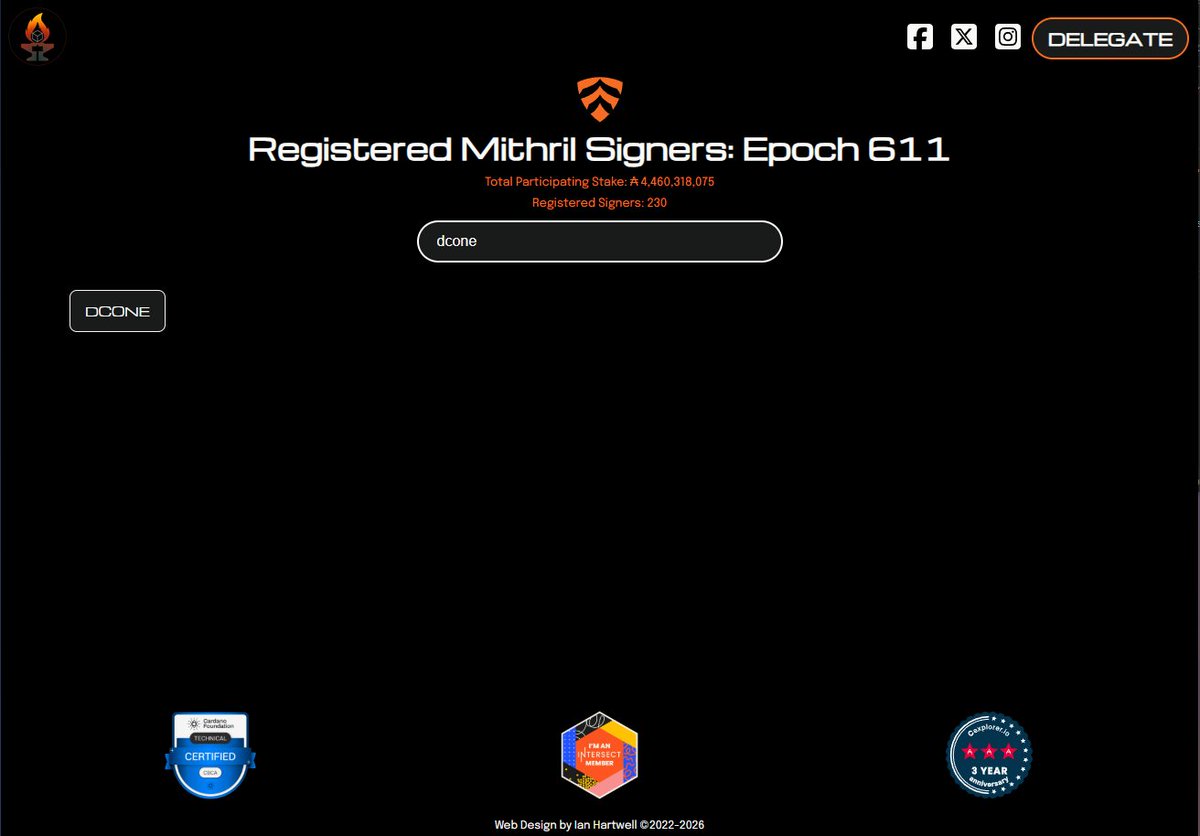
🔥 Midnight Node is being set up to participate in operations.
🔥 Fund15: The team is not participating.
🔥 Team donation wallet (pool wallet):
addr1qxtaxx699hhcymgusgze5jrumkalk3thc92e27zkrl3gsmml7ra5wekgmhpemqk85x85cm3szsqwcxwqhlpukhe8w4ksu7c03h
or $dconenode
1
160
Jun 4
Thank you to all of my friends who have been standing with us and supporting us throughout this period. Your trust and encouragement are a tremendous source of motivation for our team.
A special thank you to everyone who continues to support the DCONE Pool. We truly appreciate every contribution and will continue striving to deliver the best possible value to the community.
Thank you sincerely for your support! 🙏❤️
#ada
28
DCOne Crypto retweeted

May 14
Hydra needs real products, real users, real feedback, real benchmarks and even real failures so we can learn and improve.
That’s what we’re trying to contribute with Hydra One.
Hydra is NOT a Layer 2 for every possible use case.
Hydra is strongest when applications need:
⚡ Low latency
⚡ High-frequency transactions
⚡ Near-zero fees
⚡ Fast settlement
⚡ Verifiable state transitions
That’s why we started building real-time application experiences on Hydra One:
🐉 Hydra Fly: a real-time skill game
🌊 River Cross: a provably fair risk/reward game with cash-out & proof verification
🎁 Hydra Gacha: a reveal/drop primitive focused on transparency & auditability
👉 alpha.hydraone.app/
These are not the “final use cases” of Hydra.
They are reference implementations to test what really matters: Can users connect a wallet, deposit assets, play, cash out, verify results, and move smoothly between applications?
Hydra One is also our attempt to make managed heads easier to understand and more trustworthy.
Managed heads should mean:
🔍 Transparent operators
📊 Clear system state
🧾 Verifiable proofs
🛡️ Clear risk assumptions
🌉 A visible exit path back to L1
That’s why Hydra Hub and Hydra One Proof Explorer are core parts of the stack.
Our goal is simple:
Move Hydra from “interesting technology”➡️ into a usable ecosystem. @sharan_konerira @v0d1ch @tony_thanh_ @haiph_9
2
14
36
6,268
May 11
1
126
DCOne Crypto retweeted

May 3
How much has your DRep actually committed to spend?
DAVEGov lets you see it directly. Connect your wallet or search any DRep to view their committed spend across the current budget cycle and prior periods.
You can also inspect how they behave, their mission. Voting patterns, participation, relative rank, and overall activity are all visible in one place. This gives a clearer picture of intent, consistency, and fiscal approach over time.
If governance is about accountability, this is where it starts, enjoy!
governance.cardano-visualisa…

22
23
192
4,546
DCOne Crypto retweeted
May 1
There is a clear overlap between Midgard and work that has already received funding, and in my view that needs addressing head on.
Hey @sharan_konerira, from what I can see so far, the Midgard scope overlaps with prior allocations from both Catalyst and treasury. Catalyst covered 500k ADA, with progress only shown up to January 2026 and sitting at around 60 percent. On top of that, treasury withdrawals from last year total 2.162 million ADA.
Looking at this practically, I am struggling to see output that lines up with that level of funding. I have not come across a working end to end demonstration that shows the system running in anything close to a real environment. The Intersect milestone tracker also shows the work running more than four milestones behind, with only the first milestone having actually drawn funds.
There are also signals from the repo itself. Activity has declined sharply, roughly a two thirds drop from its early 2025 peak, and more than halved compared to the late 2025 window. There are still commits in the last couple of weeks, so it is not inactive, but the development pace is now at its lowest point in the past 16 months.
At this stage I took some time to go through the code in the Midgard repo in detail and compare it against the milestones submitted to Intersect on the previous withdrawals.
From my own assessment, I do not believe the current state is sufficient to justify sign off, which might be why the funds have never been claimed and the Milestone's are still not closed. There is clearly engineering effort in place, but I cannot see any milestone that is complete, integrated end to end, tested, and deployable. The node is still not wired to the real contracts, fraud proof logic is actively being refactored, and there are open issues raised by the team themselves that point to fund locking and payout edge cases. The SDK and offchain components are still sitting in preliminary states, and there is no clear release process, testnet deployment, or CI pipeline that would give confidence in stability.
There are also some basic signals I would expect to see by this stage that are missing. No tagged releases, no public testnet, limited automated testing, and a growing number of open branches, open issues and PRs that have not been closed out (20 at this time). Combined with the continued slowdown in repo activity, it paints a picture of work in progress rather than something nearing completion or even in my opinion ready for us to commit more funds too.
To me, that creates a gap between what has been paid out and what can be verified. Over 2.66 million ADA has already been allocated across Catalyst and treasury withdrawals, and I do not yet see delivery that matches that level of spend.
On a more practical note, I also offered to help by posting updates and keeping the community informed. Phil said he would reach out, but that never happened, which was disappoint. That does affect my confidence in the delivery of this project. Communication is part of delivery, and right now my trust in the progress is increasingly reducing.
I would also welcome a formal statement on the above to clear this up, not just for me but for other DReps and delegates who are asking the same questions.
This is based on what I have observed so far, so if I have missed something, I am open to being corrected or pointed in the right direction.
I find it difficult to support further funding decisions without clarity on what has already been delivered.
I will review the new proposal on its own merits, but this context around prior funding and delivery needs to be clearly understood first.
6
19
153
3,157
DCOne Crypto retweeted

Apr 23
🤝@MinswapDEX Aggregator now integrates @DanoFinance .
Most routes now flow through Dano - powered by concentrated liquidity for lower slippage and better execution.
Try it now!
More integrations coming.

4
13
76
2,157
Mar 26
We would like to express our sincere thanks to @ItsDave_ADA for contributing the amazing open-source toolkit OgmiosDotnet, and especially the extended version OgmiosDotnet.BlockchainEvents built on the C# platform.
Building on this foundation, our team has continued to develop and expand with several key features. Beyond chain synchronization (chain sync), we have successfully integrated parallel mempool processing while still ensuring that all rules operate accurately and reliably.
This marks an important step forward—making the system more powerful, more real-time, and opening up new possibilities for community-driven applications.
🙏 Once again, thank you to the author and the open-source community for providing the foundation that allows us to continue building and contributing.
💙 If you find this work valuable, please support Pool DCONE to help us stay motivated and continue developing new features for the community!
📌 Source:
github.com/ItsDaveB/OgmiosDo…
Let’s build a stronger Cardano ecosystem together! 💪
1
9
44
3,882
DCOne Crypto retweeted
Mar 17
Breaking News
Cardano (ADA) has now been formally detailed by the SEC as a digital commodity, not a security today.
It is written directly into the Commission’s latest interpretive release. (Released Today)
A digital commodity is an asset that derives its value from the programmatic operation of a functional crypto system, not from the expectation of profits driven by the efforts of others.
ADA is listed alongside Bitcoin and Ethereum under that classification.
72
515
2,209
81,558
DCOne Crypto retweeted

Mar 16
Happy 4th birthday to Minswap 🎂
From an idea by a group of Vietnamese students to build a DEX on Cardano to becoming a core piece of the ecosystem’s liquidity layer.
4 years of swaps, LPs, farms, and building through every bear, bull (and cat) market 🐈
Excited to see what the next chapter brings 😼
26
33
240
7,245

#Binance is excited to announce the Midnight HODLer Airdrop – @MidnightNtwrk $NIGHT.
BNB Holders, get ready! The Airdrop page will be available on the Binance Airdrop Portal in 3 hours. Plus, this token will be listed on Binance soon!
👉 binance.com/en/support/annou…
239
432
1,706
277,698
Mar 11
Cool 👍
Mar 10

Just shipped: the easiest way to connect Claude to Cardano DeFi Indigo Protocol. 🔮
4 commands. 66 tools. 2 minutes.
CDPs, staking, pools, wallet ops — all from natural language.
Watch the setup 👇
39
DCOne Crypto retweeted
Mar 8
Here is a compiled thread of some of the projects currently building on Cardano as of March 2026.
I am fully aware I will have missed some, so feel free to add them into the thread.
I will try to do this more regularly as a way to showcase what is actually being built across the ecosystem. The market recently has been rough, and governance debates have taken their toll on sentiment and all of our energy levels.
But underneath that, builders continue building on Cardano So I wanted to start Sunday with a simple reminder of the utility and cool projects emerging across Cardano.
42
68
331
19,525
DCOne Crypto retweeted

Mar 1
The ADA/USDCx pool on Splash now has over 150k ADA liquidity🫡

16
28
301
5,057

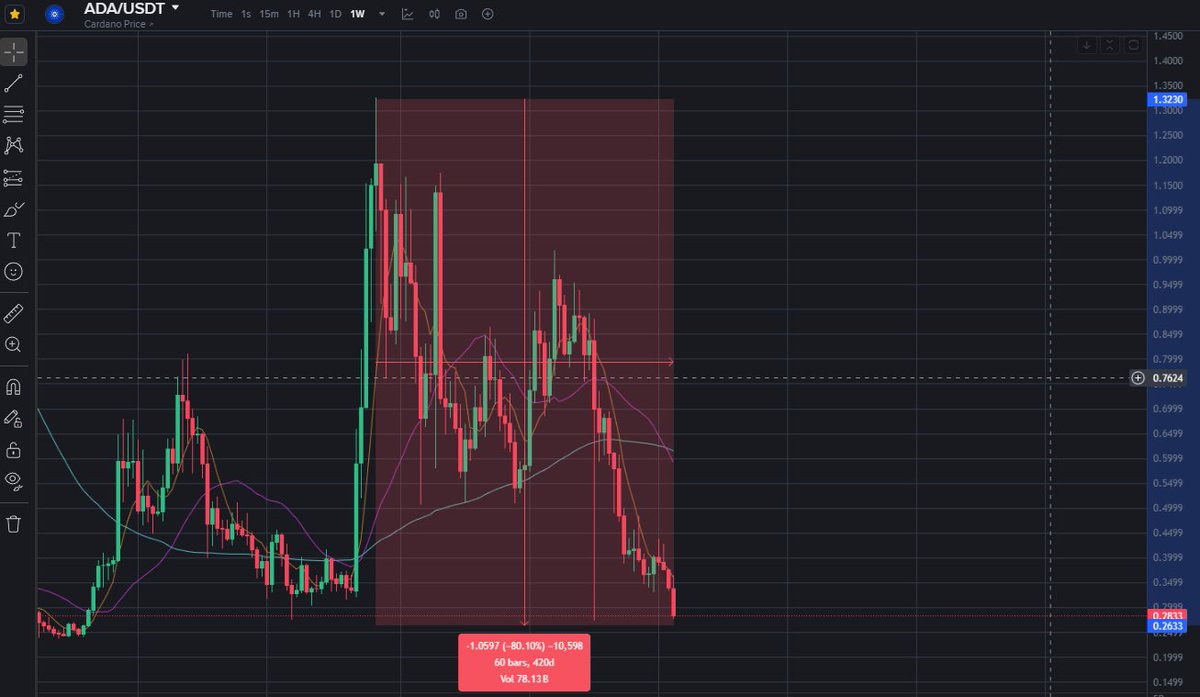
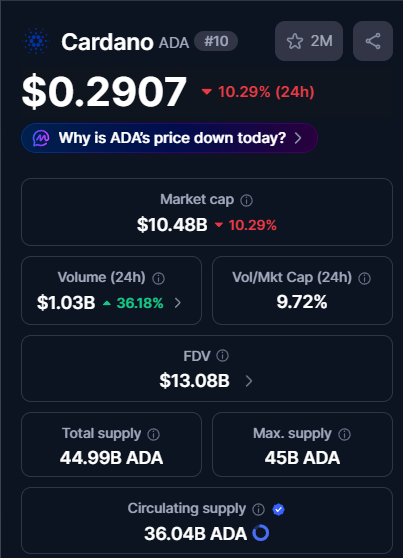
Markets: @Cardano whales accumulate 819M $ADA ($213.9M) over six months despite 71% price drop from $0.90 to $0.26 since October 2025, per @santimentfeed.
68
125
663
32,077
Feb 17
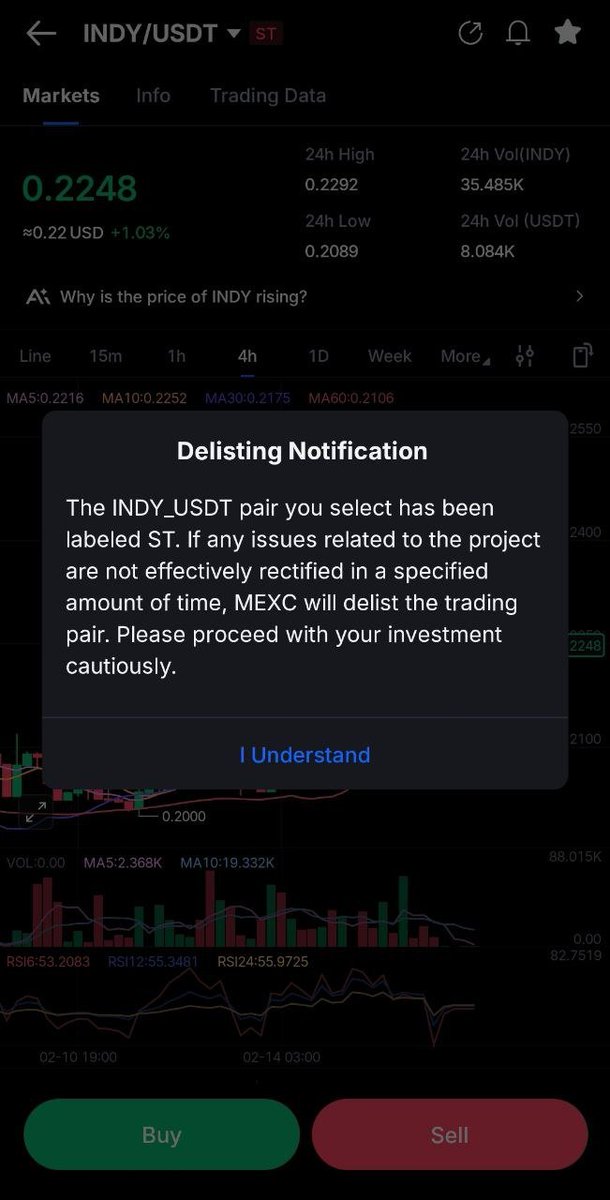
Hey @Indigo_protocol ,Do you think we should proactively address and resolve this issue?
#ada
79
DCOne Crypto retweeted
Feb 3
Visualising how far Cardano has come.
What you are seeing here is live on chain DEX activity as the chain syncs over the last hour. Real swaps, real transactions, and the resulting liquidity changes unfolding in real time. No simulations, no replays. Just the ledger behaving as specified, and me reading it directly.
I also built a DEX battle view, showing swap activity across the DEXs I track over the same period. It makes something very clear. Competition on Cardano is real. Liquidity competes, routing competes, and execution quality matters. Watching DEXs contend for flow is a good signal that the network is being actively used.
I have upgraded my arbitrage dashboard to pull swap execution, pool state changes, monitoring, and analytics into one place. Cardano’s determinism matters here. Every state transition I can predict, they are traceable, and verifiable. That is what makes this kind of application straightforward to build and reliable to operate over time. It is an extremely valuable architectural decision that Cardano gives to builders, and one that continues to pay dividends as systems scale and complexity increases.
(Apologies on the other DEX's, I have these integrated but also some pending changes on an upgrade I am doing and not yet finishes so didn't want to include without reliable results)
Please comment thoughts, I wanted to share behind the scenes on what is happening across Cardano.
Feb 3

Working on a Cardano DEX Battle Royale Visualisation for real DEX swaps in the last hour, will post a basic demo shortly, been a bit of evening fun, but it's cool to watch :)
18
54
302
11,372
Feb 2
Hello Cardano community 👋
Welcome to the Cardano ecosystem — home of eUTxO, Plutus smart contracts, DeFi, staking, and long-term builders 🚀
From developers and DeFi farmers to patient ADA holders, everyone’s here 😄
Feel free to jump in and share:
Are you building on Cardano?
Trading or using DeFi (Minswap, Sundae, DexHunter, etc.)?
Or just saying hi to the community?
Glad to have you here 💙
#ada
1
60
DCOne Crypto retweeted
Jan 27
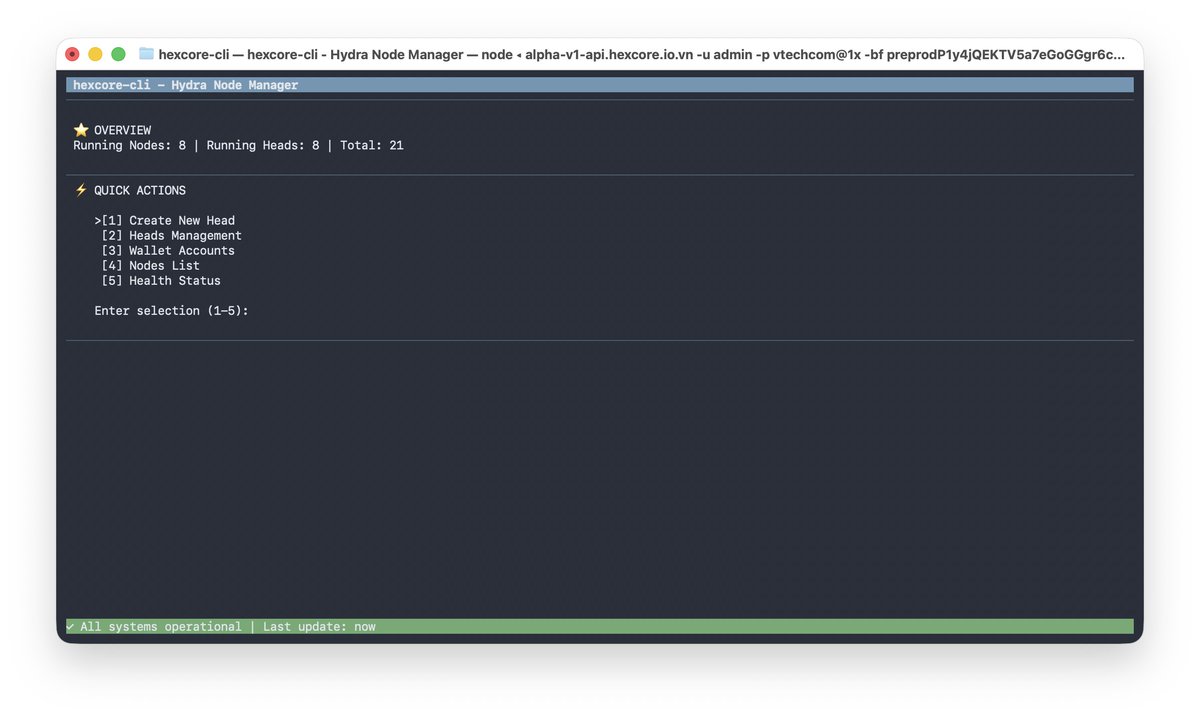
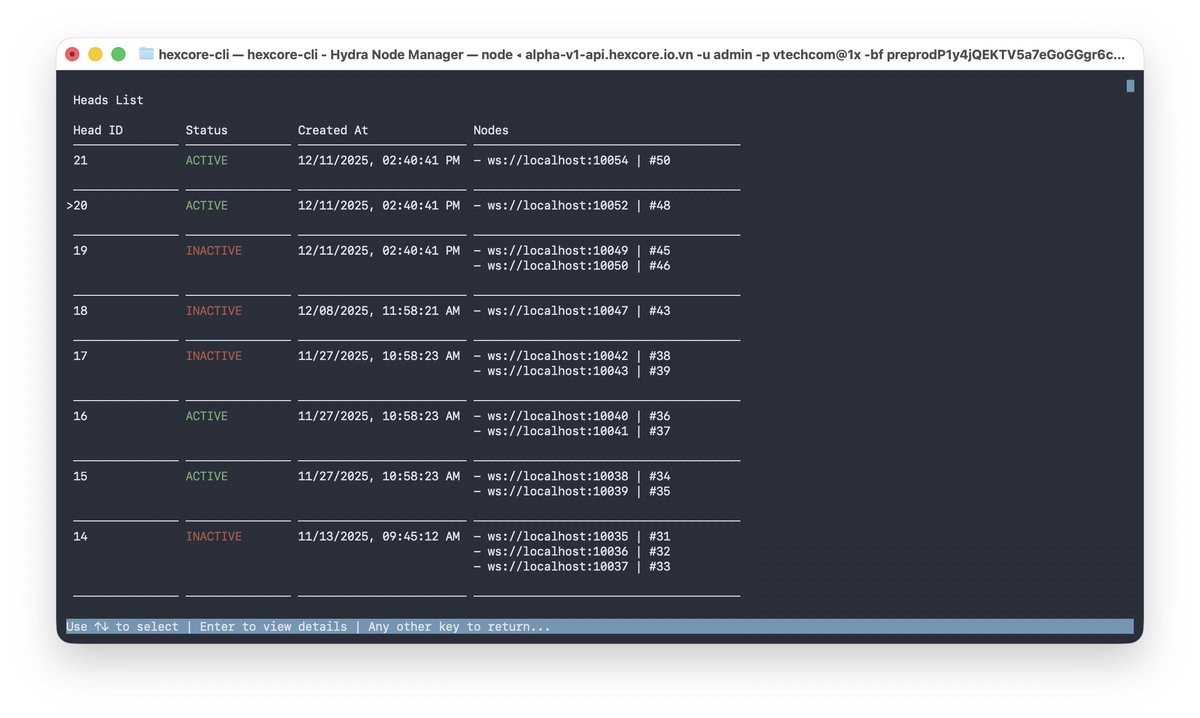
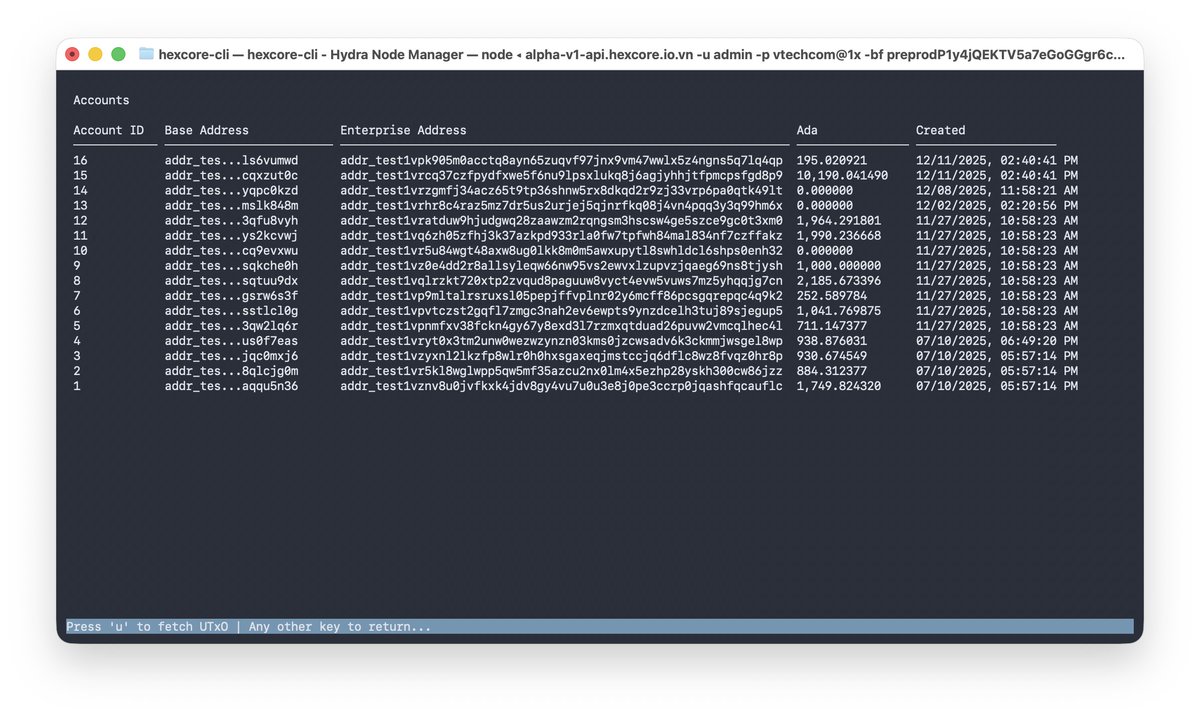
Max shipping Hexcore-cli - Hydra Node Manager V1 github.com/Vtechcom/hexcore-…
1
3
5
324