Driving value through the @Oraichain ecosystem. AI x Web3.
- Tweets 758
- Following 36
- Followers 16,400
- Likes 1,028


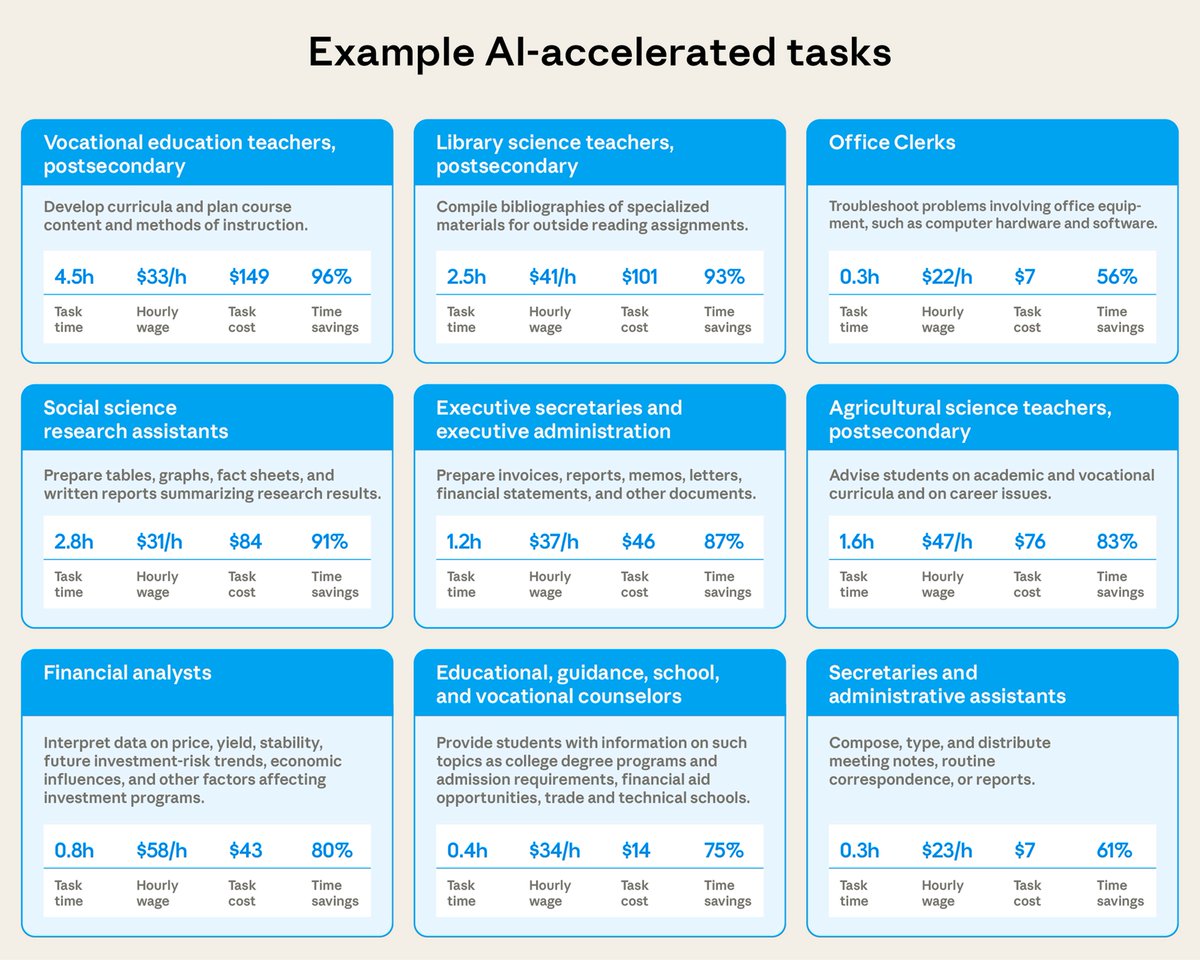
ALT Claude’s estimated task time, average hourly wage of the occupation, implied task cost, and time savings for nine different tasks. Task time is estimated by having Claude predict how long a professional would take to perform the task without AI assistance. Hourly wage is derived from the Occupational Employment and Wage Statistics (OEWS) May 2024 data. Task cost is computed by multiplying the task time by the hourly wage. Time savings is computed by estimating the time the human took to complete the task and computing 1 - time_with_ai / time_without_ai.

ALT Density plot of time savings across O*NET tasks in our sample. We see that Claude’s estimated time savings are uneven across tasks in our sample, with most falling between 50 and 95%. The overall median savings is 81%. Time savings are computed by 1 - time_with_ai / time_without_ai. Our estimates do not take into account the time spent refining Claude’s output outside of the chat window.