- Tweets 1,301
- Following 90
- Followers 485
- Likes 2,854


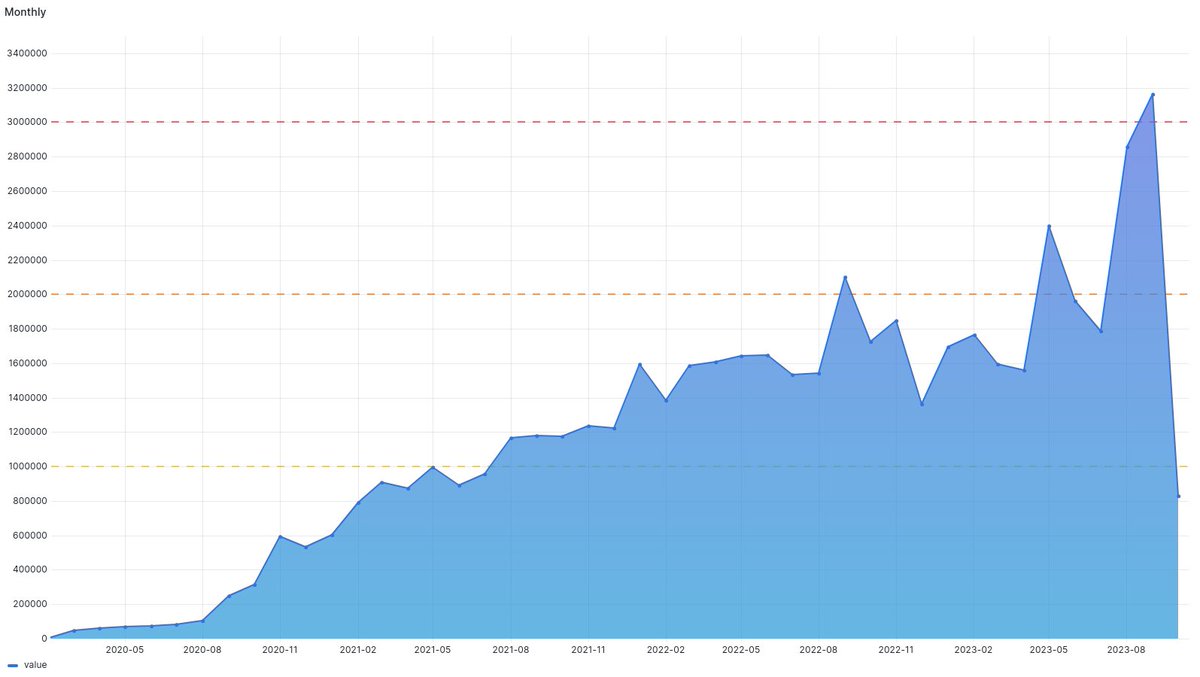
ALT A time series graph titled "Kroki monthly requests received total". This graph plots monthly data from around 2020-05 to 2023-08. On the Y-axis, values range from 0 to approximately 3,400,000, indicating the number of monthly requests. The X-axis represents time in months and years.
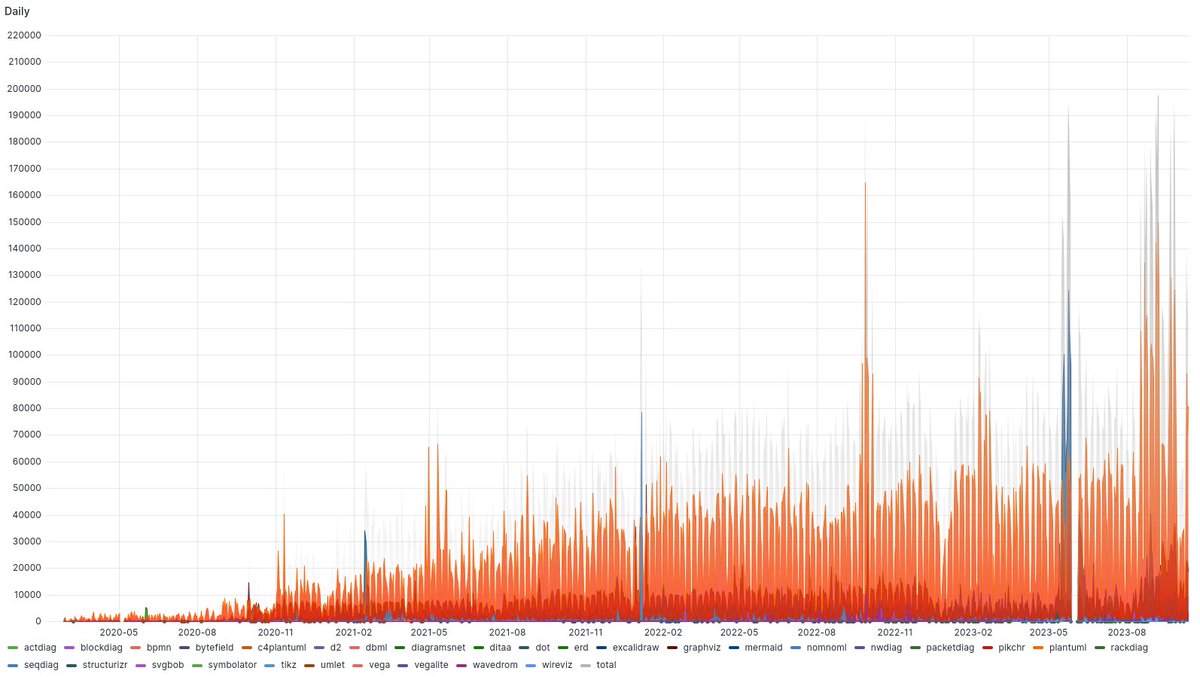
ALT A time series graph titled "Kroki daily requests received". The graph plots daily data from around 2020-05 to 2023-08. On the Y-axis, there's a scale from 0 to approximately 220,000, indicating the number of daily requests. The X-axis represents time. Multiple data series are depicted using different colored lines, each representing different types of requests such as "blockdiag", "bpmn", "bytefield", "c4plantuml", "dbml", and several others. There are around 24 different categories, each with its own color, including one for "total".