
stop guessing where price will go, we show you the odds. trade with data, not your emotions. technical analysis made simple. edgeful.com/disclaimer
Joined June 2023
- Tweets 24,505
- Following 245
- Followers 20,204
- Likes 36,375
5,965 Photos and videos


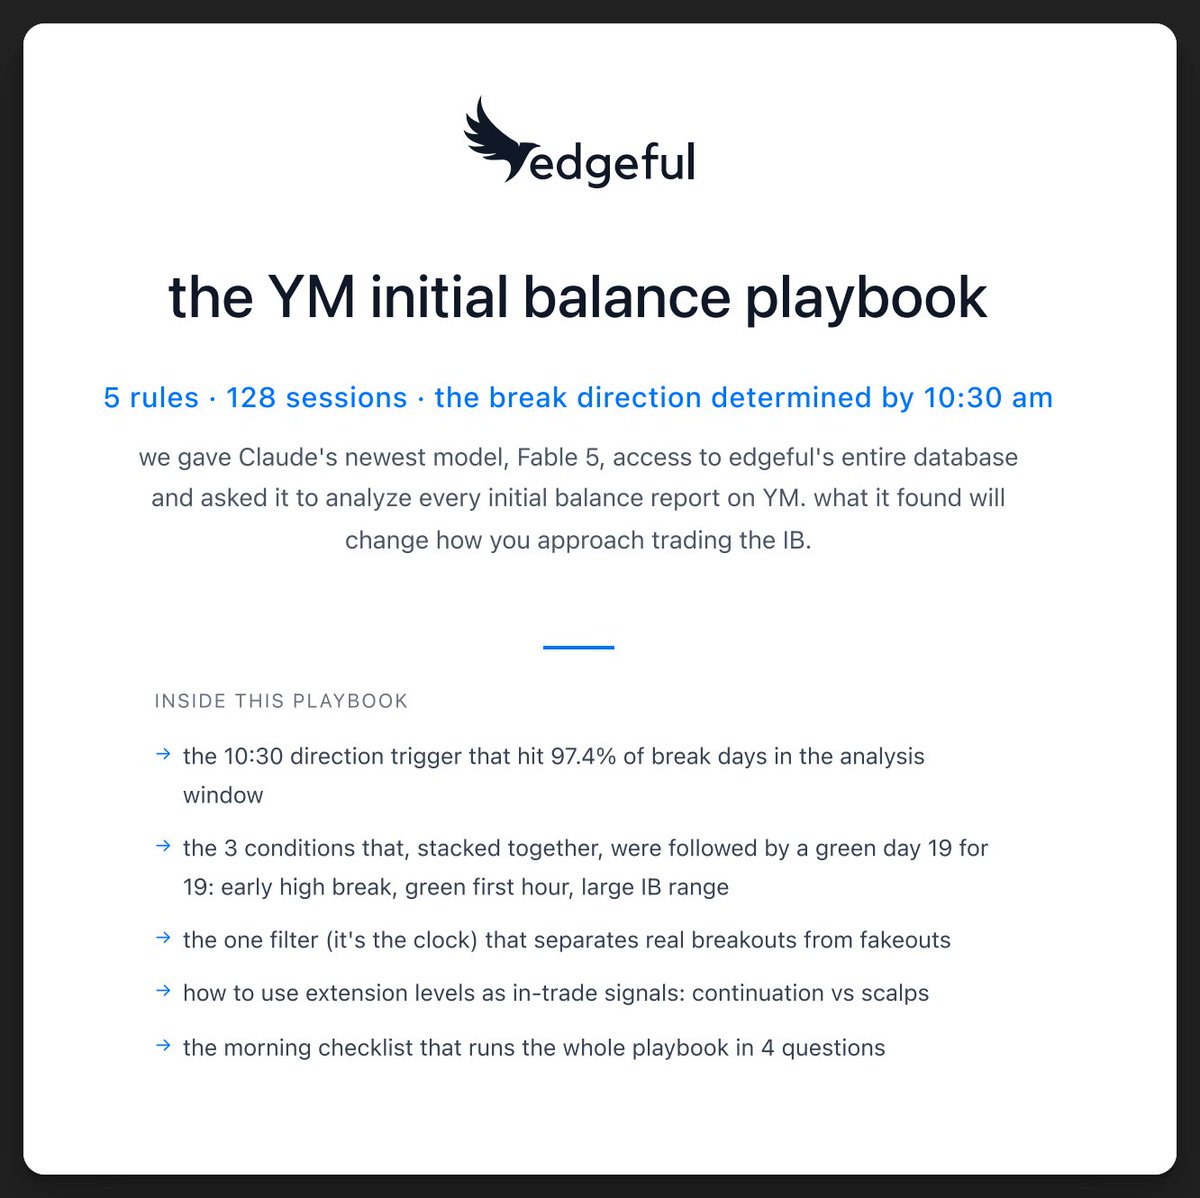


we gave Claude's newest model Fable 5 access to edgeful's entire database and asked it to analyze every initial balance report.
what it found will change how you approach trading the IB.
like reply "IB" and we'll send it to you for free (must be following so we can DM).
763
22
643
56,980
on YM over the last 6 months, which side of the IB breaks first is basically a guess: 46.1% high, 47.7% low.
add two conditions you can check at 10:30am ET, and one direction hit 97.4% of break days.
today's stay sharp breaks down both conditions:
2
1
15
3,346
our API is live. To show you what you can actually do with it, I sat down with VS Code Claude Code and built two custom dashboards on camera:
→ a cross-report mashup of NQ IB rejection data — by weekday, by IB size, by outcome
→ an ES vs NQ comparison dashboard from one follow-up prompt
then I had Claude act as a financial analyst and dig for patterns I’d never thought to look at. (Spoiler: IB rejection broken down by weekday is more interesting than I expected.)
the big idea: you’re no longer locked into the edgeful UI. Pull the raw data, hand it to Claude, visualize and cross-compare it however you want.
heads up: this one’s for more advanced users who are comfortable with Claude Code or a similar agentic coding setup. if that’s not you yet, I have an edgeful API explainer a Claude Code intro coming. and use the /dashboard skill — slash commands give way better results than raw prompts.
this is just the beginning of the edgeful API. if you have wish list items or want a specific build, hit reply or ping support inside the app — we’re building this with you.
4
2
19
2,901
enjoyed this post?
you'll enjoy the free IB 50 playbook we put together in collaboration with @MrZincx.
entries, exits, and the data behind the strategy.
you can get access here, and start trading it tomorrow: edgeful.com/ib-50-zinc-free-…
1
1,070
we gave Claude's newest model access to edgeful's entire database and had it go deep on the IB.
on YM, it found:
→ the break direction, usually set by 10:30am ET
→ a 4-condition stack that went 19 for 19
→ a time filter that catches failing breaks
full breakdown Saturday ↓
2
1
33
4,254
edgeful API is live
I built a custom ES vs NQ IB rejection dashboard from a single prompt using Claude Code the edgeful skills.
If you’re more dev-flavored or just tired of the constraints of our UI, this is the video for you.
use the /dashboard skill — way better results than raw prompts.
wishlist items / feedback always welcome.
watch the video linked below 👇🏼
1
1
12
2,278
in case you missed it:
Claude's newest model Fable found some insane IB stats using our data.
we put together a free playbook on it, no email required. you can access it here:
drive.google.com/file/d/1xAV…

we gave Claude's newest model Fable 5 access to edgeful's entire database and asked it to analyze every initial balance report.
what it found will change how you approach trading the IB.
like reply "IB" and we'll send it to you for free (must be following so we can DM).
4
4
35
7,327
this indicator will simplify your trading 🫡

1
2
16
2,608
thousands of traders will learn the exact conditions to look for in an hour.
make sure you're on the list, sign up is free:
edgeful.com/newsletter
1
903
we gave Claude's newest model Fable 5 access to edgeful's entire database and asked it to analyze every initial balance report.
what it found will change how you approach trading the IB.
like reply "IB" and we'll send it to you for free (must be following so we can DM).
763
22
643
56,980
edgeful retweeted

Jun 13
another one
my favorite emails to get

1
11
904
we gave Claude's newest model access to edgeful's entire database and had it go deep on the IB.
on YM, it found:
→ the break direction, usually set by 10:30am ET
→ a 4-condition stack that went 19 for 19
→ a time filter that catches failing breaks
full breakdown Saturday ↓
2
1
33
4,254
enjoyed this post?
you'll enjoy the free IB 50 playbook we put together in collaboration with @MrZincx.
entries, exits, and the data behind the strategy.
you can get access here, and start trading it tomorrow: edgeful.com/ib-50-zinc-free-…
1
4
925
in case you missed it:
Claude's newest model Fable found some insane IB stats using our data.
we put together a free playbook on it, no email required. you can access it here:
drive.google.com/file/d/1xAV…
we gave Claude's newest model Fable 5 access to edgeful's entire database and asked it to analyze every initial balance report.
what it found will change how you approach trading the IB.
like reply "IB" and we'll send it to you for free (must be following so we can DM).
4
4
35
7,327
want to remove emotions from your trading? we built a free futures trading course that walks you through it step by step.
sign up is free:
edgeful.com/futures-trading-…
2
668
join thousands of traders receiving this week's stay sharp, breaking down every single finding from Claude's newest model (free):
edgeful.com/newsletter
1
4
1,207
want to remove emotions from your trading? we built a free futures trading course that walks you through it step by step.
sign up is free:
edgeful.com/futures-trading-…
2
1,220
edgeful API is live
I built a custom ES vs NQ IB rejection dashboard from a single prompt using Claude Code the edgeful skills.
If you’re more dev-flavored or just tired of the constraints of our UI, this is the video for you.
use the /dashboard skill — way better results than raw prompts.
wishlist items / feedback always welcome.
watch the video linked below 👇🏼
1
1
12
2,278
build custom trading dashboards with the edgeful API Claude Code: youtu.be/VKdqqGgMuRI
1
1
1,931