
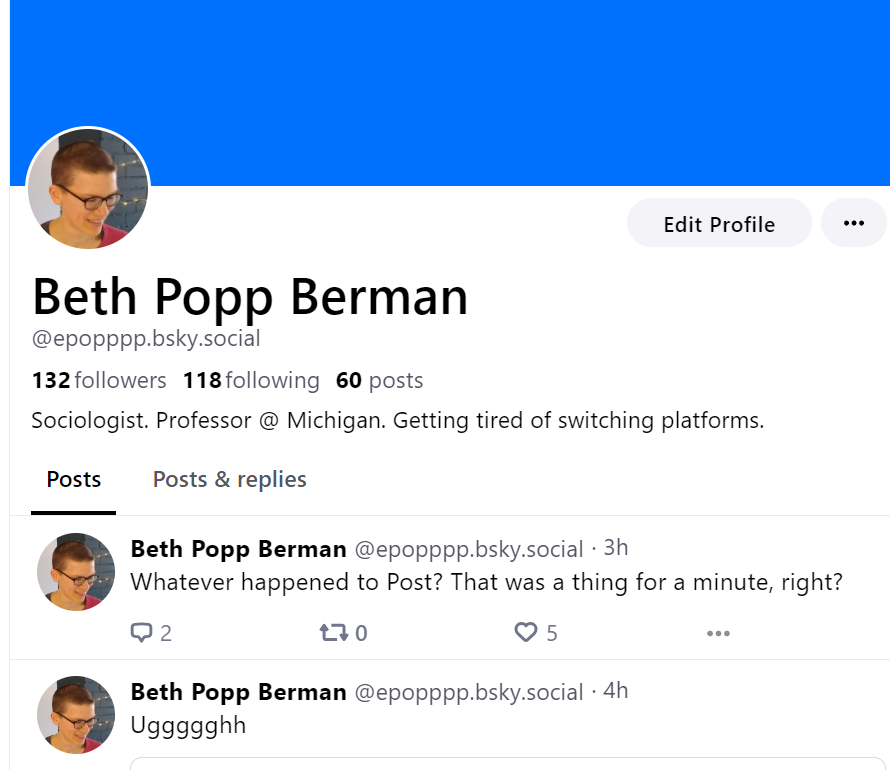
Sociologist @UMich. Book: Thinking Like an Economist: How Efficiency Replaced Equality in U.S. Public Policy @PrincetonUPress bit.ly/3yCyfT1.
Joined June 2014
- Tweets 25,231
- Following 1,542
- Followers 12,131
- Likes 31,088
991 Photos and videos


Pinned Tweet

5 Apr 2022
After 10 years, 4 drafts, 3 houses, 2 jobs, a pandemic and a life-threatening illness, it’s publication day! A book thread. press.princeton.edu/books/ha…
82
301
2,216
Beth Popp Berman (epopppp@bsky) retweeted

20 Sep 2023
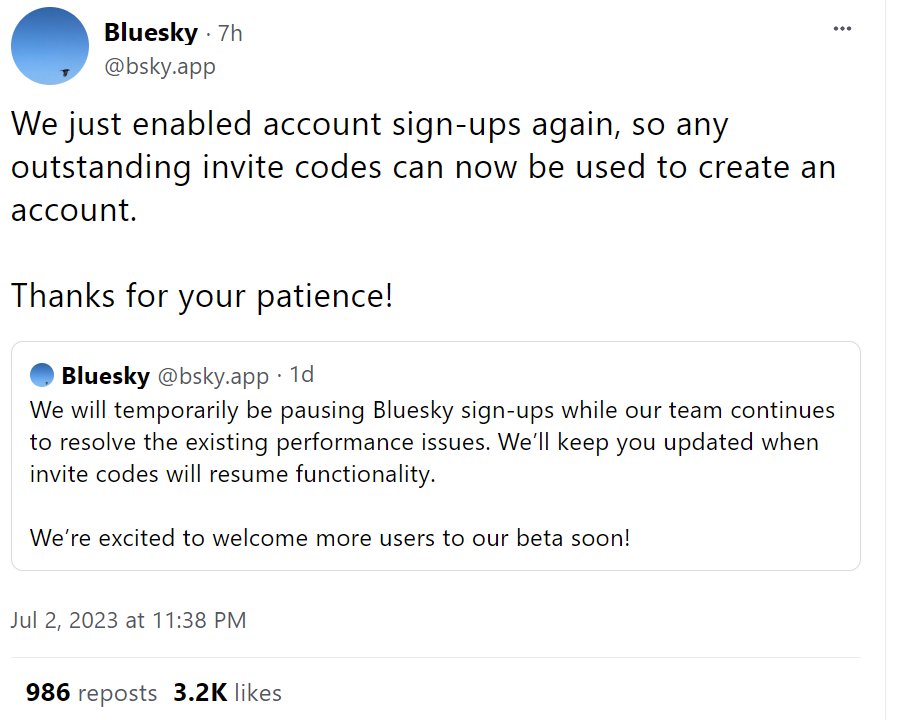
Exit option: I have codes. DM.
1
2
3,727
5 Sep 2023
Gave my two away but here's another offer from the invite-rich @runzach
5 Sep 2023

Just chiming in to say I have five (5) invite codes if you want to send people my way
3
2,024
5 Sep 2023
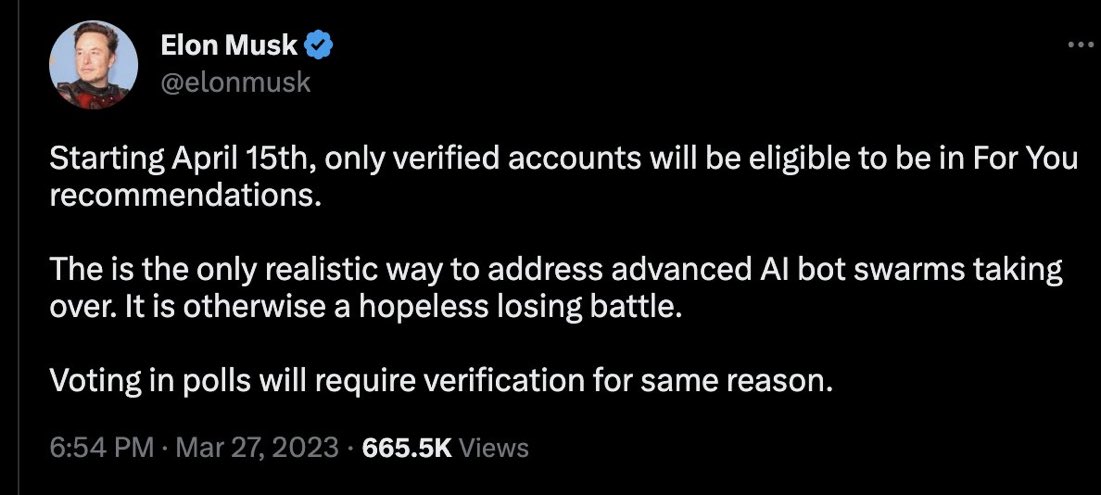
Still see people I miss here, but Elon's latest antics have reinforced my decision to stay the f@#$ off this platform.
Keeping the account for so I can keep giving invite codes to mutuals. I've got two today, reply or DM if you want one.
6
2
22
5,670
Beth Popp Berman (epopppp@bsky) retweeted

19 Aug 2023
IT’S A SWEEP! 🧹 Congratulations to @epopppp, @RoiLivne, and @miradvale! @umich received all three major awards from the @ASAnews #EconomicSociology section last night. 〽️ #GoBlue!

8
48
7,705
Beth Popp Berman (epopppp@bsky) retweeted

18 Aug 2023
Congrats Beth on your book winning the Political Sociology Section Book Award!
5 Apr 2022

After 10 years, 4 drafts, 3 houses, 2 jobs, a pandemic and a life-threatening illness, it’s publication day! A book thread. press.princeton.edu/books/ha…
1
3
56
8,126
11 Aug 2023
One of the great crimes of the decline of this platform is that research threads like this no longer get leverage. Read and share!
5
27
5,053
22 Jul 2023
I feel like everyone's slinking back to Twitter, head hung low
1
2
892
22 Jul 2023
Liveliest I've seen this place on a Friday night in six months, easily
3
806
11 Jul 2023
Please follow me so I can get these terrible Brands out of my feed threads.net/@epoppppp
1
5
1,101
11 Jul 2023
I just followed everyone who came up with this search on Twitter: url:"threads net" filter:follows
If you have, like, one follower or a locked account, sorry, don't mean to be creepy.
1
623
6 Jul 2023
does this mean I have to create a Threads account now
1
3
886
Beth Popp Berman (epopppp@bsky) retweeted

4 Jul 2023
A round-up of all the posts from our @legalhistory series on "Outside In: The Oral History of Guido Calabresi." Thanks to @alex_tzhang, José Argueta Funes, @k_redburn, Serena Mayeri, @narosenblum & Alison Gocke for participating! Thanks to @epopppp for helping inspire my posts.👇
4 Jul 2023

Conclusion: Legal Historians' Reflections on "Outside In: The Oral History of Guido Calabresi" dlvr.it/Srdrgk
4
5
3,401
1 Jul 2023
since everyone appears to be leaving again...
2
1,208
Beth Popp Berman (epopppp@bsky) retweeted

28 Jun 2023
I humbly present my Barbie-Oppenheimer 2024 electoral map

382
2,910
23,316
11,014,105
Beth Popp Berman (epopppp@bsky) retweeted

30 Jun 2023
Useful thread to return to
1
2
1,030
30 Jun 2023
The Supreme Court has lured me back here, which I will probably live to regret. But it's good to see you all.
3
21
1,181
30 Jun 2023
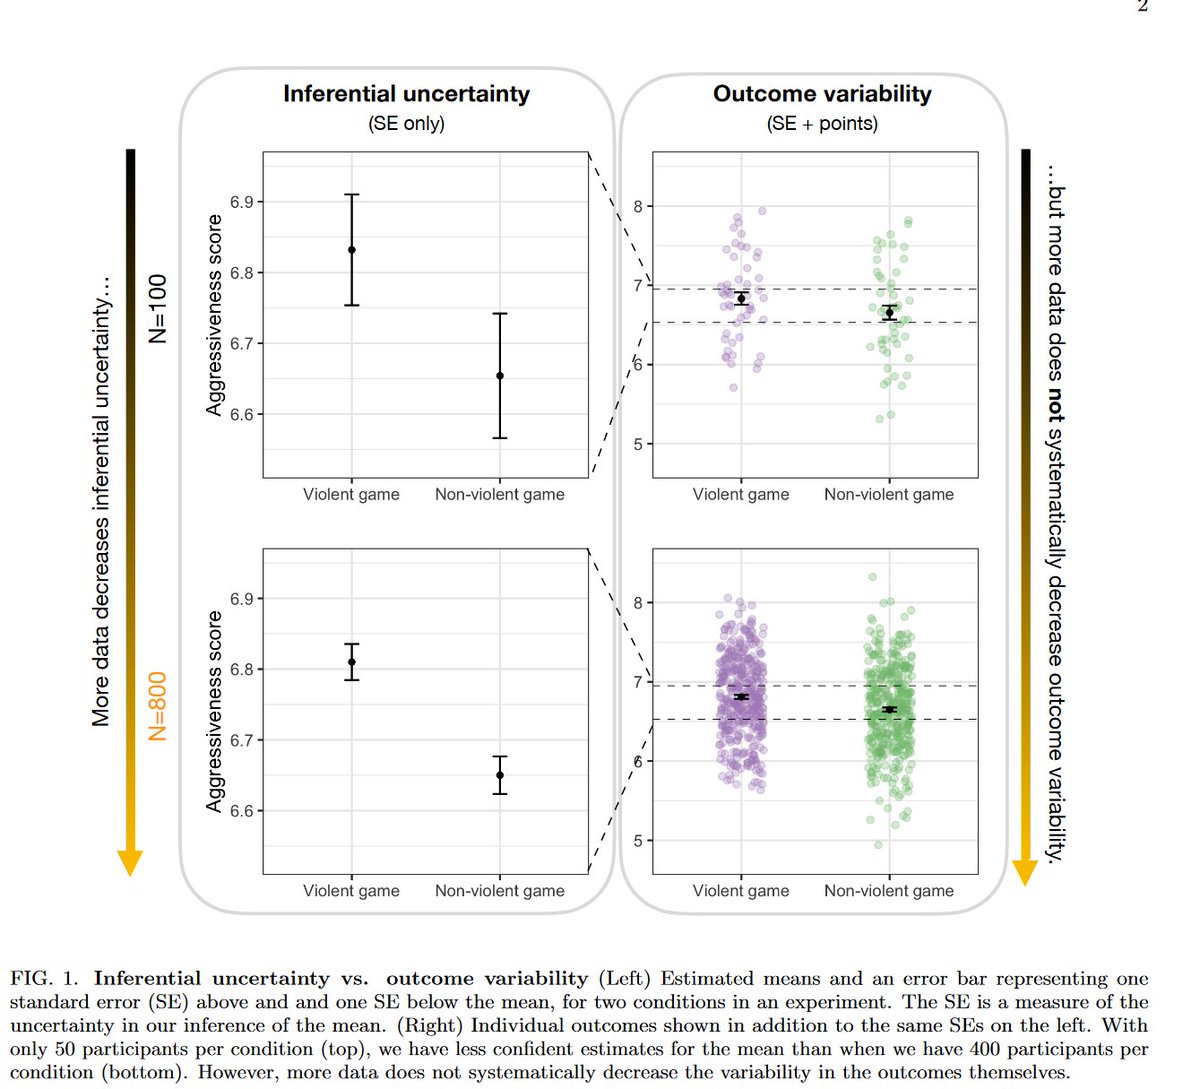
Really interesting paper. I wish people just understood what they were reading. But if adding variability produces more accurate interpretation of results (and doctors perform worst!), that seems really important.
29 Jun 2023

We are visualizing our data all wrong.
Typically, academic graphs show statistical confidence intervals or standard errors. This paper shows that everyone from doctors to tenured faculty misread these graphs, assuming effects are larger. Show variability! jakehofman.com/pdfs/illusion…

1
4
1,516
30 Jun 2023
Also, tenured faculty (in psych, soc, business, comp sci, physics, biology) outperform data scientists, which would not have been my guess.
1
488