
Nurturing coding and data talent through work experience
Joined June 2016
- Tweets 1,163
- Following 331
- Followers 343
- Likes 648
130 Photos and videos


2 Dec 2024
We have signed this petition today, to ask the government to protect social enterprises and charities from the new increases in National Insurance, which may affect our ability to grow.
chng.it/b2CBwfMmfb
1
19
17 Sep 2024
Connecting AWS Lambda and SES services securely with VPC Endpoint by @futureCodersSE link.medium.com/sFD54BVQXMb
1
32
18 May 2024
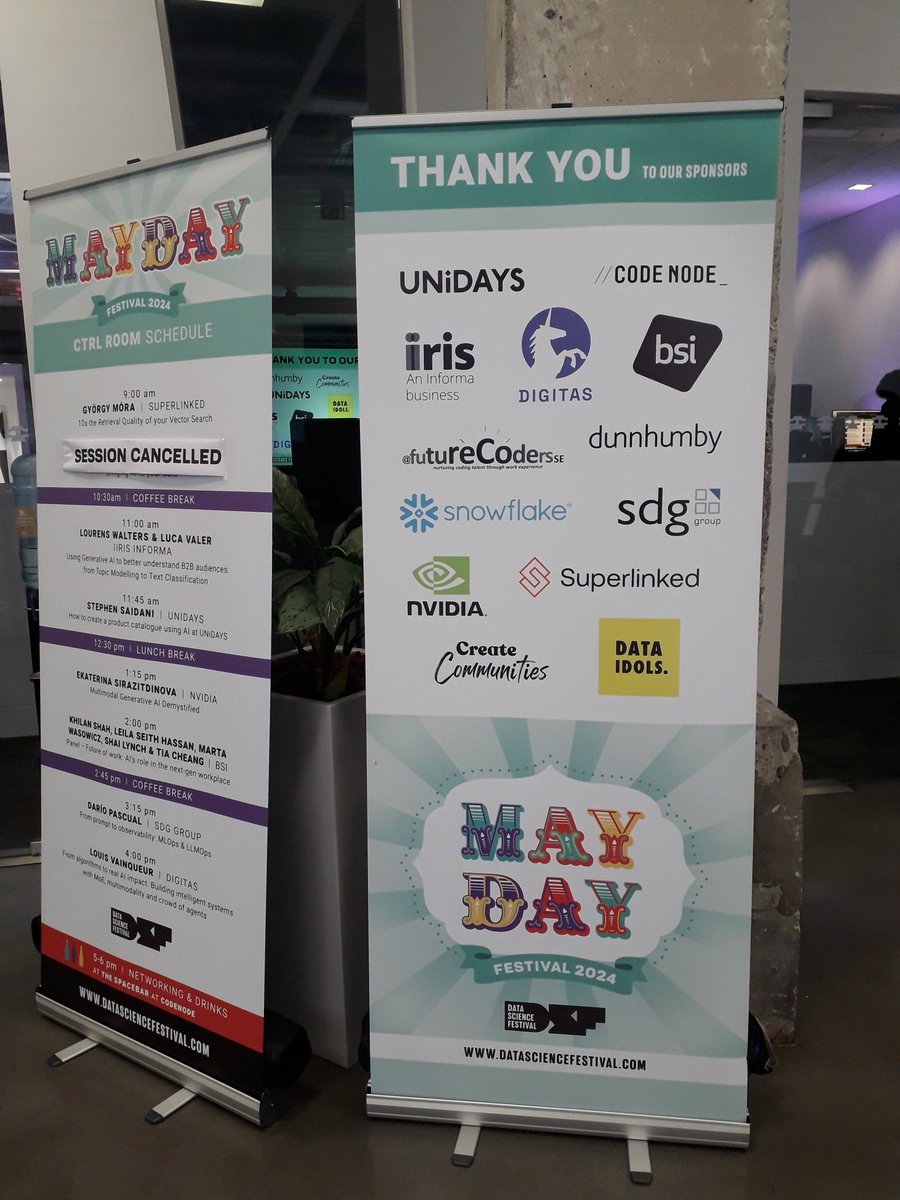
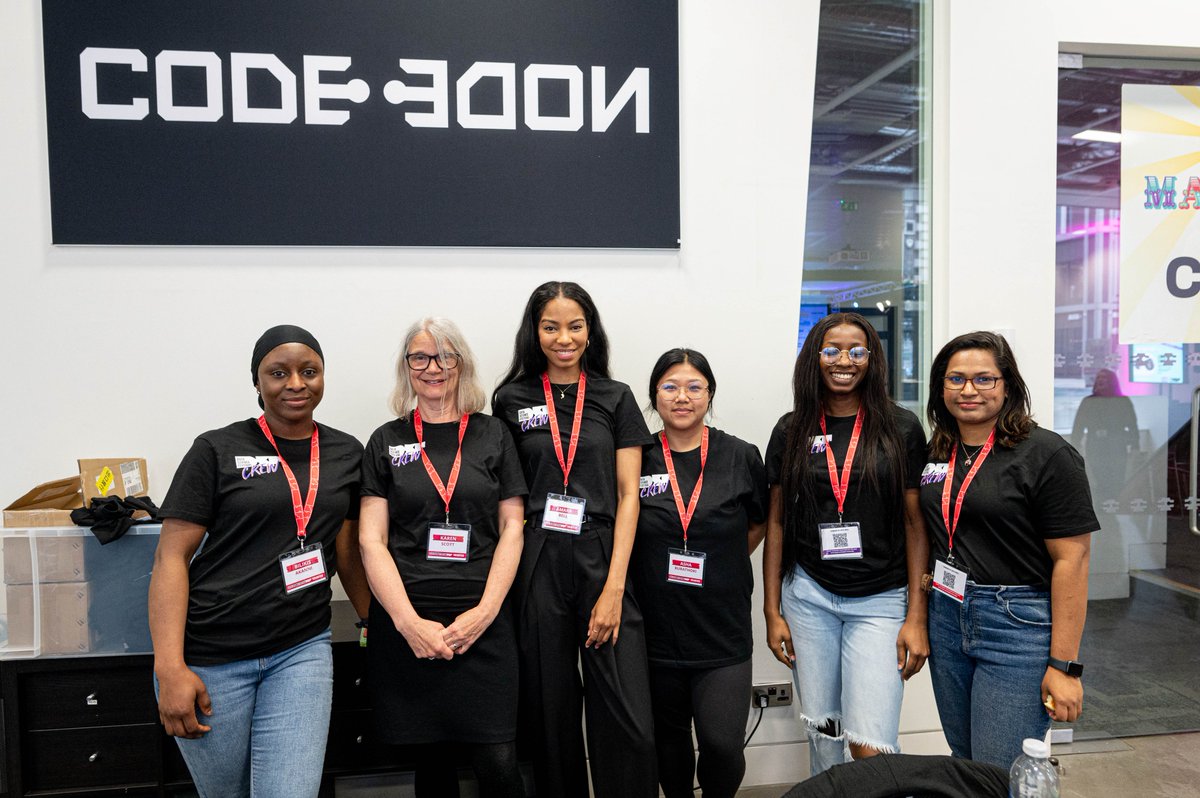
We're having a great day at the @datasciencefest #DSFmayday event, at Code Node. So great to be here, and amazing to find so many who want to help open opportunities for a wider, more diverse set of people.
1
40
futureCoders retweeted

24 Apr 2024
Look at this, how beautiful! I bet Anne would be delighted by this!
Another of #Medway's amazing heroes, who should be a household name, her parents may have owned a grocery shop on the site of the @halpernchatham.
You can learn more about Anne here
doverhistorian.com/2022/09/2…
24 Apr 2024

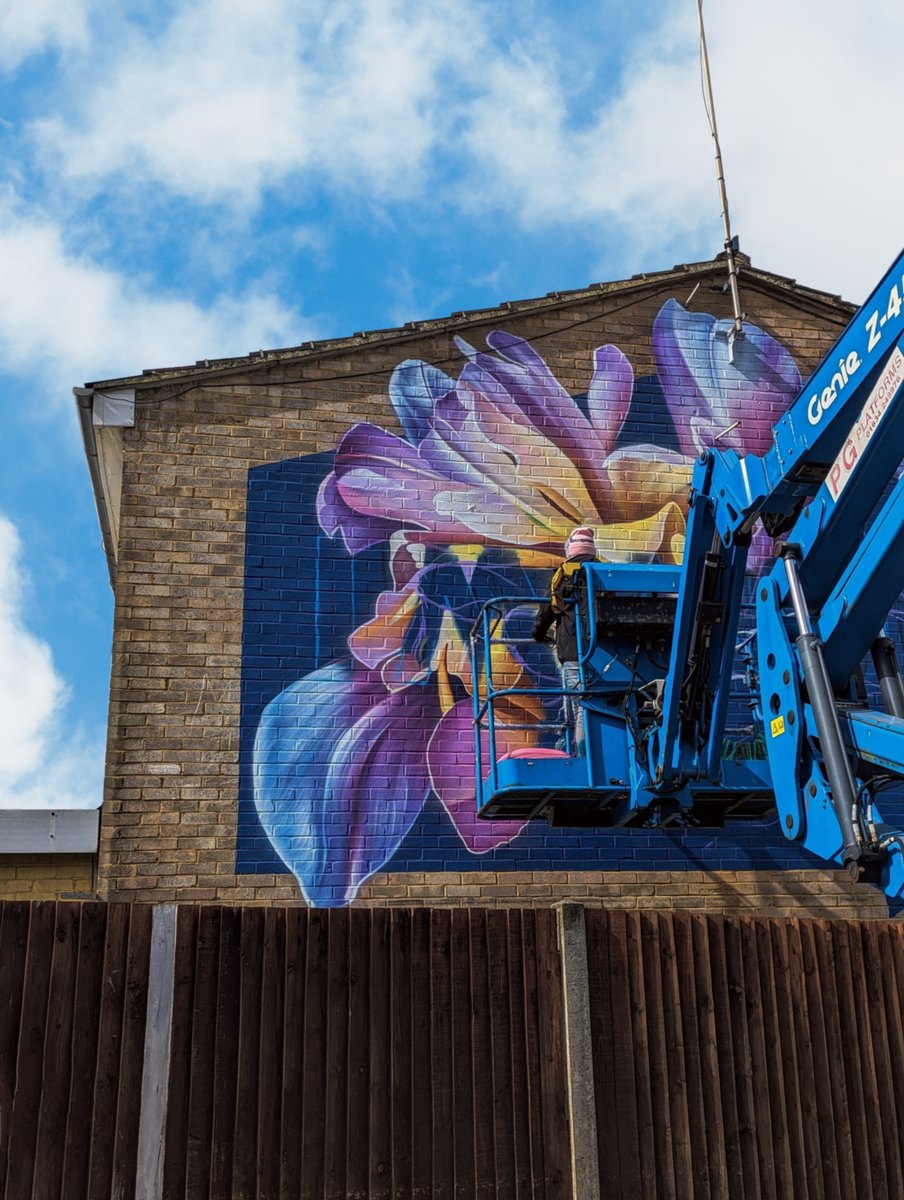
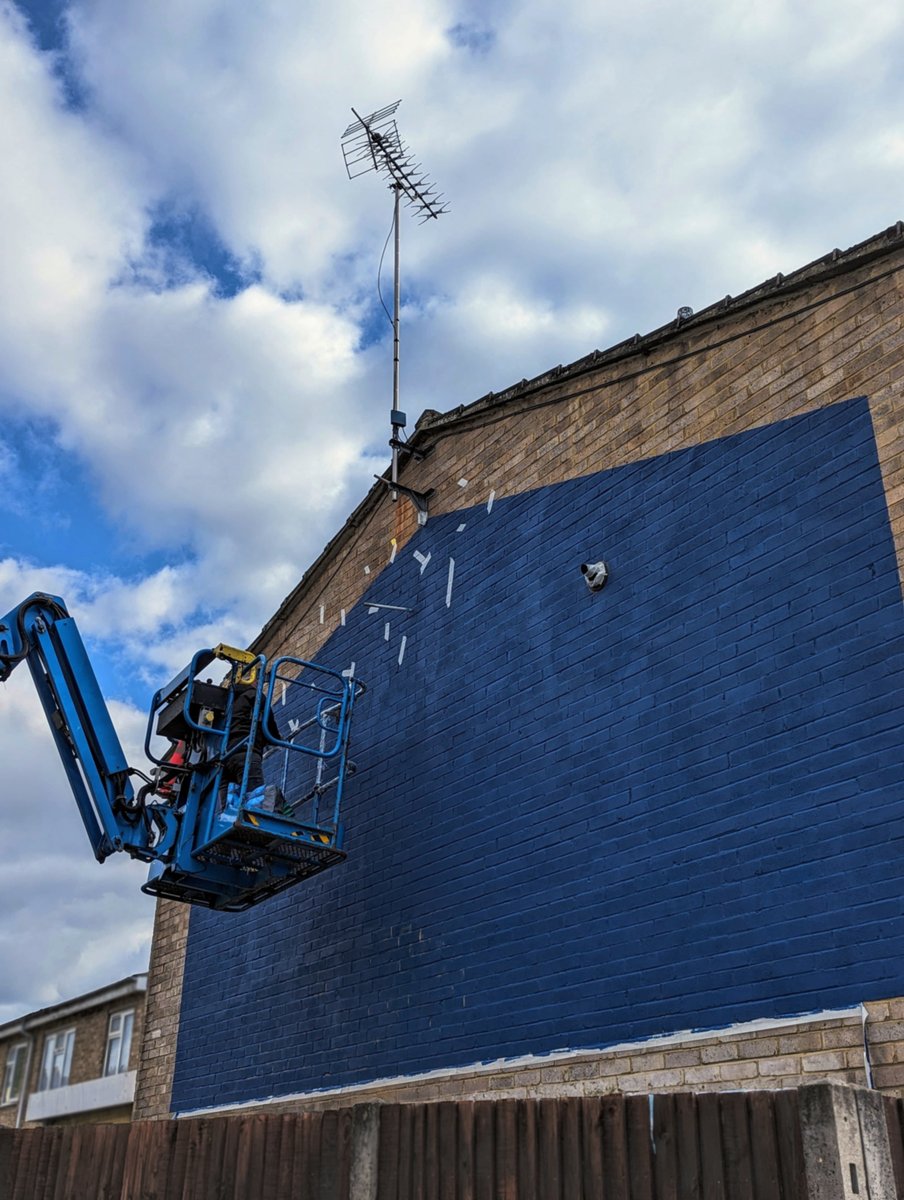
🌷 In our latest mural on Newnham Street, artist Sophie Mess takes inspiration from the incredible story of Luton resident Anne Pratt (1806-1893).
👀 Look out for our next mural in Chatham in 8 weeks!
ℹ️ Find out more: archeslocal.org.uk/anne-prat…

2
4
504
futureCoders retweeted

12 Mar 2024
Thank you @TNLComFund for providing us with funding to purchase a new vehicle which will enable us to increase the number of participants accessing our sessions and also the range of skills that we can deliver as we shall be able to carry more equipment.
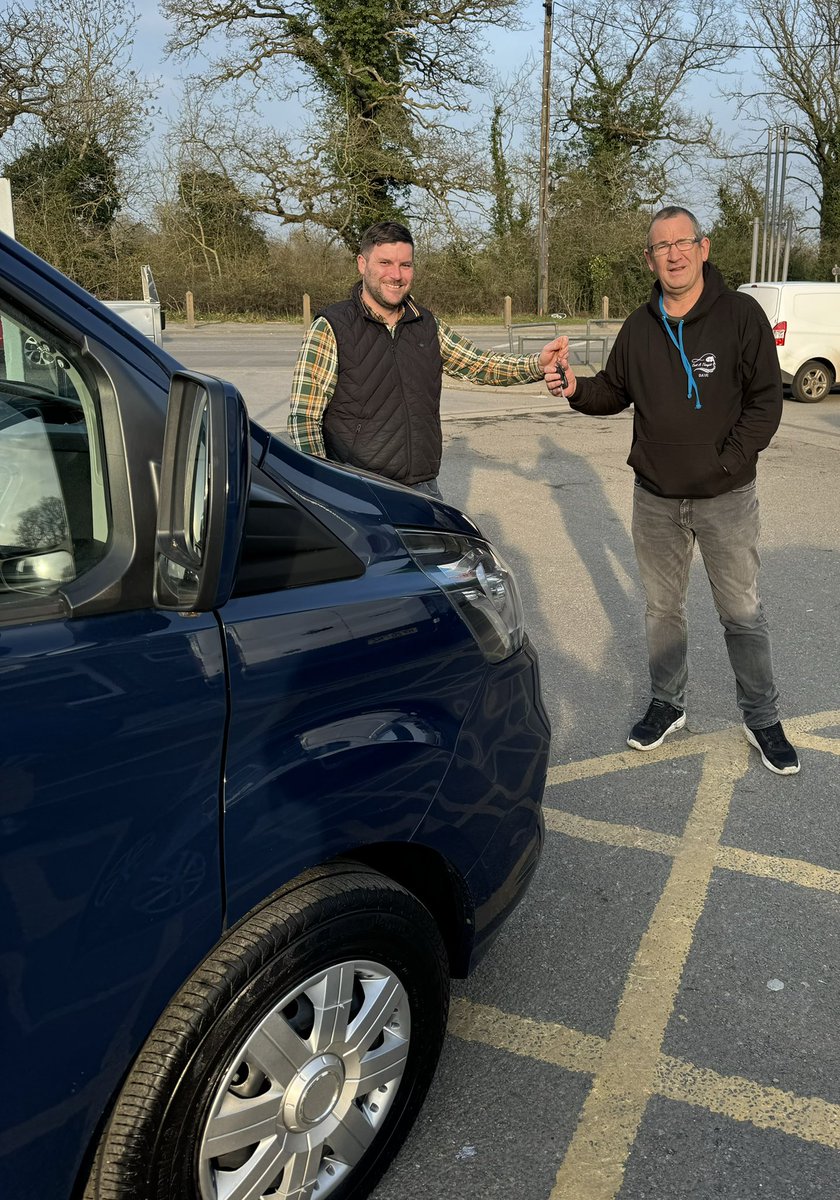
12 Mar 2024

Exciting funding news!📢
Thanks to #NationalLottery players, we've awarded just under £118m to almost 2,400 community groups across England in the last quarter.
Find out how National Lottery funding is being used to strengthen society & improve lives. ⬇️
ow.ly/Z2j750QQWXR
1
2
52
8 Mar 2024
Great to see that energydashboard.co.uk/live now have an API data service available, with reduced subscription for students and researchers. #energy #data
1
20
19 Jan 2024
Looking forward to the next set of workshops using data from the last census about Medway to paint a different picture.
19 Jan 2024

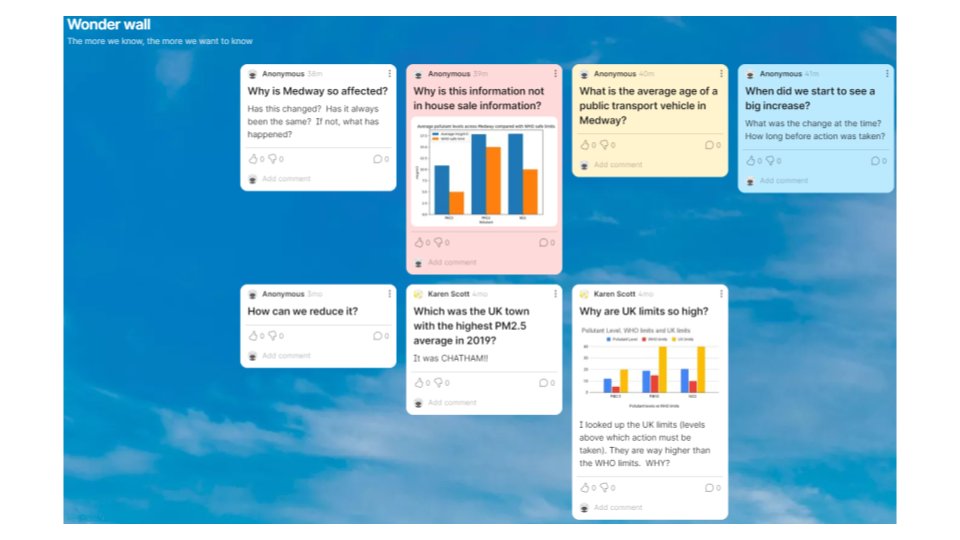
This ‘story’ raised some questions, which we posted on our Padlet Wonder wall
18
19 Jan 2024
This ‘story’ raised some questions, which we posted on our Padlet Wonder wall
19 Jan 2024
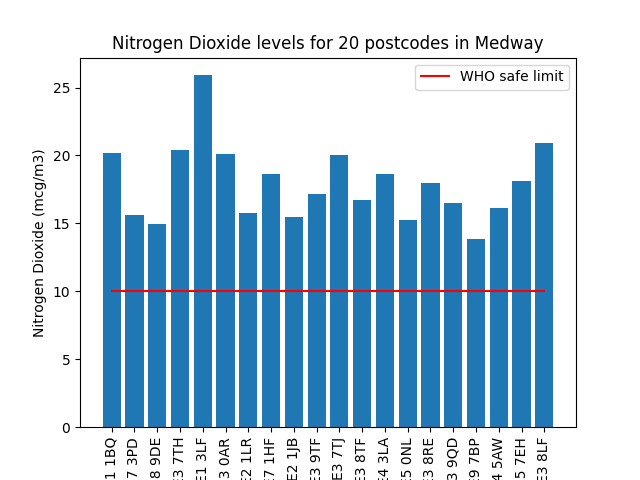
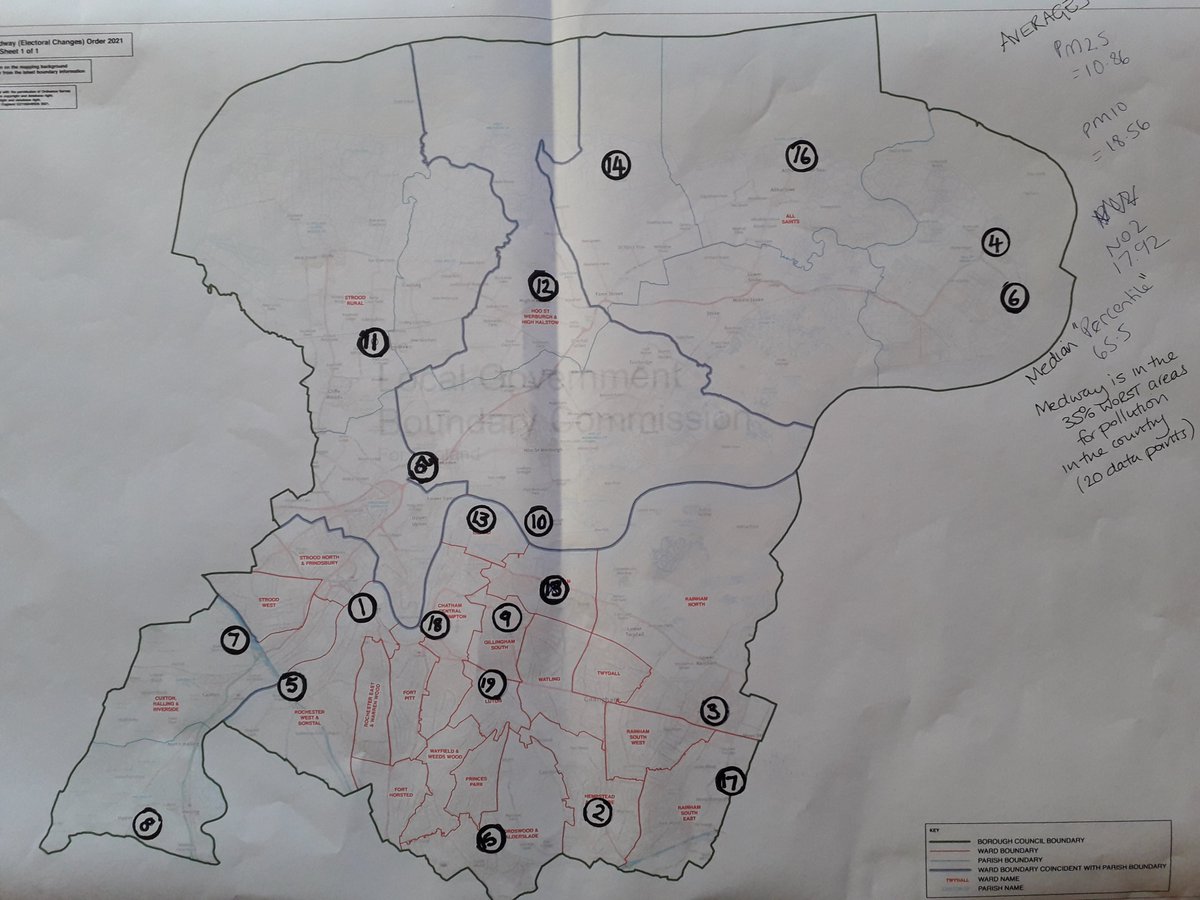
We entered the data into some analysis software and found out what the average levels of each of the pollutants are across Medway (calculated from the data we collected), and we chose to create an infographic showing the different levels of Nitrogen Dioxide collected.
26
19 Jan 2024
We entered the data into some analysis software and found out what the average levels of each of the pollutants are across Medway (calculated from the data we collected), and we chose to create an infographic showing the different levels of Nitrogen Dioxide collected.
19 Jan 2024
We discussed where we can get air pollution data and what the data means. We collected data on levels of 3 types of air pollution (Nitrogen Dioxide and Particulate Matter PM2.5 and PM10)
23
19 Jan 2024
We discussed where we can get air pollution data and what the data means. We collected data on levels of 3 types of air pollution (Nitrogen Dioxide and Particulate Matter PM2.5 and PM10)
19 Jan 2024
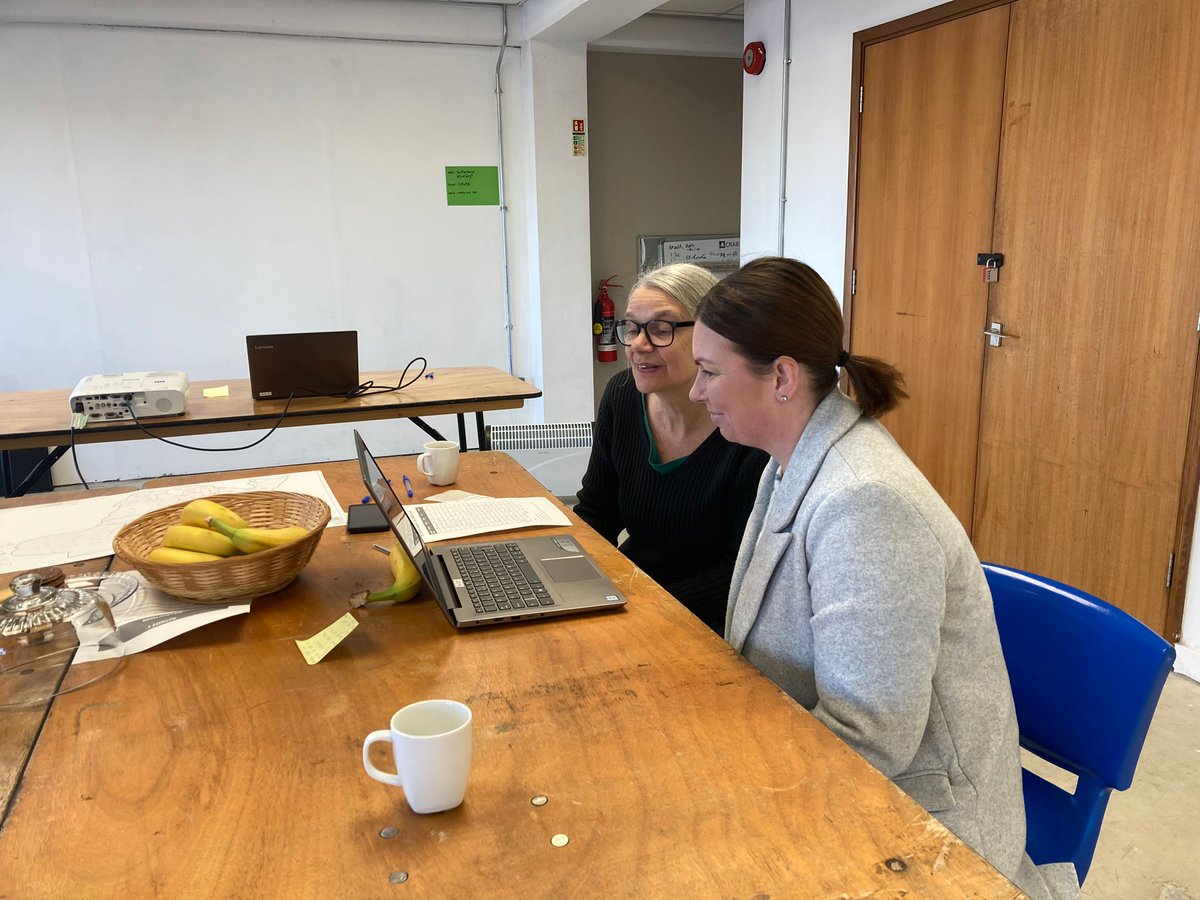
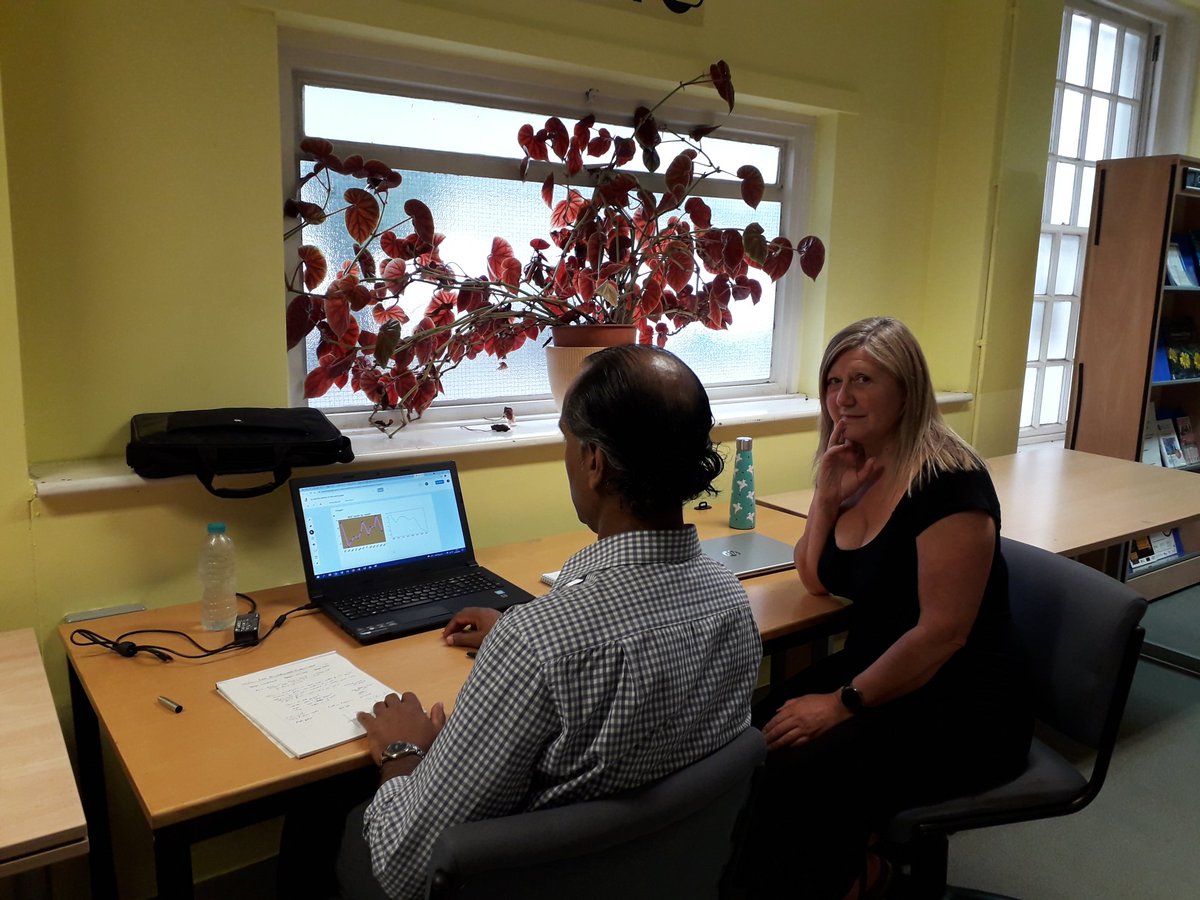
We have tested our data workshop format!! This week we ran our first ‘data’ workshop to test the format, identify any problems and make sure that we have the best possible experience ready for the first group of learners.
1
28
19 Jan 2024
Thank you to Kirstin for event management, Kerry for dyslexia/dyscalculia support, Karen for tutoring and Kayleigh for being our ‘pioneer’! Also thanks to @SunPierHouse for some great space overlooking the river.
8
19 Jan 2024
We have tested our data workshop format!! This week we ran our first ‘data’ workshop to test the format, identify any problems and make sure that we have the best possible experience ready for the first group of learners.
31
8 Nov 2023
8 Nov 2023
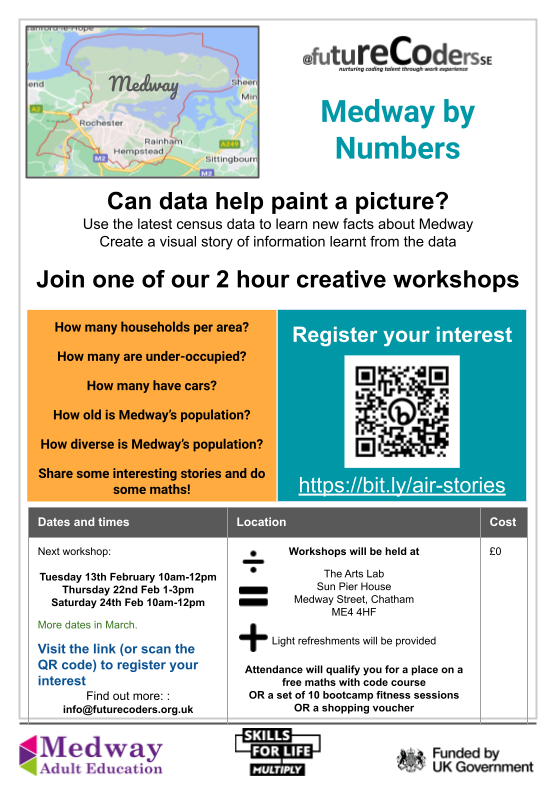
Use numbers to tell a story about air pollution in Medway. Workshops for Medway adults who have struggled with maths futurecoders-se.cademy.co.uk… Please share.
13
8 Nov 2023
Use numbers to tell a story about air pollution in Medway. Workshops for Medway adults who have struggled with maths futurecoders-se.cademy.co.uk… Please share.
26
futureCoders retweeted
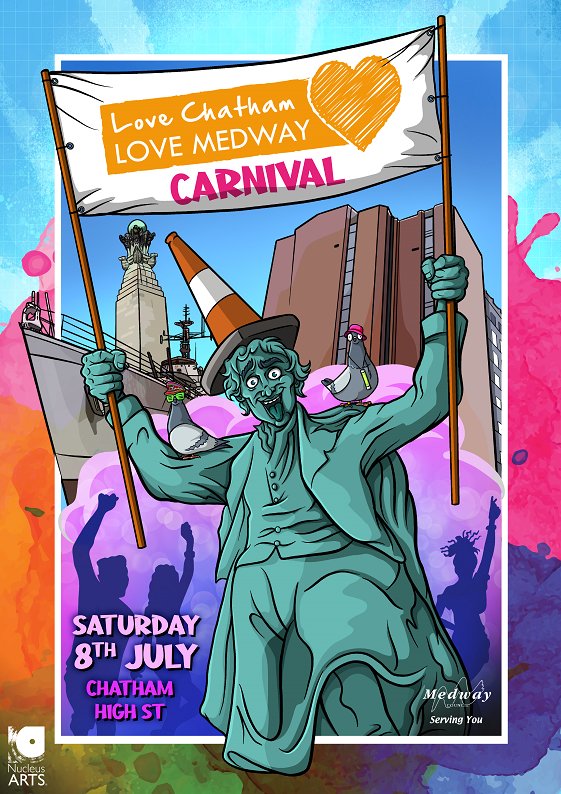
8 Jul 2023
Today is the the day! Join us for #ChathamCarnival2023 from 10am in Chatham High Street for the biggest FREE party in #Medway
1
6
15
2,663
futureCoders retweeted

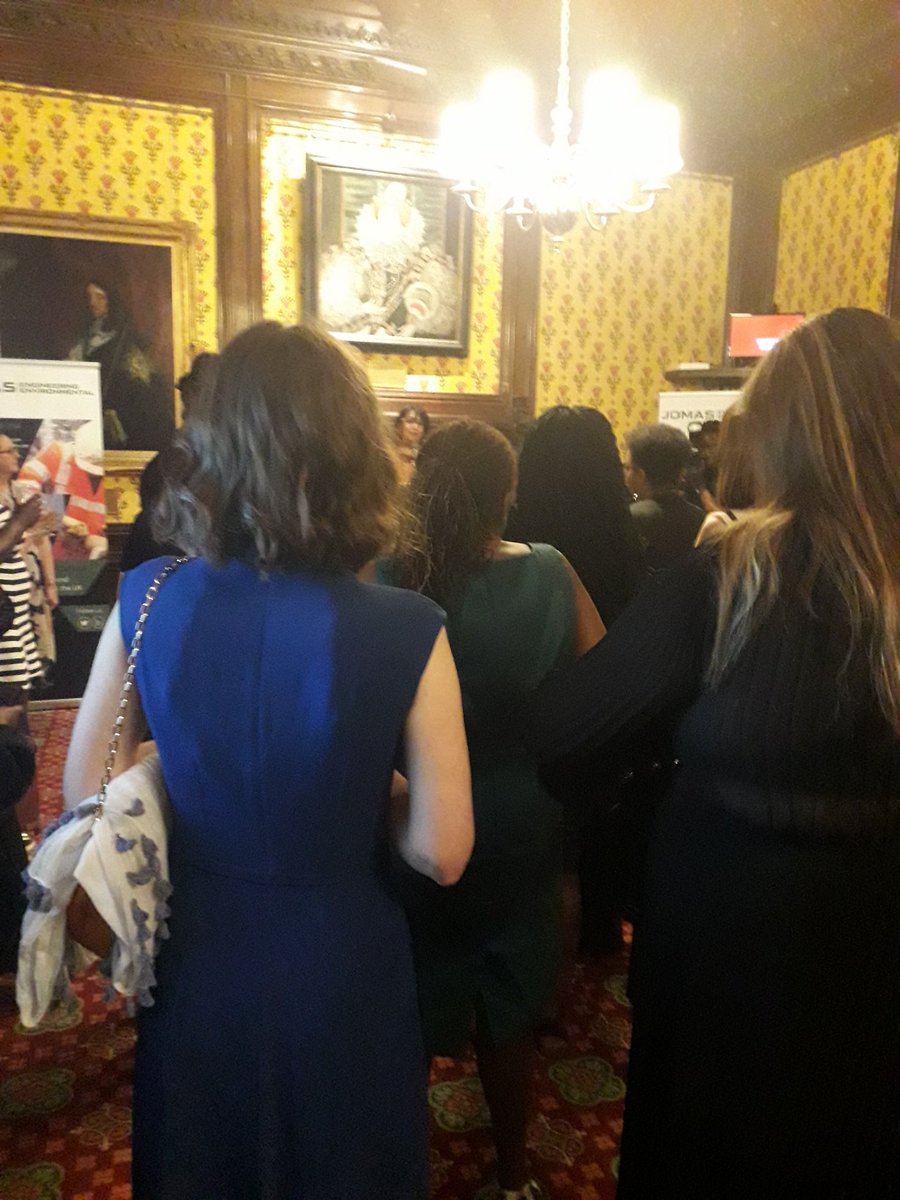
22 Jun 2023
Really inspired by women at the Inspirational Women in STEM and Construction awards. Interesting discussion around improving education opportunities, relatable role models and creating opportunities to inspire and encourage in a range of careers. @businessstem #IBWISC2023
2
3
151
futureCoders retweeted

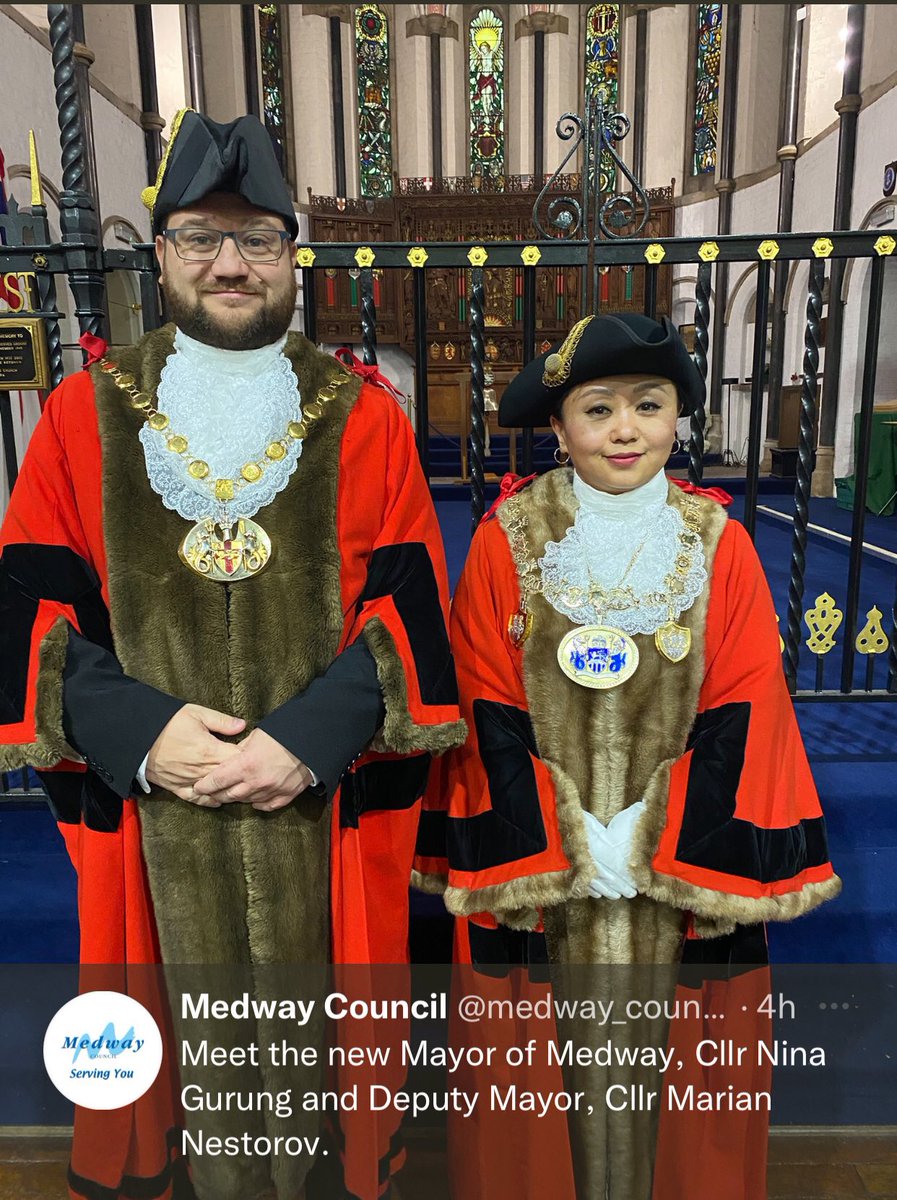
Extremely honoured and privileged to have been elected as the Mayor of Medway 2023-24, the UK’s first female Gurkha Nepalese Mayor and Medway’s first female Mayor from BME groups. @MZA1134 Cllr Marian Nestorov will make a great Deputy Mayor. #ProudToBeMedway
14
29
144
10,671
25 May 2023
In a group of data focused female volunteers, I love that I may be challenging any perceptions about age. The @datasciencefest was a great event again this year. #data #talks
20
futureCoders retweeted
17 May 2023
Happy #IDAHOBIT (International Day Against Homophobia, Biphobia and Transphobia)! I'm so proud to work @nucleusarts where everyone is welcome!
1
1
94