
Joined December 2014
- Tweets 537
- Following 127
- Followers 42
- Likes 23
247 Photos and videos


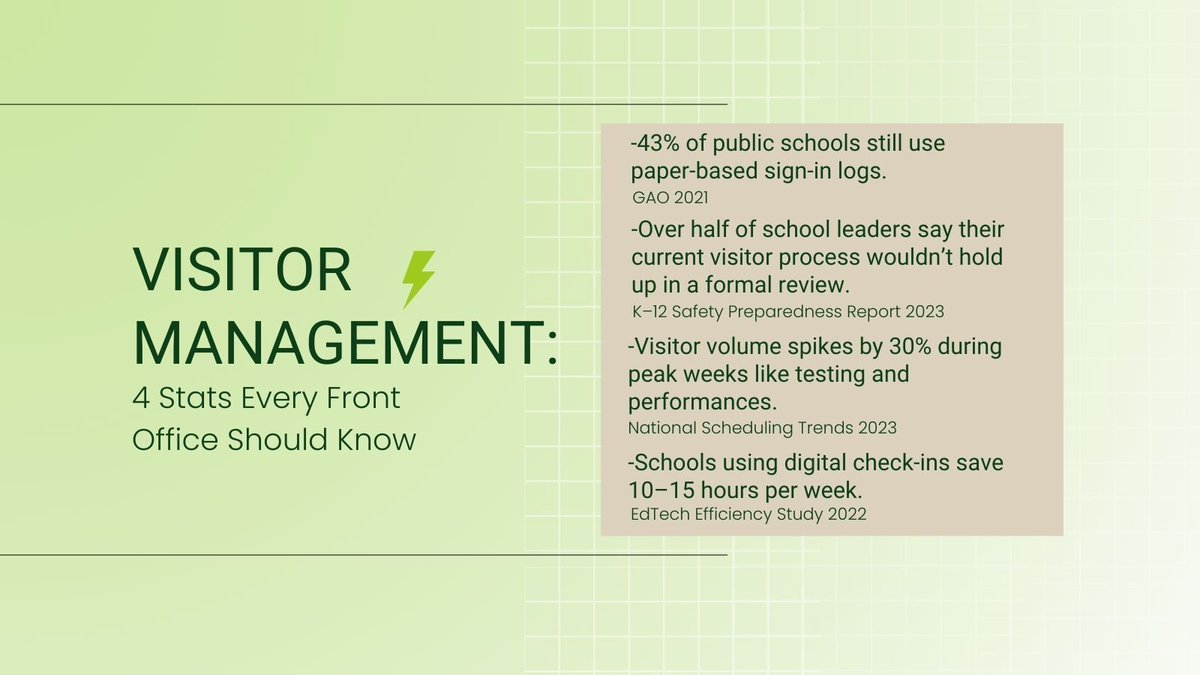


As schools wrap up the year, many teams are already looking ahead.
1
What patterns emerged?
Where was instructional time lost?
What changed over the course of the year?
1
Sometimes the most valuable insights only become visible when you zoom out.
#K12 #EdTech #SchoolLeadership
8

May 31
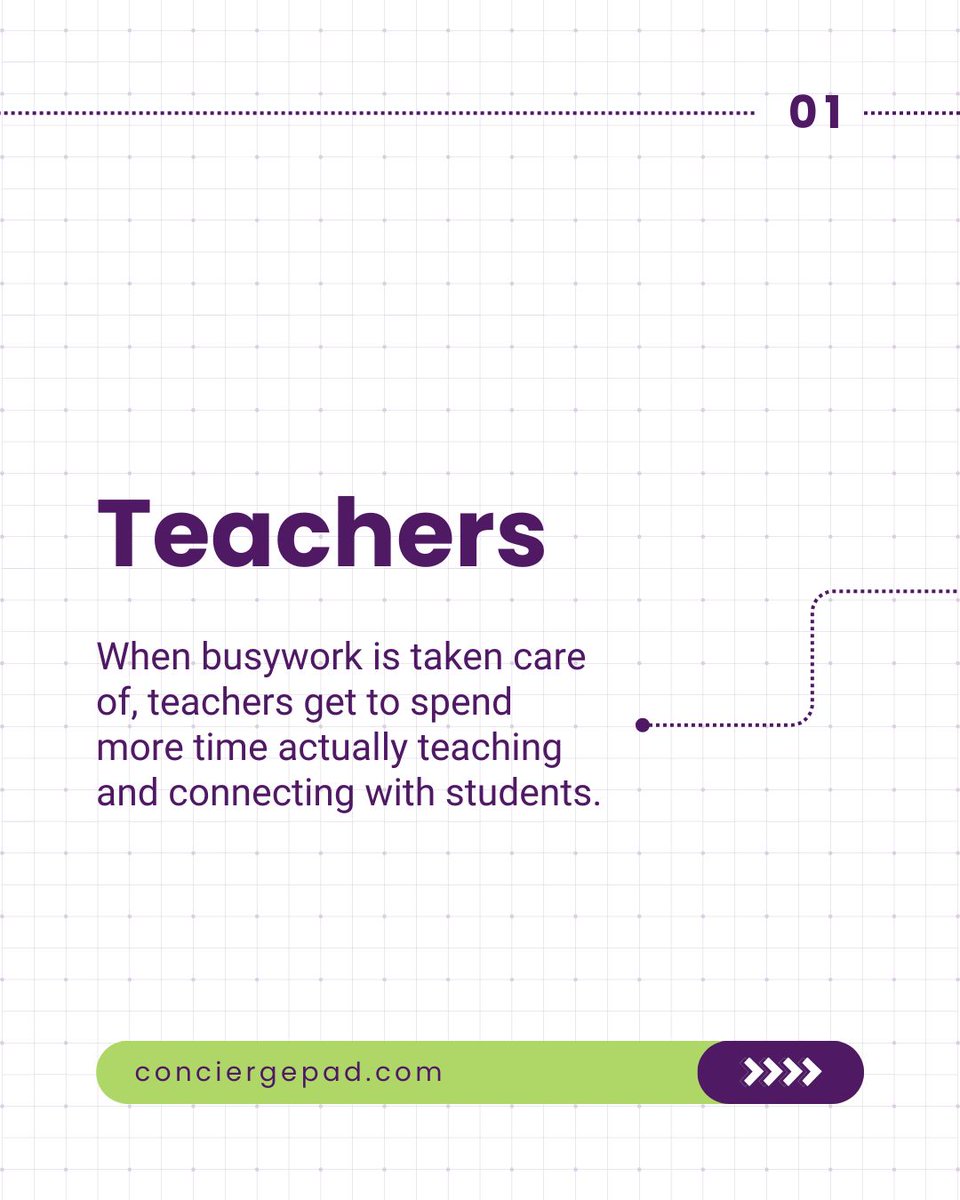
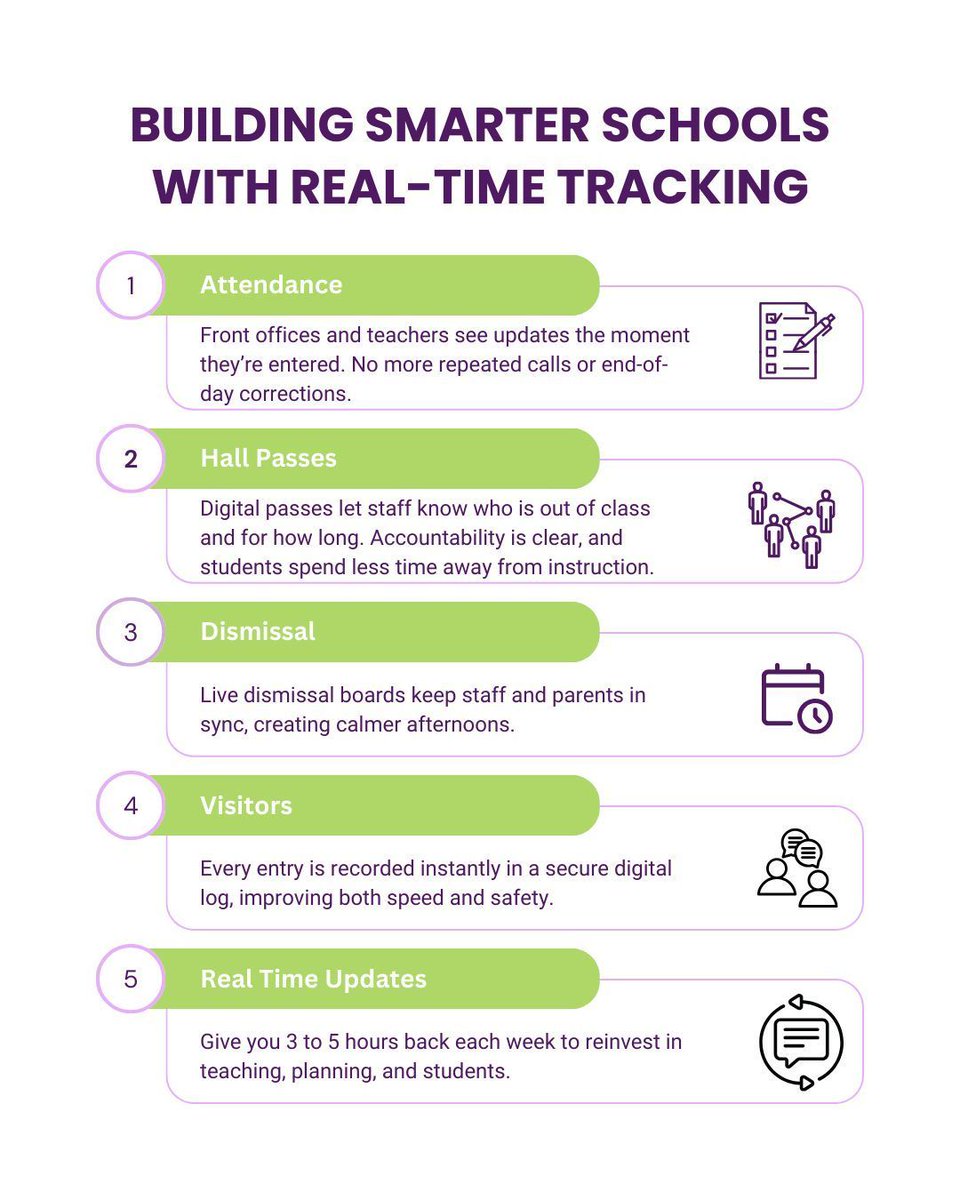
Behind every number is a front office that did not have to do anything manually.
1
2
May 24
A single tardy doesn’t tell you much. Thirty tardies across four students in the same first period class, tracked over eight weeks, tells you something is wrong before it becomes a discipline problem.
1
11
May 24
Schools that track consistently tend to have that ready because the log exists whether or not anyone planned to reference it later.
1
1
May 24
Running behavior tracking through the same iPad already in use for daily operations keeps that documentation ready. The log exists because creating it wasn’t a separate task.
5
May 15
80% of teachers say they deal with behavioral problems at least once a day. Most schools are tracking it after the fact.
1
5
May 15
Schools lose up to 20 instructional days a year to classroom interruptions. A lot of that starts with who’s out of class and for how long.
1
1
May 15
Hall pass data and behavior logs tell the same story. The schools that see it earliest are the ones connecting both.
8
Most K-12 visitor screening stops at one registry. One list, one category of risk.
1
5
40,000 records, cross-referenced at check-in in under a second.
1
3
It runs on a proprietary threat database available exclusively to ConciergePad customers. The standard registry isn’t going anywhere. We just didn’t think it should be the only layer.
2