
Joined December 2024
- Tweets 151
- Following 10
- Followers 6,476
- Likes 5
42 Photos and videos


Pinned Tweet

Mar 29
See how one trade made $2K in 15 minutes
👉 getphantomflow.com/watch
6
9
66
57,332
Mar 11
Here's why trading less often leads to better results:
Every setup has a quality score — even if you've never thought of it that way.
High-quality setup: trend confirmed, key level present, multiple signals agree, risk is clearly defined.
Low-quality setup: one signal, unclear level, you're just "feeling it."
The more setups you force, the lower the average quality. And lower quality = lower expected returns.
3 A setups a week beats 20 mediocre ones every time.
23
6
48
32,864
Mar 11
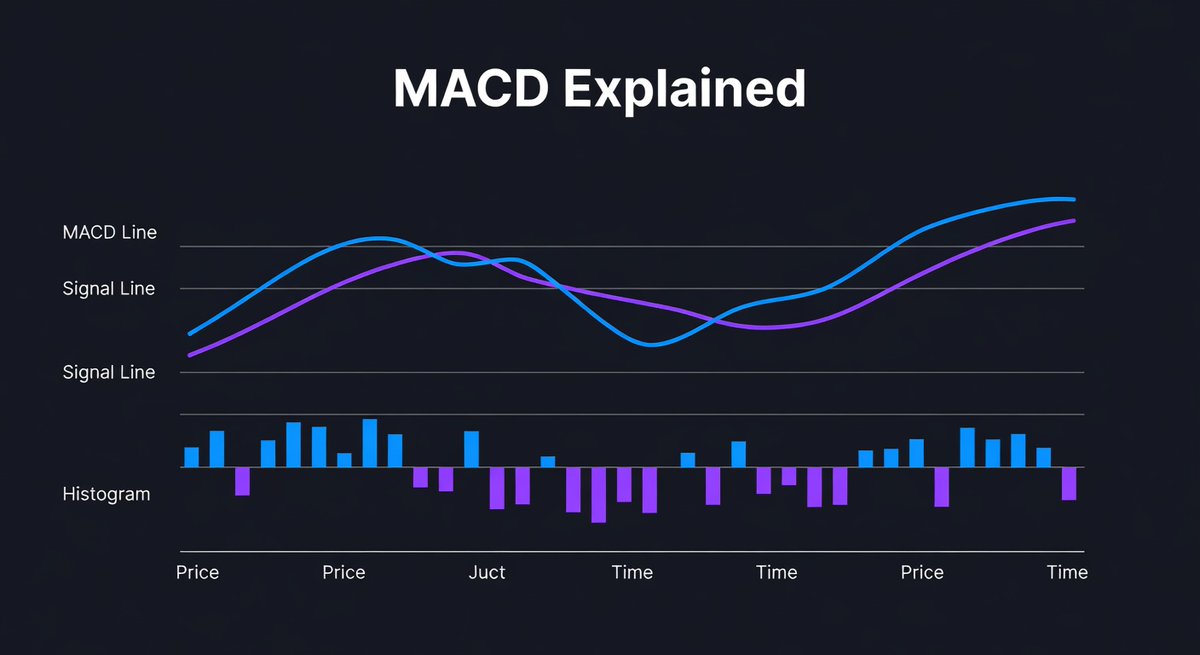
MACD is one of the most popular indicators out there - but most people don't actually know what it's measuring.
Here's the simple version:
MACD = the gap between a fast moving average (12-period) and a slow one (26-period).
When the MACD line crosses above the signal line, momentum is shifting up.
When it crosses below, momentum is shifting down.
The histogram just shows you how wide or narrow that gap is.
It's not a buy or sell signal on its own. It's a momentum gauge. Context matters.
7
14
104
23,951
Mar 9
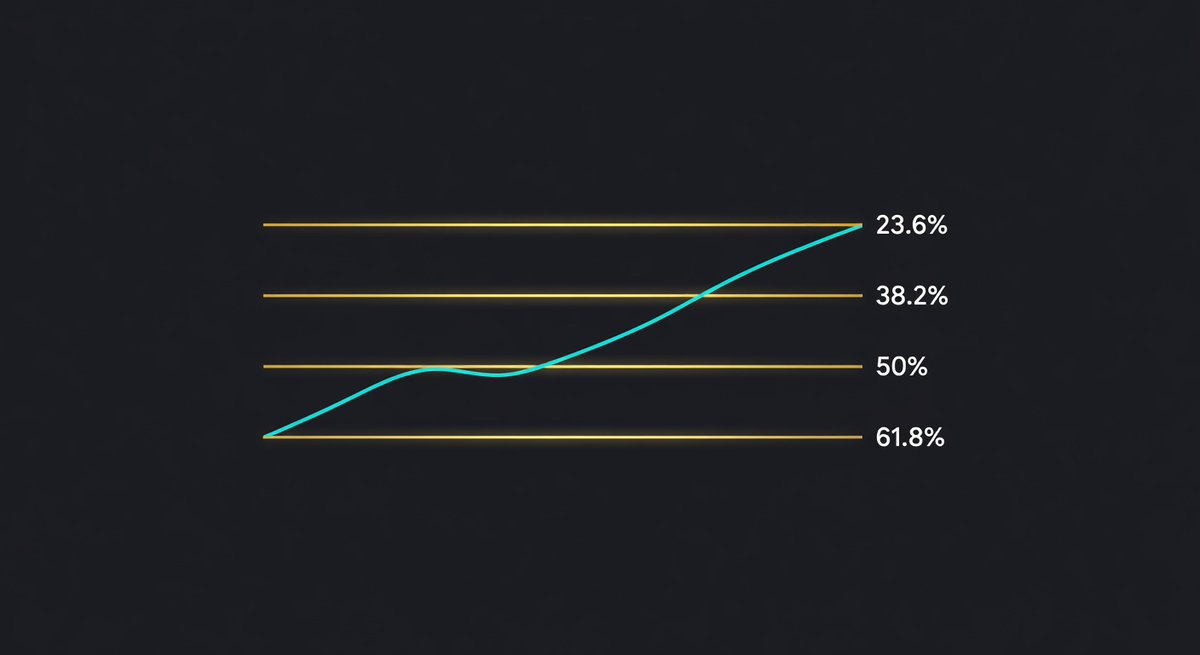
Fibonacci retracements sound complicated. Here's how they actually work.
When price makes a big move, it rarely goes straight. It pauses, pulls back, then continues.
Fibonacci levels mark the most common pullback zones: 23.6%, 38.2%, 50%, 61.8%.
Why those numbers? They come from the Fibonacci sequence — a pattern found throughout nature and, interestingly, in markets too.
The 61.8% level (the “golden ratio”) is the one traders watch most closely. Price tends to find support or resistance right there before resuming the move.
It’s not magic. It’s just where a lot of traders have their orders.
2
8
69
19,756
Mar 8
Most traders discover economic calendars after a surprise move wipes their trade.
Here's how to use one before that happens:
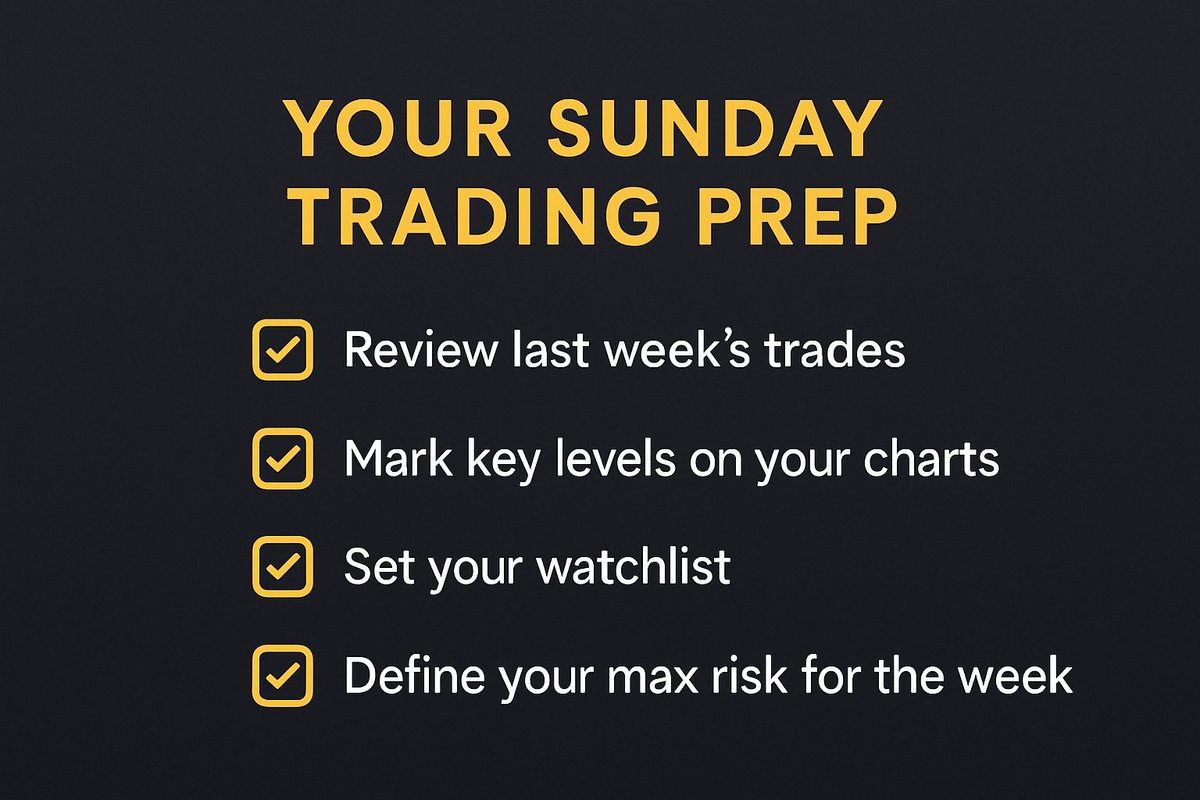
Every Sunday, check the week's high-impact events — CPI, NFP, rate decisions, GDP.
Those are the moments when spreads widen, volatility spikes, and your stop gets hit regardless of your setup.
You don't need to trade the news. You just need to know when it's coming.
1
4
28
16,815
Mar 8
There are 3 main ways to trade. Most beginners don't realize they're choosing between them.
Scalping — in and out in minutes. Dozens of trades a day. Needs constant attention and fast execution.
Swing trading — hold for a few hours to a few days. Fewer decisions, but patience required.
Position trading — hold for weeks or months. Based on the bigger picture. Closest to investing.
None of them is better. The best one is the one that fits how you actually want to live.
2
5
49
13,183
Mar 8
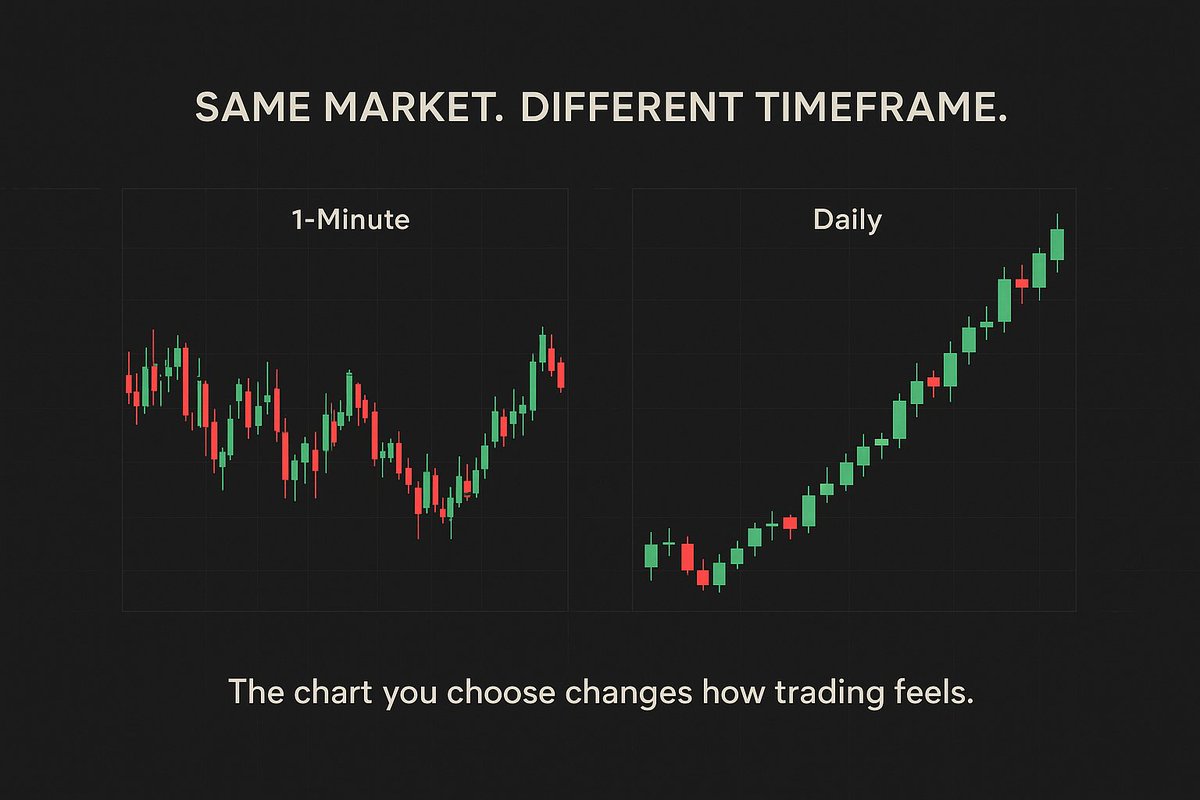
Before you enter any trade, check what the higher timeframe is doing.
If the daily chart is in a clear downtrend, taking long trades on the 15-minute chart is swimming against the current. You might win a few — but you're fighting the bigger picture.
Higher timeframe = the direction of the river. Lower timeframe = where you look for your entry.
Trade with the flow, not against it.
10
46
11,488
Mar 8
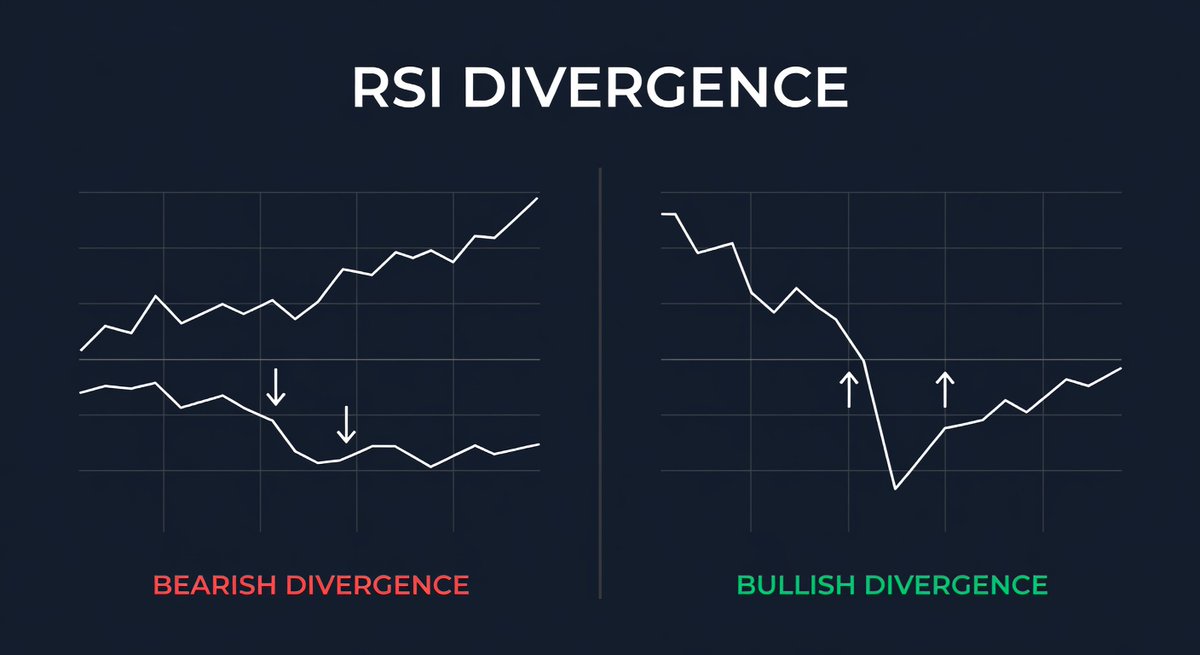
RSI divergence is one of those concepts that sounds complicated but is actually pretty intuitive.
When price makes a new high but RSI makes a lower high — the momentum behind the move is fading. That's bearish divergence.
When price makes a new low but RSI makes a higher low — selling pressure is weakening. That's bullish divergence.
Price can keep going for a while. But divergence is the market whispering: this move might not have much left.
5
39
10,805
Mar 7
Confirmation bias is one of the sneakiest trading mistakes.
You have a gut feeling price is going up. So you start looking for reasons to go long — and ignoring everything pointing the other way.
The chart didn't tell you to buy. You decided to buy, then asked the chart to agree.
Before every trade: actively look for reasons NOT to enter. If you can't find any, that's when you have real conviction.
4
23
9,007
Mar 7
Hold a forex trade past midnight and something happens that most beginners don't know about: you either earn or pay a small fee called a swap (or rollover).
It's based on the interest rate difference between the two currencies you're trading.
Some pairs pay you to hold. Others charge you. It's small — but on bigger positions or longer holds, it adds up.
Worth knowing before you leave a trade open overnight.
8
8,268
Mar 6
"Pip" sounds like jargon. Here's what it actually means:
A pip is the smallest standard price movement in forex.
EUR/USD moves from 1.0835 to 1.0836? That's 1 pip.
JPY pairs: USD/JPY moves from 148.50 to 148.51? Also 1 pip.
Why it matters: pip value tells you exactly how much you made (or lost).
Standard lot → ~$10 per pip
Mini lot → ~$1 per pip
Micro lot → ~$0.10 per pip
Risk 20 pips on a standard lot = $200 at stake.
Now you can actually size your positions."
1
14
7,632
Mar 5
Most traders use fixed stops. A trailing stop is different.
Instead of staying at one price, it moves with you as the trade goes in your favor — and locks in at the highest point reached.
Price rises $0.50? Your stop rises $0.50. If price then reverses, the stop holds and exits you automatically.
You never have to decide when to take profit. The trade manages itself.
4
25
7,100
Mar 5
Slippage is why your trade fills at a different price than you expected.
Here's when it happens: you place a market order, but by the time it processes, price has already moved.
It's most common during news releases and low-liquidity hours. A $0.10 slip per trade might seem small — but it stacks up fast if you're trading daily.
Limit orders eliminate slippage. The tradeoff: you might not get filled at all.
6
6,104
Mar 5
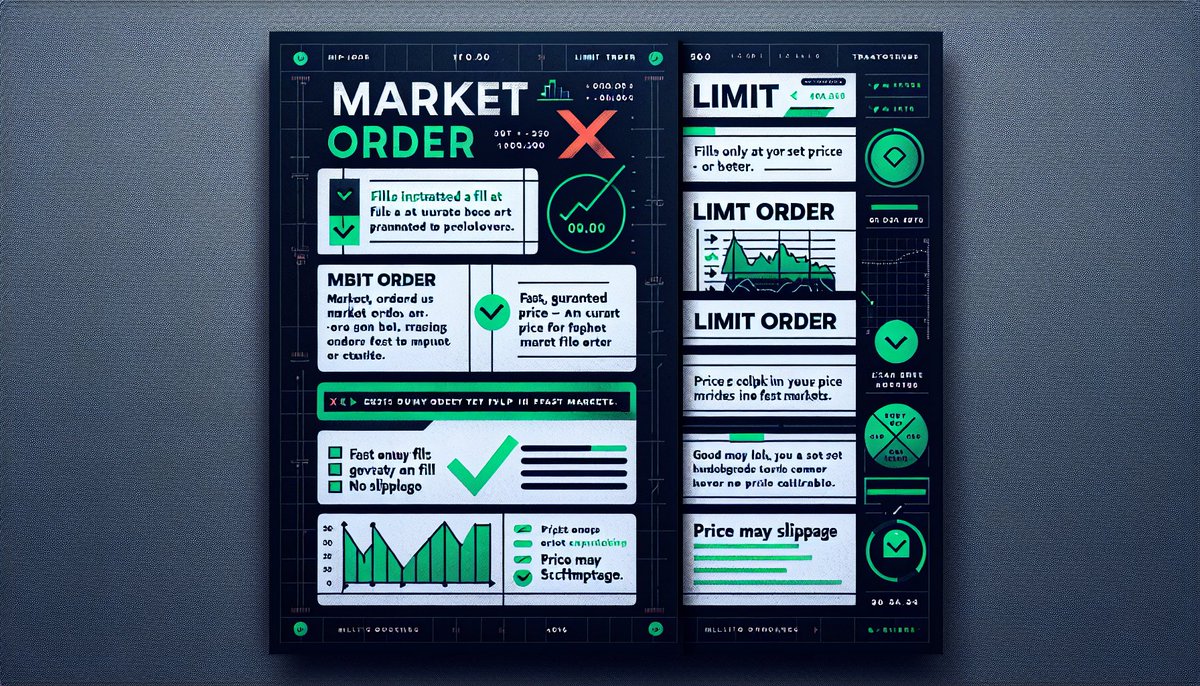
There are two ways to enter any trade. Most beginners only know one.
Market order — fills immediately at whatever the current price is. Fast. Guaranteed. But in a fast-moving market, you might not get the price you saw.
Limit order — fills only at your specified price or better. You get control over your entry. The tradeoff: it might not fill at all if price never reaches your level.
Neither is 'better.' It depends on the setup. Big news move? Market order. Planned entry at a key level? Limit order.
Knowing when to use each one is a small edge most traders skip over.
1
15
5,411
Mar 3
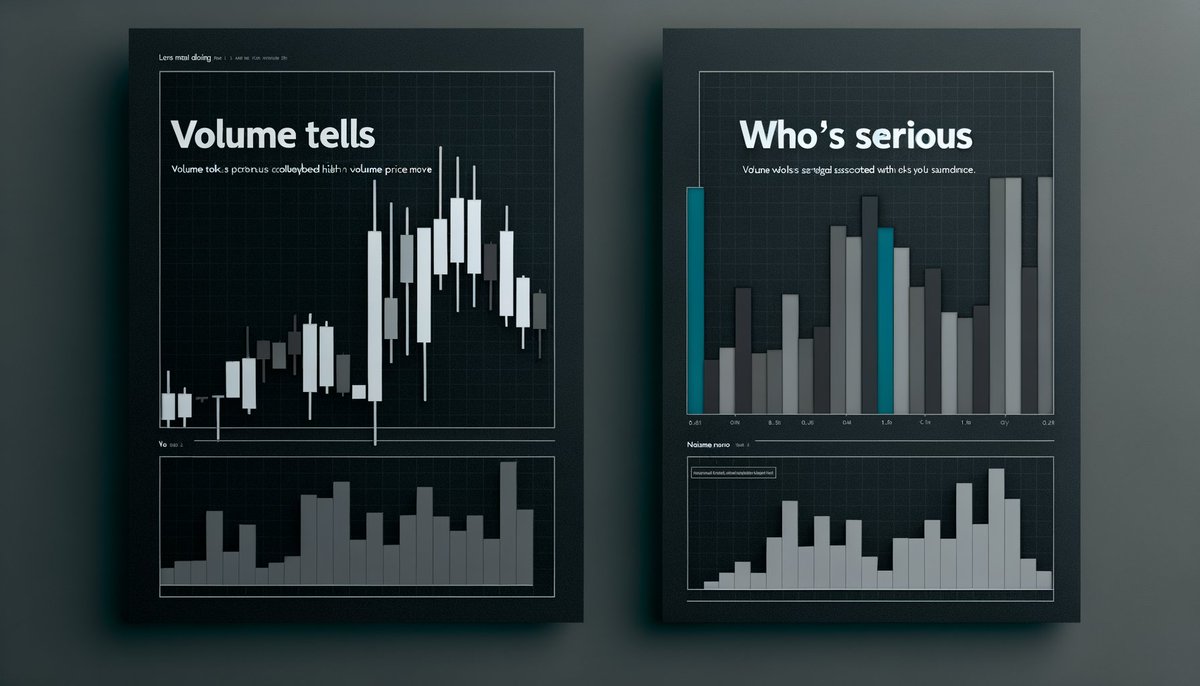
Volume is one of the most overlooked tools on a chart.
When price makes a big move on high volume, that's real — institutions are involved.
When price moves on low volume, it's often just noise. A fake-out waiting to happen.
Big move low volume = be skeptical. Big move high volume = pay attention.
4
18
4,843
Mar 2
Two market conditions every trader needs to know:
Trending — price makes higher highs and higher lows (uptrend), or lower lows and lower highs (downtrend). Momentum strategies work well here.
Ranging — price bounces between two levels without going anywhere. Breakout strategies fail here. Mean reversion wins.
Most losing trades happen from using the wrong approach for the wrong condition.
7
4,213
Mar 2
Ever wonder why price spikes below a key level and then immediately reverses?
That's a stop hunt.
Large players know where retail traders put their stops — just below support, just above resistance. They push price into those zones, trigger the stops, collect the liquidity, then reverse hard in the opposite direction.
It's not random. It's the game.
2
11
3,989
Mar 2
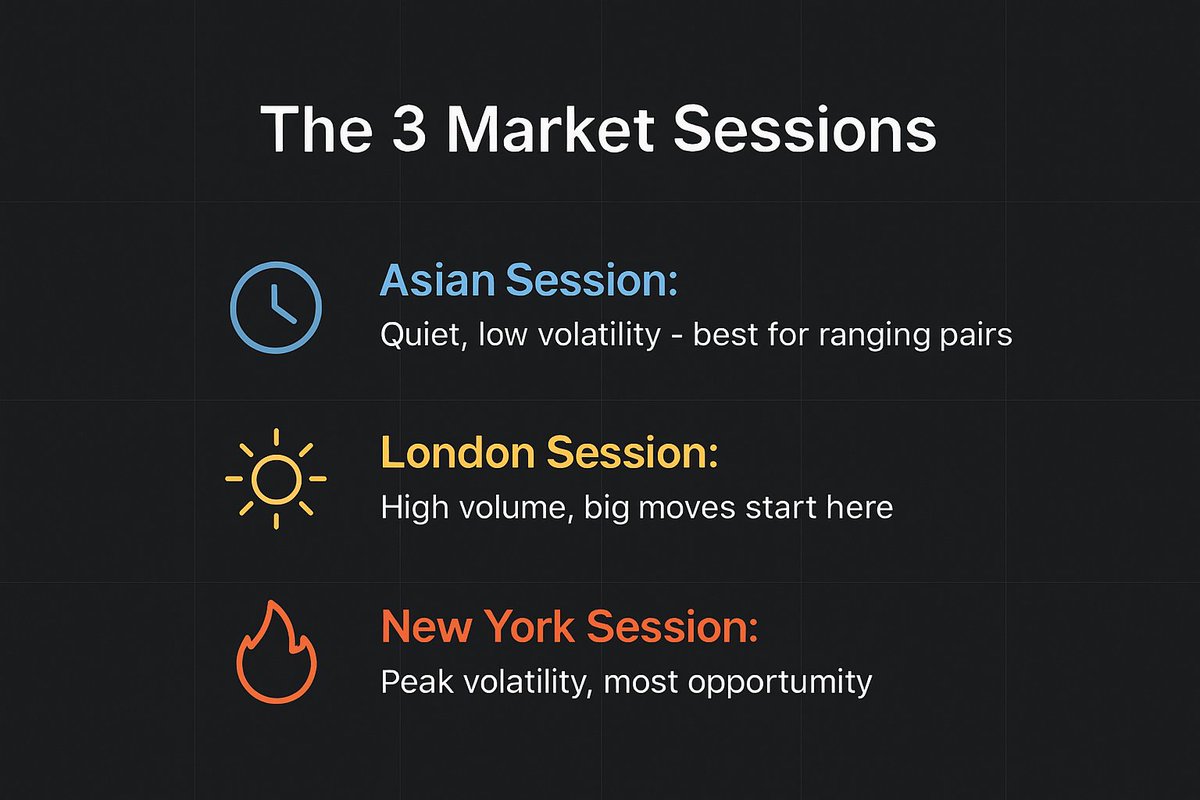
The first 30 minutes of any trading session are the most deceptive.
Price is still reacting to overnight orders, news, and stops being triggered. It looks like a move — but it's often just noise clearing out.
A lot of experienced traders wait until the dust settles before they even think about entering.
1
1
10
3,742
Mar 2
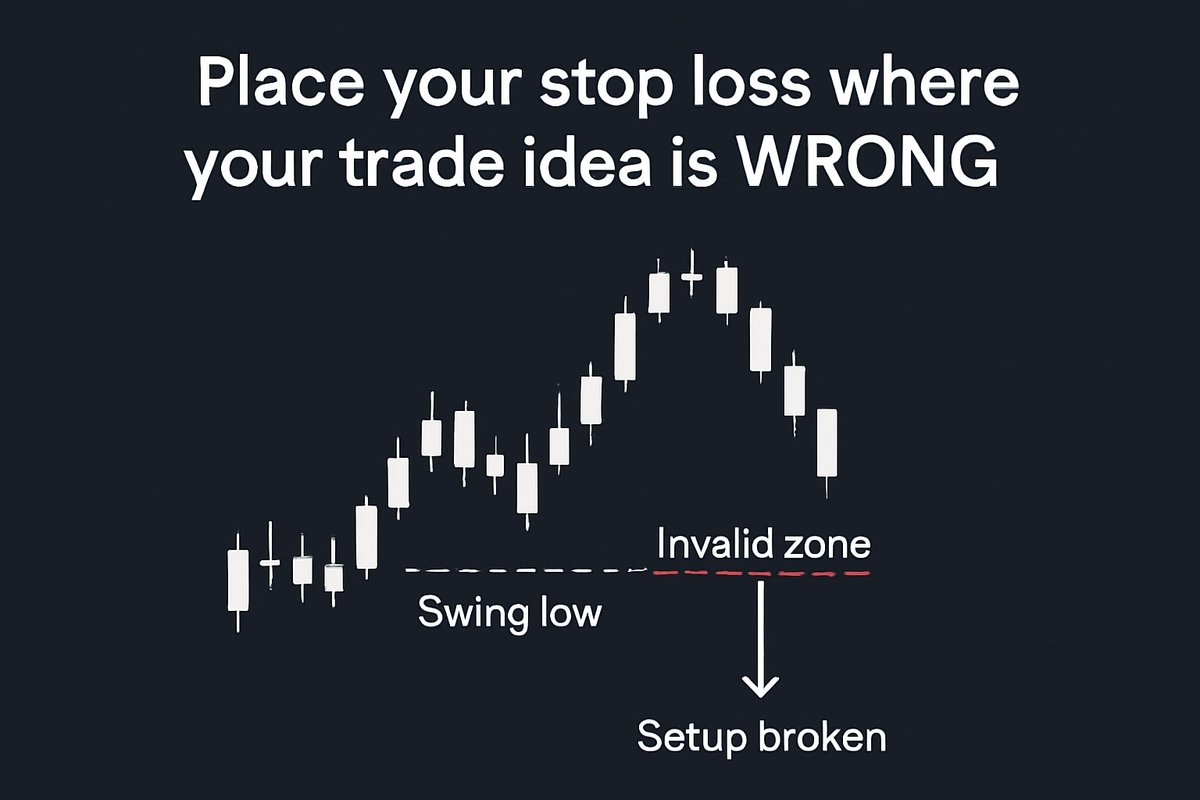
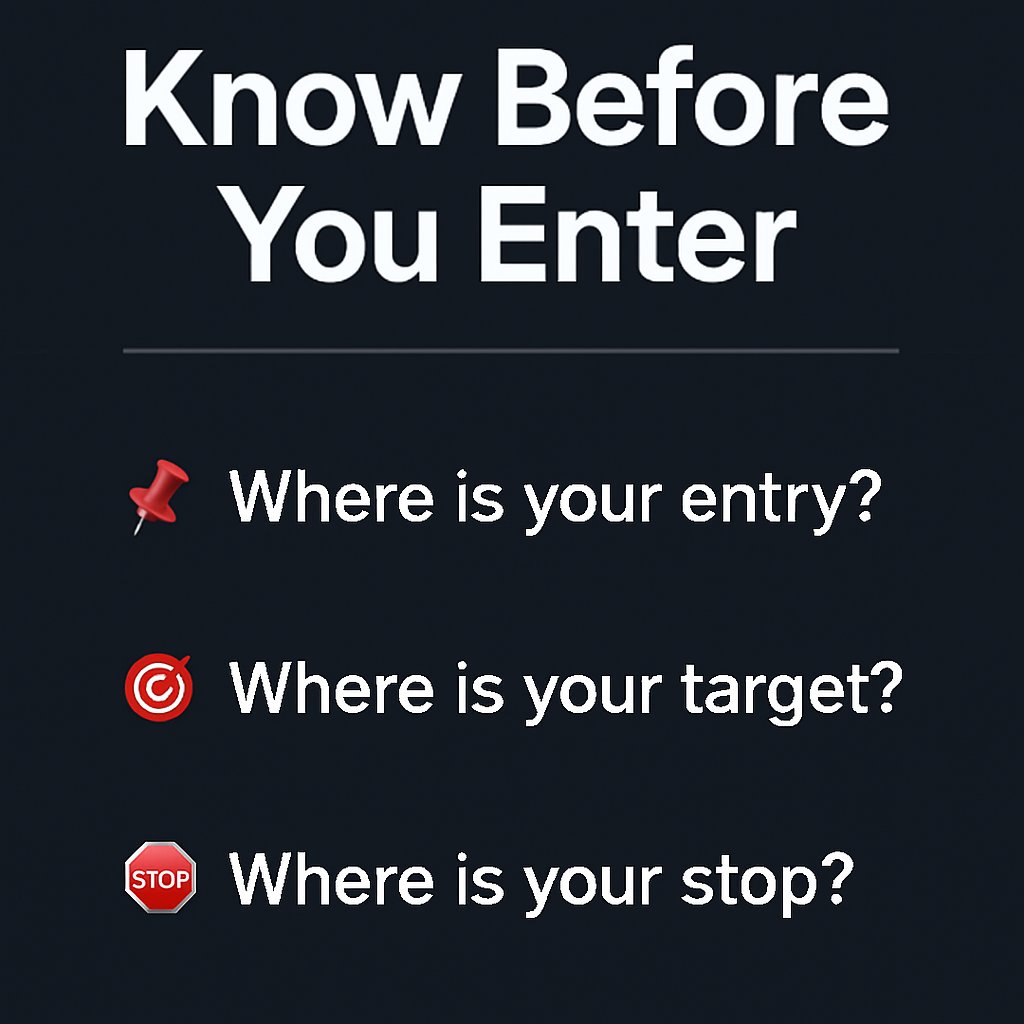
Most traders place their stop loss at a random number below entry.
That's why they keep getting stopped out right before the move happens.
A stop loss should go where your trade idea is WRONG — usually just below a swing low or key level.
If price breaks that point, the setup is invalid. That's when you want out.
2
9
3,666