Hazards of the job. š
Hot take - corporations should provide demo access to their portals so that we can see the quality of their UX before choosing a bank, lender, credit card, etc.
I'm teaming up with Caleb Givens and Tammy Lynn Jackson for the next Food Bank TUG! I'll be presenting a slightly updated version of my TC25 presentation Relationships vs Joins vs Blends, with plenty of time for questions.
You can RSVP here: usergroups.tableau.com/eventā¦
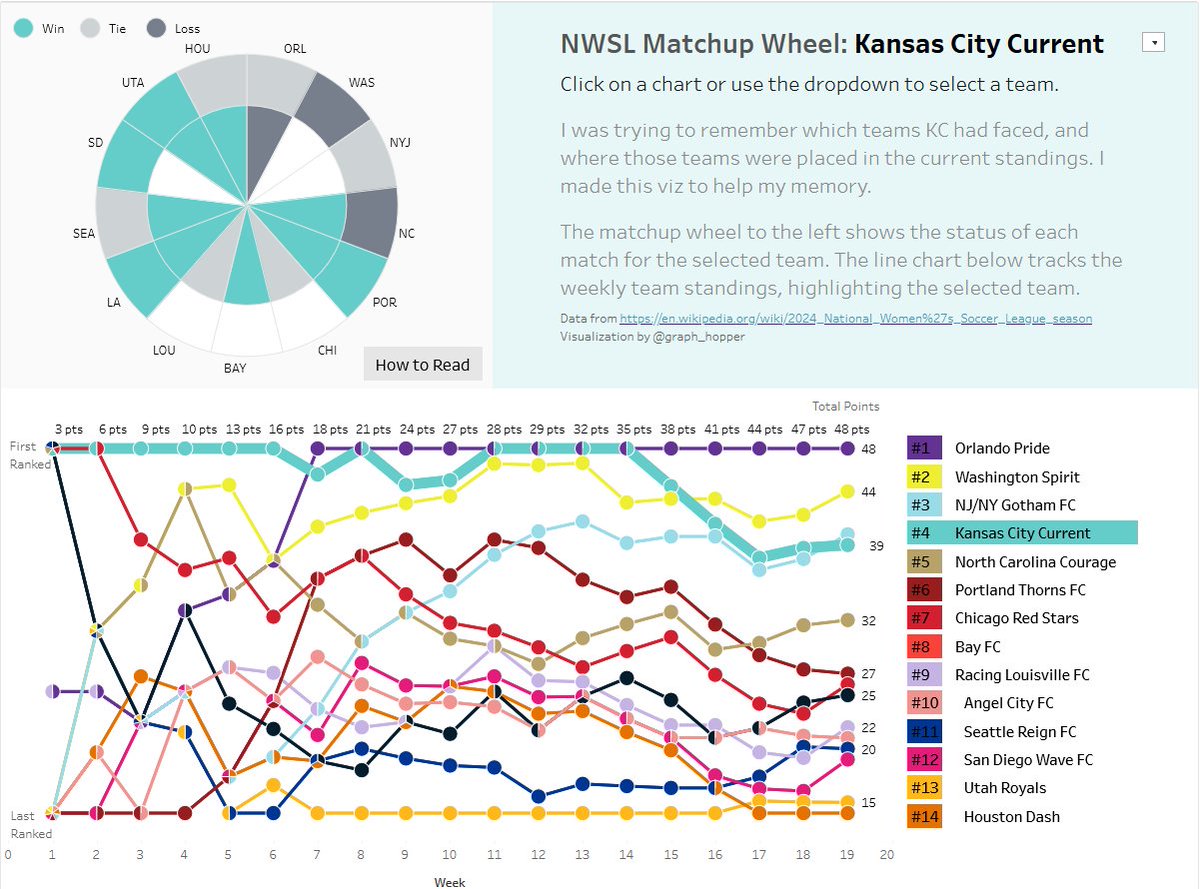
ALT A View with 14 Matchup Wheels - one for each NWSL team.
KC has 5 wins. Pride & Spirit are next with 4 wins.
Gotham, Thorns, ACFC, Wave, Reign, and Bay all have 2 wins.
Dash, Utah, Racing, and Stars have one win.
NC Courage has no wins.
Seattle Reign and Houston Dash have had the toughest lineups, while Chicago Stars and Bay FC have had the lowest ranked opponents.
Check out the tool for more details!
A great message from @thedataveteran:
As analysts we will need to answer
"Did AI make the right decision?" In situations where stakeholders currently ask "Is this the right decision?".
Just wrapped up final prep for my Tableau Conference session, Prep Smarter, Not Harder:
⢠Apr 15, 3:00 PM ā Theater 1
⢠Apr 17, 2:00 PM ā Theater 3
If youāre at #TC25, come say hi! If not, the session will be recorded and available later on Salesforce .
Come to my #TC25 talk Relationships vs Joins vs Blends at 2 on Stage 7!
I'll show you how to configure them, demo how they shape data differently, and talk through the pros and cons of each.
If you can't make it today, there is a repeat session Wednesday at 9:30 on Stage 8.
Who else is getting excited for @tableau conference? @deeVizable and I will be back and sharing the stage to host the Tableau Tip Battle. This year is a Luau theme and we have an incredible line-up of tipsters.
Introducing the first 4...
Tableau Visionaries, @graph_hopper, @ScottKimly, @prem_prasann, @ToreLev
Be sure to catch our session to see their amazing tips!
Who else will be taking to the stage? Check back tomorrow!
#TC25#datafam
If you wanted to catch my Binary Parameters presentation but missed it - you're in luck!
A recording of the Team Datafam TUG presentation is now available on YouTube!
youtube.com/watch?v=oJAoDp8jā¦
Latest TUG is youtu.be/oJAoDp8joEQ
"Binary Parameters - a New Multi-Value Parameter Approach" by @graph_hopper
Overview of parameters, an explanation of binary parameters, & then a live demo of the technique.
LOTS of awesome content @ youtube.com/@TeamDataFam#datafam
I'm making avatar stickers again for #Data25!
If you'd like one, please send me a message on Bluesky or LinkedIn before April 10. I won't be watching my Twitter notifications.
I'll be demoing Binary Parameters at next week's #KCTUG meeting!
Meeting details: usergroups.tableau.com/eventā¦
Sorry long-distance pals, this one is in person!
Introducing the 2025 #TableauVisionary leaders!
They inspire us with their Tableau mastery, teaching, and collaborationāand make the #DataFam better for everyone.
Learn more about these distinguished leaders: tabsoft.co/4b1ghxF
Is learning @tableau on your list of resolutions?
All the resources you need are available to you for free thanks to the #DataFam.
Here is everything you need to get started š§µ
My new 5 part series Bringing Tables Together covers everything you need to know about Tableau Data Models, including:
šHow is a blend different from a join?
šWhy are my null rows missing?
š§How can I make a real join?
Read it here: playfairdata.com/bringing-taā¦
All things data by the Tableau Community.
Head to this week's #DataFam Roundup for the latest data viz tips, tricks, and inspiration. tabsoft.co/4fK1eJS
My #IronViz workbook is a collection of the entertainment Iāve enjoyed this year, in the style of a point & click adventure!
public.tableau.com/app/profiā¦
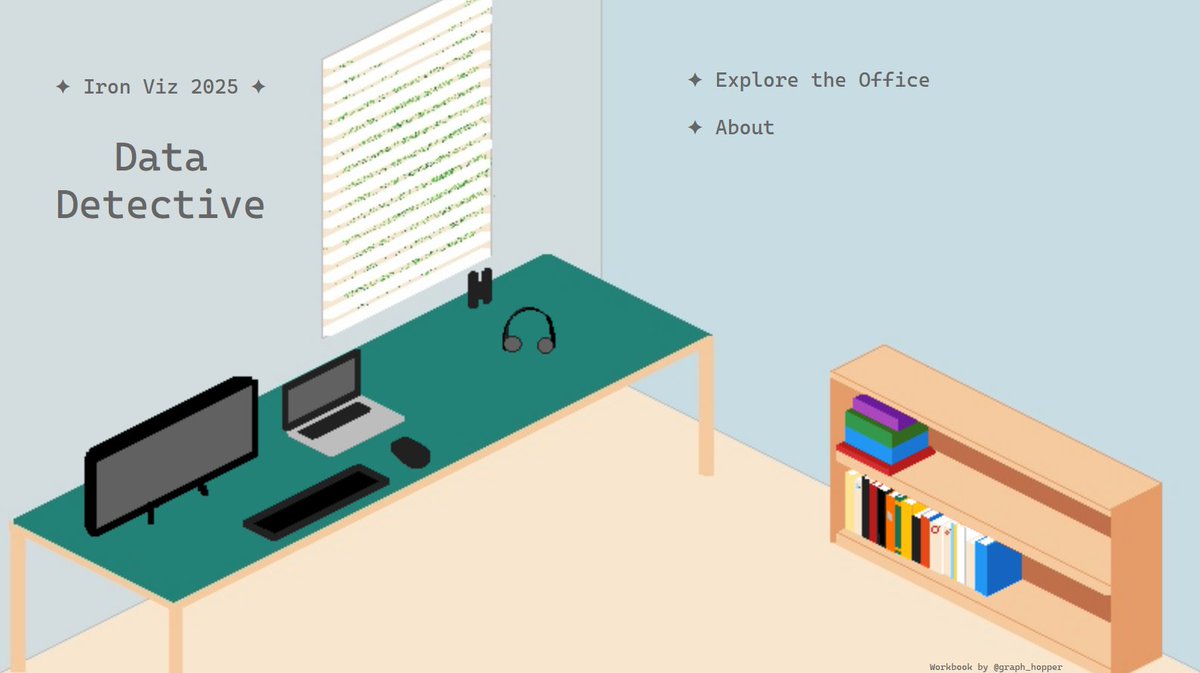
ALT Title: Iron Viz 2025 - Data Detective
An image of an office with a desk and book case, in a pixel art style. The desk has a monitor, laptop, headphones, and binoculars. The bookcase is holding books and a stack of games.
Clicking on items reveal hidden containers with the details of different types of entertainment. There are several URL actions linking out of the tool to learn more about the media revealed.
My favorite build was for Birding. I attempted to recreated the experience of birding in a chart. As you interact with the dots, you'll see a lot of recurring characters. The less frequent observations stand out against the common birds in my area.
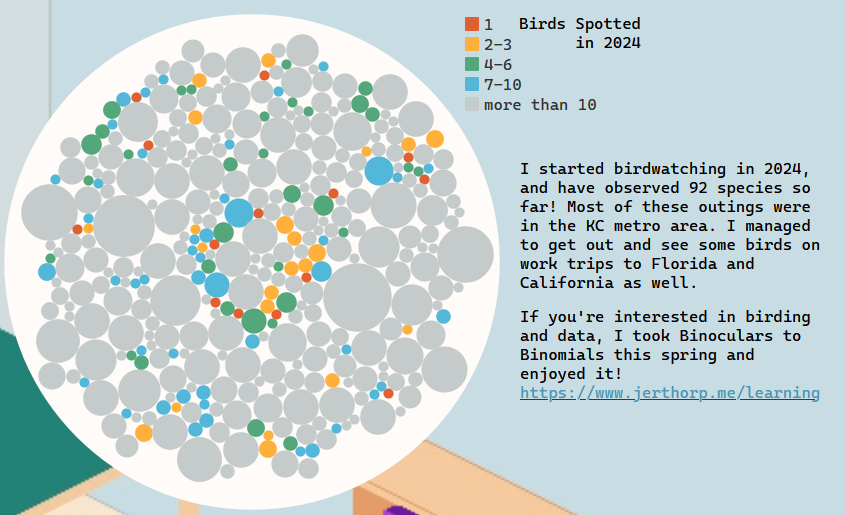
ALT text: I started birdwatching in 2024, and have observed 92 species so far! Most of these outings were in the KC metro area. I managed to get out and see some birds on work trips to Florida and California as well.
If you're interested in birding and data, I took Binoculars to Binomials this spring and enjoyed it!
https://www.jerthorp.me/learning
Color Legend: Birds Spotted in 2014 Red 1 Yellow 2-3 Green 4-6 Blue 7-10 Gray Over 10
Chart: A packed bubble chart where 70% of the bubbles are gray