
If you're in:
1. Data 📊,
2. Finance 💰,
3. Tech 💻…
Let’s connect 🤝
I’m currently learning data analysis, exploring SQL 🧠, data cleaning 🧹, and how data drives decisions 📈
Would love to connect with people building, learning, and growing in this space
#DataAnalysis #TechCommunity #Finance #LearningInPublic #30DaysOfData
6
2
24
379
Day 3 of my Data Analysis Challenge 📊
Let’s make metadata real using your phone 👀
When you take a picture, the image is the data…
But your phone also stores extra details — that’s metadata 👇
- Date & time the photo was taken
- Location (GPS)
- Camera type
- File size
- Resolution
You don’t always see it, but it’s there — giving context to the photo.
Without this metadata, it’s just a random image.
With it, you know when, where, and how it was created.
That’s the power of metadata.
#DataAnalysis #LearningInPublic #30DaysOfData
1
2
3
187
Day 2/30 of my Data Analysis Challenge 📊
Where does your data really come from? 👀
Most people jump straight into analysis… but forget the most important question:
“Can I trust this data?”
Data doesn’t just appear — it comes from somewhere:
Spreadsheets, databases, surveys, apps, even manual entries.
And here’s the truth 👇
Your insights are only as good as your data source.
Clean charts don’t fix bad data.
Fancy dashboards don’t correct wrong inputs.
A great analyst doesn’t just analyze — they investigate:
✔ Who collected this data?
✔ How was it recorded?
✔ Is anything missing or biased?
Because one wrong source can lead to:
❌ Wrong decisions
❌ Lost money
❌ Misleading conclusions
So next time you open a dataset, pause and ask:
👉 “Do I understand where this came from?”
That question alone will set you apart as a data analyst.
#DataAnalysis #DataAnalytics #LearningInPublic #30DaysOfData #DataSources
1
2
7
190

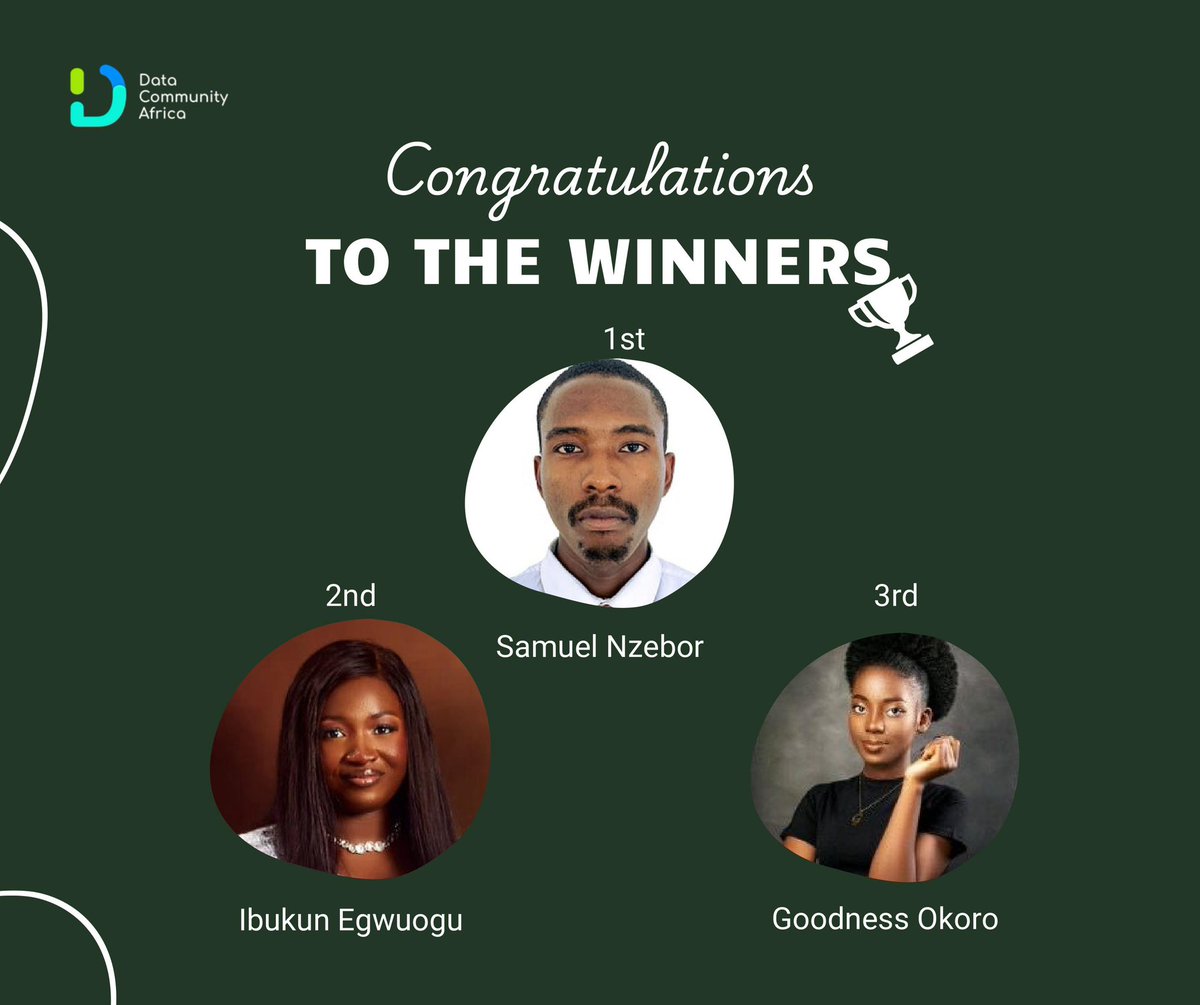
The results are in!!🥳
We just wrapped our #30DaysOfData Challenge 2026 and our scholars absolutely delivered! 🔥
Congratulations to our TOP 3 🏆
🥇 Samuel Nzebor — 261,320 XP
🥈 Ibukun Egwuogu — 206,236 XP
🥉 Goodness Okoro — 195,596 XP
30 days. No excuses. Just growth. 💪🏽
4
5
43
2,326

Feb 22
1/2
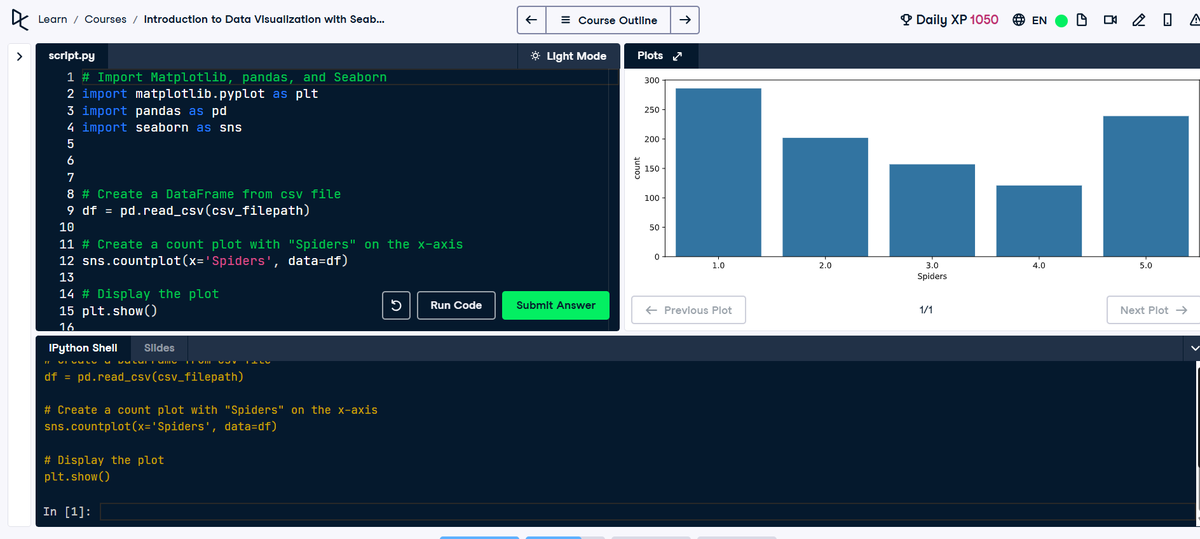
#30DaysofData with @DataFestAfrica || Day 14
In continuation of the dataset visualization exploration using Seaborn.
@DataCampDonates #DataCommunityAfrica #DCA #DCDonates #DataJourney #DataFestAfrica #DataScience
1
8
169
Feb 21
1/2
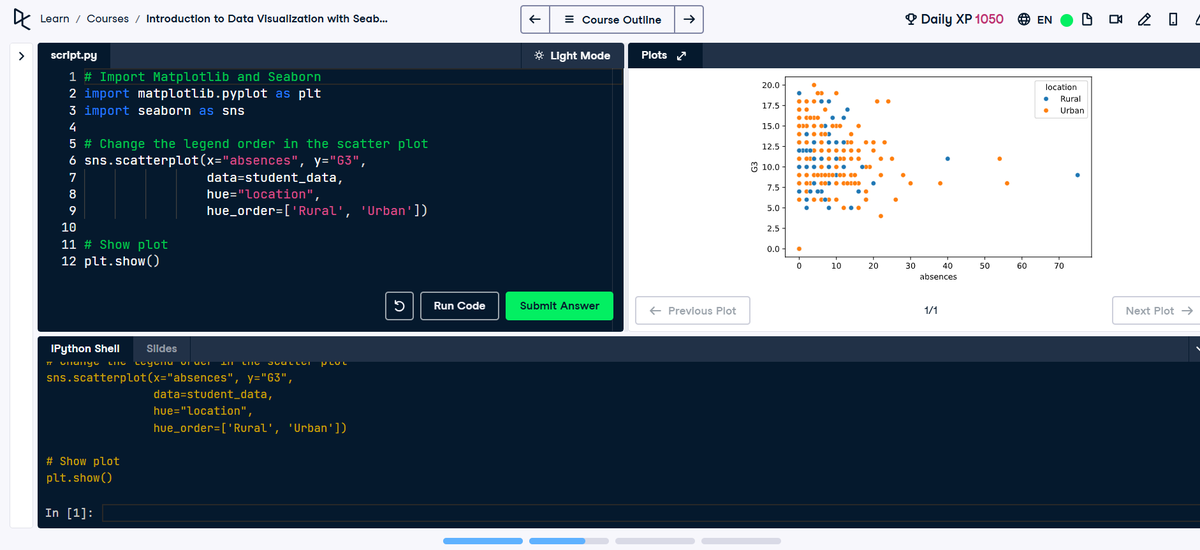
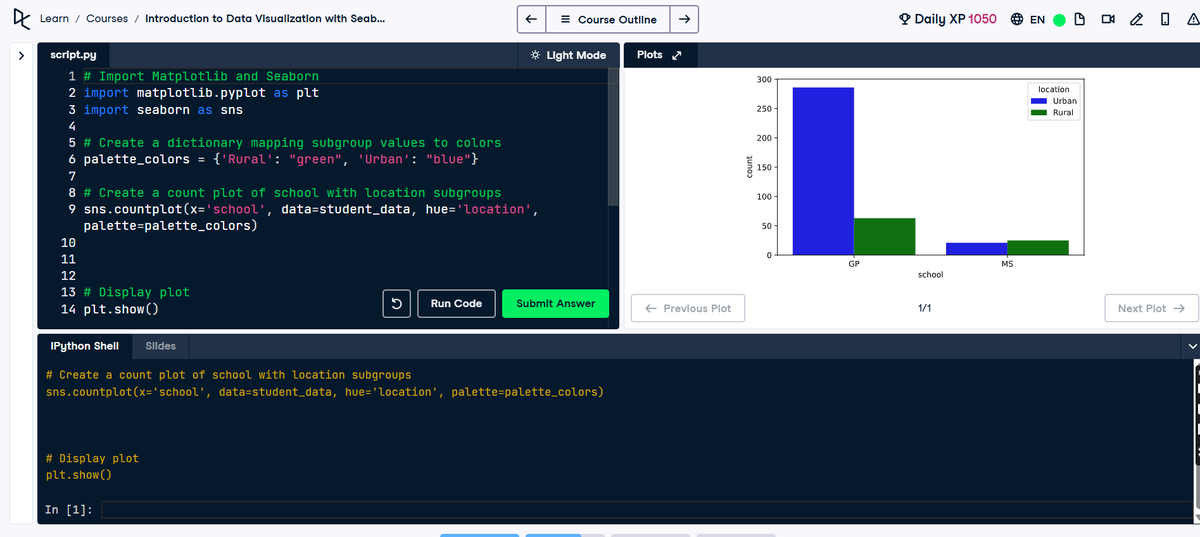
#30DaysofData with @DataFestAfrica || Day 13
In today’s session, I explored data visualization using Seaborn. Although I didn’t cover as much as I did on previous days, ......
@DataCampDonates #DataCommunityAfrica #DCA #DCDonates #DataJourney #DataFestAfrica #DataScience
1
3
34

Feb 20
Things I’ve learned on Excel this week:
Working with data
Creating formulas
Working with tables
Managing and filtering data
Working with structured references which are easier to filter and understand.
#DataAnalysis #30daysofdata
2
4
107

1 Nov 2025
🧵 Day 1 of #30DaysOfData #BuildInPublic Journey
Today marks the start of my data analysis consistency challenge! 🚀
✅ Loaded my dataset — Global Energy Data (OWID)
#DataScience #DataAnalysis #Python #JupyterNotebook #Pandas #Streamlit #Plotly #LearningInPublic #TechTwitter

1
6
442

24 Oct 2025
Day 14 of #30DaysOfData
Raw data isn’t always model-ready.
🔹 Transform: make it usable (log, encode, scale)
🔹 Normalize: keep values on the same scale (Min–Max, Z-score)
These steps keep models fair and insights reliable.
#DataScience #MachineLearning #Analytics

23 Oct 2025

Day 13 of #30DaysOfData
Outliers aren’t always errors sometimes they’re the insights that stand out for a reason.
🎯 Detect: Z-score, IQR, Boxplot, Isolation Forest
⚙️ Handle: Investigate, Transform, or Remove
Great data scientists don’t rush to delete. They ask why.
#DS

6
92
23 Oct 2025
Day 13 of #30DaysOfData
Outliers aren’t always errors sometimes they’re the insights that stand out for a reason.
🎯 Detect: Z-score, IQR, Boxplot, Isolation Forest
⚙️ Handle: Investigate, Transform, or Remove
Great data scientists don’t rush to delete. They ask why.
#DS
21 Oct 2025
Day 12 of #30DaysOfData
Missing values are inevitable, how you handle them shapes your model’s accuracy.
✅ Techniques:
Deletion (if few)
Imputation (Mean, Median, Mode, KNN)
Advanced: Multiple or Model-based methods
Handle them smartly. Data integrity drives good science.
#DS
4
188
21 Oct 2025
Day 12 of #30DaysOfData
Missing values are inevitable, how you handle them shapes your model’s accuracy.
✅ Techniques:
Deletion (if few)
Imputation (Mean, Median, Mode, KNN)
Advanced: Multiple or Model-based methods
Handle them smartly. Data integrity drives good science.
#DS
12 Oct 2025
Day 11 of #30DaysOfData ⚙️
Feature Engineering is where raw data becomes intelligence.
It’s about creating, transforming, and selecting the right variables to help models see patterns humans might miss.
Better features → Smarter models.
#DataScience #MachineLearning
3
4
874
10 Oct 2025
Day 10 of #30DaysOfData
Probability is the backbone of Data Science, it helps us handle uncertainty and make better predictions.
🔹 Quantifies uncertainty
🔹 Powers ML models
🔹 Guides smarter decisions
Nothing in data is ever certain, probability helps us make sense of it.
#Ds
8 Oct 2025
Day 9 of #30DaysOfData
Statistics is the backbone of data science - it helps us find meaning in uncertainty.
🔹 Mean – Central value
🔹 Median – Middle point, resists outliers
🔹 Variance – Measures data spread
🔹 Std. Deviation – Shows how far values deviate
#DataScience
4
573
8 Oct 2025
Day 9 of #30DaysOfData
Statistics is the backbone of data science - it helps us find meaning in uncertainty.
🔹 Mean – Central value
🔹 Median – Middle point, resists outliers
🔹 Variance – Measures data spread
🔹 Std. Deviation – Shows how far values deviate
#DataScience
7 Oct 2025
Day 8 of #30DaysOfData
Master variable types to analyze smarter.
🔹Qualitative Data – non-numeric, descriptive (e.g., opinions, colors, categories)
🔹Quantitative Data – numeric, measurable (e.g., age, income, scores)
Know your variables → better insights & models.
#datascience
3
14
1,989
7 Oct 2025
Day 8 of #30DaysOfData
Master variable types to analyze smarter.
🔹Qualitative Data – non-numeric, descriptive (e.g., opinions, colors, categories)
🔹Quantitative Data – numeric, measurable (e.g., age, income, scores)
Know your variables → better insights & models.
#datascience
6 Oct 2025
Day 7 of #30DaysOfData
Not all data are the same. Knowing the type guides how you clean, analyze & model it.
🔹 Structured: Tables (SQL, Excel)
🔹 Unstructured: Text, images, audio
🔹 Semi-structured: JSON, XML
Know your data. Choose the right method.
#DataScience
1
1
11
3,016
6 Oct 2025
Day 7 of #30DaysOfData
Not all data are the same. Knowing the type guides how you clean, analyze & model it.
🔹 Structured: Tables (SQL, Excel)
🔹 Unstructured: Text, images, audio
🔹 Semi-structured: JSON, XML
Know your data. Choose the right method.
#DataScience
3 Oct 2025
Day 6 of #30DaysOfData
Data tells a story but without visualization, it stays hidden.
Visualization reveals patterns, outliers & insights, making data clear for everyone.
Tools: Matplotlib, Seaborn, Power BI, Tableau.
A single chart can speak louder than rows of numbers.
#DS
3
1,392
3 Oct 2025
Day 6 of #30DaysOfData
Data tells a story but without visualization, it stays hidden.
Visualization reveals patterns, outliers & insights, making data clear for everyone.
Tools: Matplotlib, Seaborn, Power BI, Tableau.
A single chart can speak louder than rows of numbers.
#DS
2 Oct 2025
Day 5 of #30DaysOfData
Exploratory Data Analysis (EDA) is how we make sense of data before modeling:
🔹 Spot patterns
🔹 Detect anomalies
🔹 Test hypotheses
🔹 Guide feature selection
EDA turns data into understanding - without it, models risk being blind guesses.
#DataScience
4
399
2 Oct 2025
Day 5 of #30DaysOfData
Exploratory Data Analysis (EDA) is how we make sense of data before modeling:
🔹 Spot patterns
🔹 Detect anomalies
🔹 Test hypotheses
🔹 Guide feature selection
EDA turns data into understanding - without it, models risk being blind guesses.
#DataScience
1 Oct 2025
Day 4 of #30DaysOfData
Great models can’t fix bad data.
That’s why Data Cleaning is critical in Data Science:
✅Handle missing values
✅Remove duplicates
✅Correct errors
✅Standardize formats
It may not be glamorous, but clean data is the foundation of trustworthy insights.
#DS
1
1
7
1,275
1 Oct 2025
Day 4 of #30DaysOfData
Great models can’t fix bad data.
That’s why Data Cleaning is critical in Data Science:
✅Handle missing values
✅Remove duplicates
✅Correct errors
✅Standardize formats
It may not be glamorous, but clean data is the foundation of trustworthy insights.
#DS
30 Sep 2025
Day 3 of #30DaysOfData
The Data Science Lifecycle turns raw data into real impact:
1️⃣ Define the Problem
2️⃣ Collect Data
3️⃣ Clean & Prepare
4️⃣ Analyze
5️⃣ Model
6️⃣ Evaluate
7️⃣ Deploy & Monitor
Miss a step, and the project risks failure.Master them, and data drives transformation.
6
990
30 Sep 2025
Day 3 of #30DaysOfData
The Data Science Lifecycle turns raw data into real impact:
1️⃣ Define the Problem
2️⃣ Collect Data
3️⃣ Clean & Prepare
4️⃣ Analyze
5️⃣ Model
6️⃣ Evaluate
7️⃣ Deploy & Monitor
Miss a step, and the project risks failure.Master them, and data drives transformation.
29 Sep 2025
Day 2 of #30DaysOfData
Data alone is not enough.
Data is raw and unprocessed.
Information organizes it into context.
Insight extracts meaning that drives decisions.
Only when data becomes insight does it create real value. That’s the essence of Data Science.
#DataScience
1
1
7
410
29 Sep 2025
Day 2 of #30DaysOfData
Data alone is not enough.
Data is raw and unprocessed.
Information organizes it into context.
Insight extracts meaning that drives decisions.
Only when data becomes insight does it create real value. That’s the essence of Data Science.
#DataScience
28 Sep 2025
Day 1 of #30DaysOfData
What is Data Science?
It’s the practice of turning raw data into insights that guide decisions.
Data = facts
Insight = action
Over the next 30 days I’ll share simple, practical ways data shapes business, tech and everyday life.
Stay tuned.
#DataScience
3
1
12
530