
Jun 4
🏆 Knicks won on defense game 1 vs Spurs and we broke Spurs streak of being 6-0 in game 1’s of the NBA Finals
📊 Knicks 50 points in the paint
📊 8 Steals
🚳 Josh Hart 2/6 FG | 0 3s allowed
🚳 Jalen Brunson 1/15 FG | 0 3s allowed
🚳 Mikal Bridges 4/12 FG | 1 3 allowed
🚳 Deuce McBride 4/9 FG | 1 3 allowed
🚳 Jose Alvarado 1/3 FG | 1 3 allowed
🚳 Kat 3/15 FG | 0 3s allowed
🚳 OG Anunoby 3/11 FG | 3 3s allowed
🍝 Robinson 3/6 FG | 1 3 allowed
🍝 Shamet 8/14 FG | 3 3s allowed
🍝 Jordan Clarkson 2/3 FG | 1 3 allowed
🔒 Defensive FG% Allowed
🚳 Josh Hart 33.3%
🚳 Jalen Brunson 6.7%
🚳 Mikal Bridges 33.3%
🚳 Deuce McBride 44.4%
🚳 Jose Alvarado 33.3%
🚳 Karl-Anthony Towns 20.0%
🚳 OG Anunoby 27.3%
🍝 Mitchell Robinson 50.0%
🍝 Landry Shamet 57.1%
🍝 Jordan Clarkson 66.7%
🔐 Defensive Matchups We Won:
🚳 With Robinson on Luke Kornet:
🏀 0 Points | 0 Assist | 0 Rebounds
🏀 0/0 FG (0%) | 0/0 3PT (0%)
🏀 0/0 FT (0%) | ⏱️ 2:10 Minutes
🚳 With Mitch on Victor Wembanyama:
👽 7 Points | 0 Assist | 0 Rebounds
👽 2/5 FG (40.0%) | 1/4 3PT (25.0%)
👽 2/2 FT (100%) | ⏱️ 1:50 Minutes
🚳 Josh Hart on De’Aaron Fox:
🦊 0 Points | 0 Assist | 0 Rebounds
🦊 0 Steals | 1 Blocks
🦊 0/1 FG (0.0%) | 0/0 3PT (0%)
🦊 0/0 FT (0%)
🦊 1 Turnover Forced | ⏱️ 1:06 Minutes
🚳 With Brunson on Julian Champagnie:
🌵 0 Points | 1 Assist | 0 Rebounds
🌵 0/4 FG (0.0%) | 0/3 3PT (0.0%)
🌵 0/0 FT (0%) | ⏱️ 5:58 Minutes
🚳 With Josh Hart on Stephon Castle:
🏰 4 Points | 0 Assist | 0 Rebounds
🏰 0 Steals | 1 Blocks
🏰 1/3 FG (33.3%) | 0/0 3PT (0%)
🏰 2/2 FT (100%)
🏰 1 Turnover Forced | ⏱️ 4:50 Minutes
🚳 With Kat on Victor Wembanyama:
👽 9 Points | 1 Assist | 0 Rebounds
👽 0 Steals | 2 Blocks
👽 2/11 FG (18.2%) | 0/2 3PT (0.0%)
👽 5/5 FT (100%)
👽 5 Forced Turnovers | ⏱️ 8:36 Minutes
🚳 With OG Anunoby on De’Aaron Fox:
🦊 0 Points | 1 Assist | 0 Rebounds
🦊 0/2 FG (0.0%) | 0/0 3PT (0%)
🦊 0/0 FT (0%) | ⏱️ 3:35 Minutes
🚳 With OG Anunoby on Devin Vassell:
🦂 0 Points | 1 Assist | 0 Rebounds
🦂 0/4 FG (0.0%) | 0/3 3PT (0.0%)
🦂 0/0 FT (0%) | ⏱️ 2:03 Minutes
🚳 With Bridges on Stephon Castle:
🏰 2 Points | 0 Assist | 0 Rebounds
🏰 1/4 FG (25.0%) | 0/1 3PT (0.0%)
🏰 0/0 FT (0%) | ⏱️ 1:35 Minutes
🚳 With Mikal Bridges on De’Aaron Fox:
🦊 0 Points | 0 Assist | 0 Rebounds
🦊 0/2 FG (0.0%) | 0/2 3PT (0.0%)
🦊 0/0 FT (0%) |⏱️ 0:49 Minutes
🗣️ The Knicks’ defense completely dictated Game 1 50 points in the paint, 8 steals, and multiple lockdown matchups that crushed Spurs efficiency. Jalen Brunson held opponents to 1/15 shooting (6.7%), Karl-Anthony Towns limited Victor Wembanyama to 2/11, and Josh Hart OG Anunoby held De’Aaron Fox to 0/3 combined. Add in 0/4 from Julian Champagnie and 0/4 from Devin Vassell vs OG, and it’s clear New York turned elite scorers into non-factors and snapped San Antonio’s 6-0 Game 1 Finals streak.
#AlwaysKnicks #NBATwitter #NYkx #NBAFinals #Knicks #NewYorkKnicks #KnicksNation #Spurs #GoSpursGo #Defense #NBADefense #Basketball #Hoops #StatMuse #AdvancedStats #BasketballAnalytics #HoopStudy #Game1 #NBABreakdown #SNYK
1
1
6
1,547
Jun 4
👨🏽💻 Josh Hart Game 1 vs Spurs doing the dirty work (1-0):
👨🏾🏭 3 Points | 15 Rebounds | 6 Assists
👨🏾🏭 26.8 Minutes | 0/3 3PT (0%)
👨🏾🏭 1/5 FG (20%) | 1/2 2PT (50%)
👨🏾🏭 1/1 FT (100%) | 27.6 TS% | 20.0 eFG%
👨🏾🏭 0 Turnovers | 4 Fouls | 2 Fouls Drawn
👨🏾🏭 AST:TOV 6.0 | 22 /-
🚳 With Josh Hart on Stephon Castle:
🏰 4 Points | 0 Assist | 0 Rebounds
🏰 0 Steals | 1 Blocks
🏰 1/3 FG (33.3%) | 0/0 3PT (0%)
🏰 2/2 FT (100%)
🏰 1 Turnover Forced | ⏱️ 4:50 Minutes
🚳 Josh Hart on De’Aaron Fox:
🦊 0 Points | 0 Assist | 0 Rebounds
🦊 0 Steals | 1 Blocks
🦊 0/1 FG (0.0%) | 0/0 3PT (0%)
🦊 0/0 FT (0%)
🦊 1 Turnover Forced | ⏱️ 1:06 Minutes
🗒️ Josh Hart led all players with 15 rebounds and 6 assists in his first NBA Finals game joining Shaquille O’Neal (1995) and Larry Bird (1981) as the only players in the shot-clock era to do so.
🗒️ 15 Rebounds, 6 Assist, 4 Steals all game-highs plus a 22. First player since Larry Bird to hit those numbers in a NBA Finals game.
🗒️ Players with 15 RPG in the Finals since the merger: Moses Malone, Nikola Jokic and now Josh Hart.
🗒️ At 6’5”, Hart is tied as the shortest player EVER to record 15 rebounds in a NBA Finals game.
🗒️ Players with 500 playoff rebounds since 2023: Josh Hart, Jayson Tatum, Nikola Jokić, Karl-Anthony Towns.
🗒️ Fewest points in a NBA Finals game with 15 REB & 6 AST: 3 Josh Hart (tonight)
5, 6, 8, 9 points by Bill Russell
🎬 Josh Hart Game 1 vs Spurs ⏬
#Alwaysknicks #NBATwitter #SNYK #NBAFinals #Knicks #NewYorkKnicks #KnicksNation #Spurs #GoSpursGo #Defense #Porvida #Basketball #Hoops #StatMuse #AdvancedStats #BasketballAnalytics #HoopStudy #Game1 #NBABreakdown #NYKx #NYK
1
3
847

May 24
lots of talk about how the canes are 1-16 in their last 4 trips to the ECF but nobody talks about how every single team they lost to ended up playing in the Stanley cup final #advancedStats
11
5
305
12,966

May 21
◼️⭕️Recently analyzed that Real Madrid is the #1 team in Rebound % this EuroLeague season.
But how dependent are they on Tavares?
🖇️linked chart
🔹 Defensive Rebounding
→ Clearly a team strength
Most forwards & centers are above league average.
🔸 Offensive Rebounding
→ More centralized impact
Tavares stands out as the main driver … but Garuba & Okeke add major support.
Dominant rebounding isn’t only size, it is roles structure collective presence.
👉 Rebound %: It is the ratio between rebounds grabbed by the player to the total rebounds can grab. Therefore, the opponent’s total rebounds are taken into account to calculate the total "grabbable" rebounds.
#EuroLeague #BasketballAnalytics #Rebounding #AdvancedStats #Figurei8ht #realmadrid #F4GLORY

May 18

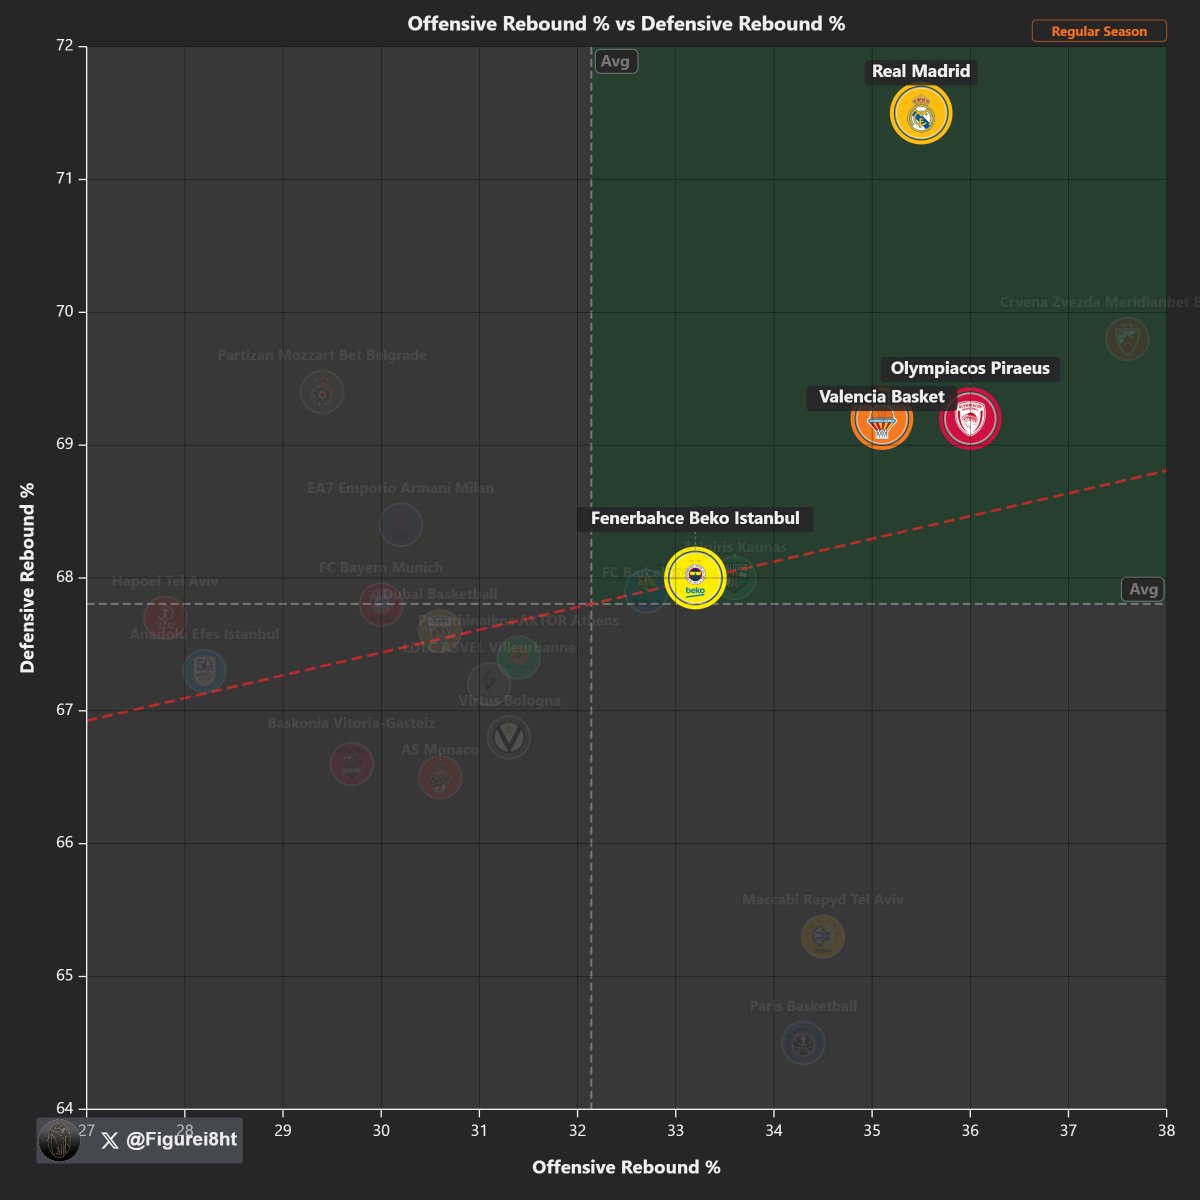
◼️⭕️ The pattern is clear:
All EuroLeague F4 teams live in the top-right quadrant.
📈 Above-average Offensive Rebound %
📈 Above-average Defensive Rebound%
Rebounding isn’t a detail — it’s a prerequisite.
Real Madrid is elite on both ends of rebounding.
Crvena Zvezda the only team in top quadrant but not in F4 and PO.
How to read the 🖇️chart?
➡️ Best Offensive Rebound %
⬆️ Best Defensive Rebound %
#EuroLeague #F4GLORY #olympiacos #realmadrid #valenciabasket #Fenerbahçe
2
6
2,577
May 21
🚀 The offensive ceiling in EuroLeague is rising.
This season delivered the highest team Offensive Rating in the last 5 years.
🔴 Olympiacos: 122.6 ORTG (‘25–26) | 6.0 vs. season average
Recent benchmarks:
122.1 🟢 Panathinaikos (‘24–25) | 6.2 vs. season avg
121.8 ⚫️ Partizan (‘22–23) | 7.5 vs. season avg
121.5 🔵 Anadolu Efes (‘24–25) | 5.6 vs. season avg
Elite offense is no longer rare — it’s becoming the standard.
👉 Offensive Rating (ORTG): It is the team’s offensive efficiency value. It gives an estimate of the points made by a team per 100 possessions.
#EuroLeague #BasketballAnalytics #AdvancedStats #HoopsAnalytics #Figurei8ht #olympiacosbc
11
1,546
May 11
👨🏾💻 Karl-Anthony Towns impacted winning for the New York Knicks in a big way across the series sweep of Philly (4-0) and 3rd consecutive trip to the conference finals:
🇩🇴 15.5 Points | 8.0 Rebounds
🇩🇴 7.5 Assists | 2.3 Turnovers
🇩🇴 23.4 Minutes | 1.3 Blocks | 0.3 Steals
🇩🇴 5.3 FGM | 8.5 FGA | 61.8 FG%
🇩🇴 3.5 FTM | 4.3 FTA | 82.4 FT%
🇩🇴 3.8 2PM | 5.8 2PA | 65.2 2P%
🇩🇴 1.5 3PM | 2.8 3PA | 54.5 3P%
🇩🇴 74.7 TS% | 70.6 eFG%
🇩🇴 2.5 Off Rebounds | 4.3 Fouls Drawn
🇩🇴 0.8 Fast Break Points
🇩🇴 2.0 2nd Chance Points
🇩🇴 10.8 /- | 43 Total
💻 Game 4 Notes Knicks Sweep:
🧊 Joel Embiid vs New York Knicks impact this series and was Kat primary defensive matchup:
🧊 18.7 PTS | 5.0 REB | 3.3 AST
🧊 29.0 MIN | 2.3 TOV | 1.0 BLK
🧊 6.0 FGM | 12.0 FGA | 50.0 FG%
🧊 6.0 FTM | 7.3 FTA | 81.8 FT%
🧊 5.3 2PM | 9.3 2PA | 57.1 2P%
🧊 0.7 3PM | 2.7 3PA | 25.0 3P%
🧊 61.3 TS% | 52.8 eFG%
🧊 0.7 Off Rebounds
🧊 1.7 Fast Break Points
🧊 0 2nd Chance Points
🧊 2.3 Fouls | 6 Fouls Drawn
🧊 -19 /-
🗒️ Centers to average 6 APG in a single playoff run since 2000: Nikola Jokić (5x) and Karl-Anthony Towns (2026)
🗒️ Players in NBA history with 15 PTS & 10 AST while playing under 20 MIN in a playoff game Karl-Anthony Towns only
🗒️ Players averaging 15/10/5 on 60 eFG% this playoffs is Karl-Anthony Towns
🗒️ Players shooting 70% off passes from Karl-Anthony Towns vs the Philadelphia 76ers during the sweep
🗒️ Karl-Anthony Towns stats during the 7-0 win streak for the New York Knicks:
🇩🇴 15.7 Points | 9.6 Rebounds | 8.0 Assist
🇩🇴 26.3 MIN | 2.4 TOV | 1.1 BLK
🇩🇴 4.7 FGM | 7.9 FGA | 60.0 FG%
🇩🇴 5.1 FTM | 6.0 FTA | 85.7 FT%
🇩🇴 3.6 2PM | 5.4 2PA | 65.8 2P%
🇩🇴 2.4 3PM | 3.6 3PA | 47.1 3P%
🇩🇴 74.9 TS% | 67.3 eFG%
🇩🇴 2.6 OREB | 7.0 DREB
🇩🇴 0.7 Fast Break Points
🇩🇴 3.0 2nd Chance Points
🇩🇴 3.29 AST:TOV | 15.0 /-
🇩🇴 5.1 Fouls Drawn | 7-0 record
#AlwaysKnicks #Knicks #NyC #NY #NewYorkKnicks #KnicksNation #Mecca #KnicksTape #NYK #NBA #NBAPlayoffs #Playoffs #KnicksTwitter #Basketball #NBATwitter #KarlAnthonyTowns #KAT #Philly #DominicanRepublic #NikolaJokic #PlayoffStats #AdvancedStats #BasketballAnalytics #7Straight #76ers
1
3
12
997
May 3
👨🏾💻 Josh Hart is the most interesting matchup vs Philly on both ends because they can’t afford to put a wing on KAT and cross match. Atlanta tried it and got smoked. This puts extra importance on Hart’s regular season production vs the 76ers, his primary matchup data from this season, and his 2025 playoff impact vs 76ers:
💻 Josh Hart 2025 Playoff series stats vs the 76ers:
👨🏿🏭 16.8 points | FG%: 40.5% | FT%: 70%
👨🏿🏭 3P%: 43.2% on 6.2 Attempts
👨🏿🏭 12.3 rebounds | 3.7 Off Rebounds
👨🏿🏭 4.5 assists | 2.2 Turnovers Per
👨🏿🏭 0.7 Steals | 1.0 Block Per
👨🏿🏭 46.4 Minutes Per | /- -12
💻 Josh Hart Regular Season Stats vs 76ers in 3 games played he needs to shoot better vs the 76ers:
👨🏿🏭 7.0 Points Per Game
👨🏿🏭 10.0 rebounds
👨🏿🏭 7.3 assists | 1.7 Turnovers Per
👨🏿🏭 0.7 Steal Per | 0.3 Block Per
👨🏿🏭 FG%: 32% | 3P%: 33.3% | FT%: 33.3%
👨🏿🏭 33.2 Minutes Per Game | /- 25
💻 Josh primary matchups this season:
🛡️ Josh Hart ➡️ VJ Edgecombe
🔒 6:20 matchup mins | 29.1 poss
🔒 11 PTS allowed
🔒 5/11 FG (45.5%)
🔒 1/5 3PT (20.0%)
🔒 2 Assist | 0 Turnovers forced
🔒 0 Free Throws
🛡️ Josh Hart ➡️ Paul George
🔒 6:17 matchup mins | 37.4 poss
🔒 7 PTS allowed
🔒 2/7 FG (28.6%)
🔒 0/2 3PT (0.0%)
🔒 1 Assist | 0 Turnovers forced
🔒 3/3 Free Throws (100%)
#AlwaysKnicks #SNYK #NYK #NewYorkKnicks #KnicksTape #NY #KnicksNation #KnicksTwitter #basketball #NBATwitter #NBAPlayoffs #76ers🛎️ #newyork #NYC #MSG #AdvancedStats #JoshHart #Hoops #KnicksVsSixers #PhillyVsNY
1
7
967
Apr 28
🟢 Sloukas’ injury matters — and this is why.
Panathinaikos loses elite playmaking possessions.
Those touches now shift to Nunn, TJ Shorts, Grant & Osman.
NH Davis (not in the sample below) in playmaking from the low post is also key.
This scatter shows Assist/TO ratio vs Possessions —
More to come.
In collaboration and big thanks to my friend @hoopologyxx
#EuroLeague #paobc #Sloukas #AdvancedStats #Figurei8ht #F4GLORY
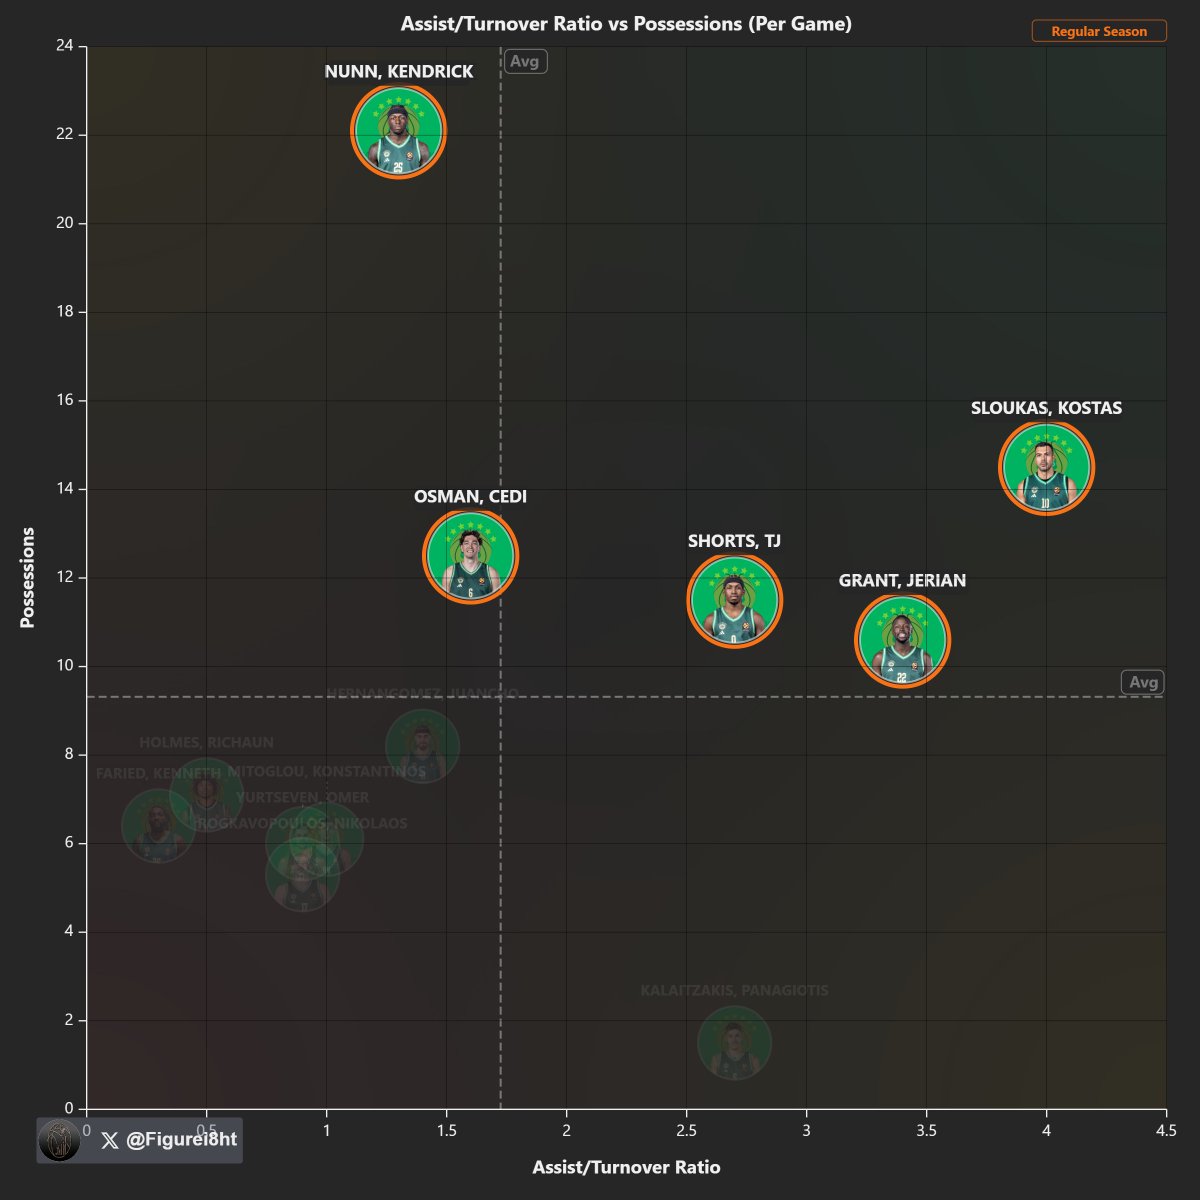
ALT Panathinaikos | Regular Season | Possessions and AST / TO Ratio
1
31
5,238

Apr 25
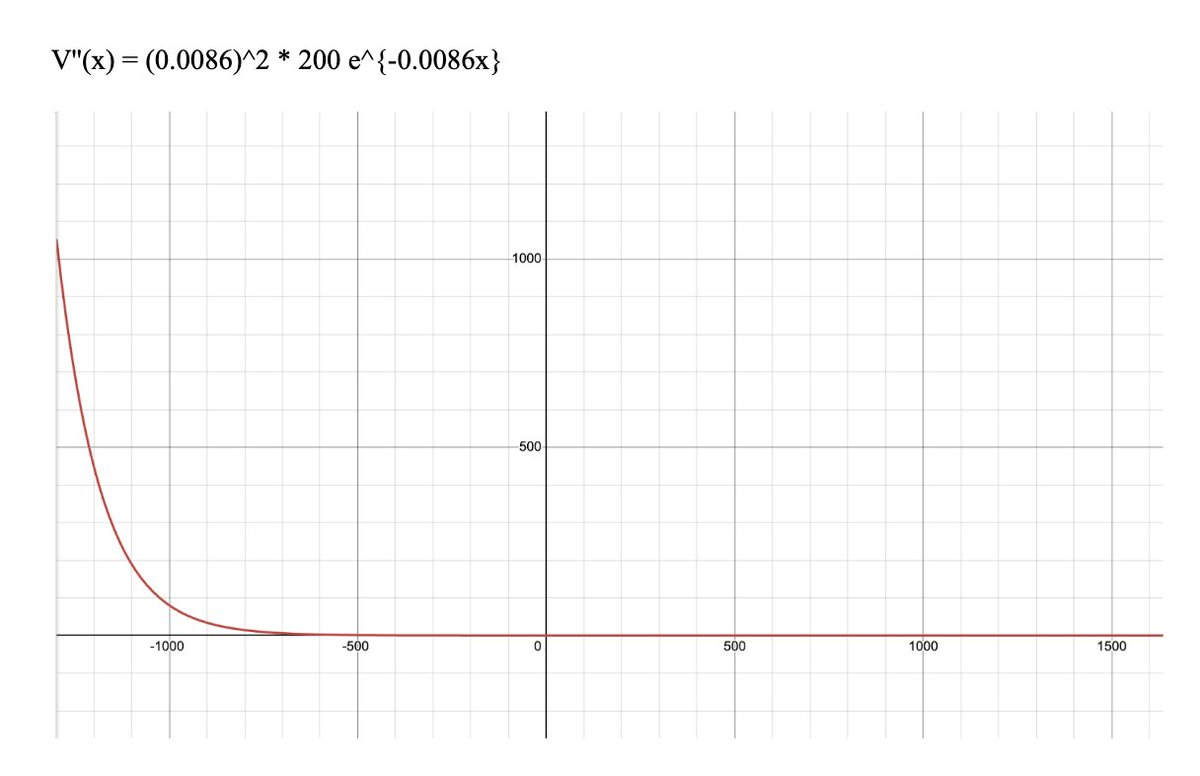
Most people misunderstand how injuries actually destroy player value.
If V′′(x)>0V''(x) > 0V′′(x)>0, the value curve is concave up — meaning the damage is real, but it slows down over time.
Early injuries hurt a LOT more than later ones.
Going from 0 → 100 days missed?
That can completely reset how teams view a player: durability concerns, contract risk, future projections all get rewritten overnight.
But 200 → 300 days missed?
Still bad — just not as surprising. The market has already priced in a lot of the downside.
That’s the key idea:
📉 Value keeps dropping
📉 But each new injury hurts less than the last
Economically, it’s “diminishing marginal damage.”
The first red flags change everything. Later ones mostly confirm what people already believe.
In sports economics, the biggest valuation shock isn’t injury #5 — it’s injury #1.
#SportsAnalytics #Economics #DataScience #BasketballAnalytics #FootballAnalytics #SportsEconomics #InjuryAnalysis #AdvancedStats
3
32
Apr 24
🎬 Karl Anthony Towns aka Leon Rose scapegoat this summer is actually the best player during this series vs the Hawks:
🇩🇴 Karl Anthony Towns vs Hawks:
🇩🇴 21.3 Points | 11.0 Rebounds | 3.3 Ast
🇩🇴 7.0/12.3 FG (56.8%)
🇩🇴 5.3/5.3 FT (100%)
🇩🇴 2.0 3PM | 4.0 3PA (50%) | 72.7 TS%
🇩🇴 1.0 Steal | 2.3 Blocks | 3.7 Turnovers
🇩🇴 3.0 Offensive Rebounds
🇩🇴 4.0 fouls drawn per game
🇩🇴 33.5 Minutes Per Game
📈 Kat 2nd Half of games vs Hawks past 3 games:
🇩🇴 15.3 Points | 6.3 Rebounds | 1.0 Ast
🇩🇴 4.7/7.7 FG (60.9%) | 4.0/4.0 FT (100%)
🇩🇴 2.0/3.0 3PM (66.7%) | 81.3 TS%
🇩🇴 1.7 Off Rebounds | 4.7 Def Rebounds
🇩🇴 0.3 Steal | 1.0 Blocks Per | 1.7 Tov
🇩🇴 3.7 Second Chance Points
🇩🇴 5.7 /- | 73.9 eFG%
🇩🇴 18.0 Minutes Per Game
#NewYorkForever #Knicks #NYKnicks #KAT #KarlAnthonyTowns #NBATwitter #NBAPlayoffs #KnicksNation #NY #KnicksTape #MSG #NYC #Basketball #Hoops #AdvancedStats #NBAstats
#truetoatlanta #atlanta #ATLvsNyK
1
1
5
628

Apr 18
Genera más... eso es debatible
No?
Toma los 25 pts de Wemby y los -20 que no anota el contrario por su presencia quedamos en 5
Toma los 27 de Jokic, mas los muy probables 22 pts de ast y ok, Jokic probablemente permite 25, hasta 30 pts en defensa
Sigue en 17 y sin advancedstats
2
18
986
Apr 15
👨🏾💻 Stats I love this season from Jordan Clarkson & Landry Shamet:
🇵🇭 Jordan Clarkson Stats This Season:
🇵🇭 C&S 3P%: 35.5%
🇵🇭 0 Dribble 3P%: 35.3%
🇵🇭 6 Feet Wide Open: 37.1%
🇵🇭 FG%: 45.1%
🇵🇭 /-: 1.5 (Highest in 3 years)
🇵🇭 Def Rating: 111.7
🇵🇭 Usage: 20.3
💻 Play Type (Frequency) Success Jordan Clarkson:
🔵 Cut (6.8%) | PPP: 1.54
🔵 Putback (5.2%) | PPP: 1.40
🔵 Transition (23.6%) | PPP: 1.10
💻 Advanced Stats (Jordan Clarkson Databallr.com):
🧠 ORAPM: 1.0 (90th percentile
🧠 oREB: 0.8 (92nd percentile offensive rebounding impact in points per 100 possessions)
🧠 OREB%: 5.0% (85th percentile Offensive rebound percentage on team missed field goals while on the floor)
🧠 SMR% (Short Mid-Range): 51.2% (95th percentile)
🧠 Grenade Frequency: 14.4% (97th percentile)
🧠 Net Rating (On Court): 4.6 (72nd percentile)
🇺🇸 Landry Shamet stats this season:
🇺🇸 3P%: 39.2% | C&S 3P%: 41.5%
🇺🇸 Wide-Open 3s: 45.3%
🇺🇸 Def Rating: 107.0 | Net Rating: 8.1
🇺🇸 ⬅️ Corner 3P%: 36.1%
🇺🇸 Center Court 3P%: 38.8%
📈 Advanced Impact:
🧠 DPM: 0.6 (81st percentile)
🧠 DRAPM: 0.8 (81st percentile)
🧠 RAPM: 0.6 (78th percentile)
📈 Per 75 Stats:
🧠 PTS: 15.1
🧠 TOV: 1.0 (90th percentile)
🧠 STL CHG: 1.8 (72nd percentile Forced Turnovers)
🧠 Stop %: 2.7% (70th percentile STOP% totals the plays that most clearly end possessions for the defense: steals, offensive fouls drawn, and blocks that the defense recovers)
🧠 TS%: 60.1% (71st percentile)
🧠 3PA: 8.3 (81st percentile)
🧠 RIM%: 68.9% (67th percentile)
🧠 LMR%: 55.0% (90th percentile FG% From Long Midrange)
🧠 cTOV%: 5.8% (90th percentile Creation adjusted Turnover Percentage: Turnovers divided by Offensive Load. Better than regular TOV% for players who pass a lot or have highly assisted shots)
🧠 RECOV%: 88.9% (96th percentile Block Recovery Percentage: Percentage of blocks that result in a rebound)
🧠 RDRTG On Court: 6.4 (89th percentile)
👨🏾💻 Playtypes (Frequency) Success
🔵 Off-Screen (3.2%) | PPP 1.69
🔵 Roll-Man (4.0%) | PPP 1.31
🔵 Cut (4.2%) | PPP 1.29
🔵 Transition (18.4%) | PPP 1.28
🔵 Hand-Off (6.7%) | PPP 1.18
🔵 Spot (51.6%) | PPP 1.01
🗣️ Jordan Clarkson and Landry Shamet give the Knicks bench steady scoring and spacing through efficient shot-making and off-ball production. Clarkson brings creation and chaos scoring with a 20.3 usage rate, elite short mid-range efficiency (51.2% SMR, 95th percentile), strong transition impact (1.10 PPP), and real offensive value creation with 1.0 ORAPM and strong offensive rebounding impact ( 0.8 oREB, 92nd percentile). Shamet complements that with elite catch-and-shoot gravity (41.5% C&S 3P%, 45.3% wide-open), high-volume spacing (8.3 3PA), and strong efficiency (60.1% TS%) while maintaining positive impact metrics like 0.6 RAPM and 8.3 on-court net rating. Together, they balance creation and spacing. Clarkson generates shots, Shamet punishes help defense and that combination stabilizes bench offense with consistent efficiency and floor spacing.
#newyorkforever #SNYK #NYKx #NYK #LandryShamet #NBA #NBATwitter #BasketballTwitter #Knicks #NYC #NewYorkKnicks #ThreePointShooter #jordanclarkson #EliteShooter #Spacing #FloorSpacing #AdvancedStats #RAPM #DPM #ORAPM #DRAPM #NetRating
1
2
855
Apr 15
👨🏾💻 Stats I love from Mohamed Diawara rookie season:
🇫🇷 3P%: 36.9% | On Rating 58
🇫🇷 C&S 3P%: 38.5% | Wide Open: 37%
🇫🇷 Def Rating: 106.7 | Def FG%: 46.1%
🇫🇷 TS%: 54.9% | FT%: 75%
🇫🇷 Points per 3FG: 1.11 | 2P FG%: 50.6%
💻 Mohamed Diawara Shot By Area (3stepsbasket.com)
📍 Shot by Area (2PT):
🇫🇷 Left 10 Attempts
🧮 6 Made | 60% FG
🇫🇷 Center 66 Attempts
🧮 31 Made | 47% FG
🇫🇷 Right 7 Attempts
🧮 5 Made | 71.4% FG
📍 Shot by Area (3PT):
🇫🇷 Left Corner 49 Attempts
🧮 19 Makes | 38.8% 3P%
🇫🇷 Center 9 Attempts
🧮 1 Make | 11.1% 3P%
🇫🇷 Right Corner 72 Attempts
🧮 28 Makes | 38.9% 3P%
📈 Elite impact metrics (Databallr.com):
🧠 RAPM: 0.5 (76th %)
🧠 DRAPM: 1.1 (85th %)
🧠 On-Court Net: 10.6 (94th %)
🧠 On/Off: 3.5 (77th %)
🧠 Recov%: 66.7 (76th %)
📊 Per 75 production (Databallr.com):
🧠 14.8 Points | 5.7 REB
🧠 8.1 AST PTS
🧠 1.1 STL CHG | 1.7 DEFL
🧠 1.8 TOV (elite control)
🧩 Mohamed Best Lineups:
🧍🏾♂️ Brunson–Clarkson–OG–Diawara–Robinson: 185.3 OFF | 81.3 DEF | 104.0 NET
🧍🏾♂️ Alvarado–Hart–Shamet–Diawara–Towns: 150.0 OFF | 113.6 DEF | 36.4 NET
🧍🏾♂️ Brunson–Shamet–Bridges–Diawara–Robinson: 104.0 OFF | 77.8 DEF | 26.2 NET
🧍🏾♂️ Brunson–Hart–Shamet–Diawara–Hukport: 124.1 OFF | 100.0 DEF | 24.1 NET
🧍🏾♂️ Alvarado–Bridges–OG–Diawara–Towns: 125.9 OFF | 108.6 DEF | 17.2 NET
🗣️ Mohamed Diawara’s rookie season pops with efficiency, impact, and lineup value all aligning at once: he shot 36.9% from deep with strong context splits (38.5% catch-and-shoot, 37% wide open) while maintaining a 54.9% TS% and solid 75% FT touch, showing scalable scoring efficiency. Defensively he graded as a positive two-way wing with a 106.7 defensive rating and 46.1% defensive FG allowed, matching his advanced impact profile where he posted 1.1 DRAPM and ranked in the 85th percentile defensively. The real separator is his on-court impact ( 10.6 net, 94th percentile) backed by controlled usage (1.8 TOV per 75) and steady all-around production (14.8 PTS, 5.7 REB per 75), which translates directly into elite lineup outcomes multiple units with him ranged from 17 to a massive 104 net rating, showing his ability to scale from role play to high-leverage lineups without breaking offensive flow or defensive structure.
#NewYorkForever #NYK #Knicks #KnicksNation #KnicksTape #SNYK #NBATwitter #NBA #Basketball
#MohamedDiawara #Diawara #NYKx #analytics #NBAStats #NBAstats #AdvancedStats #rookie
#newyorkknicks #mecca #francebasketball
2
9
1,998
Apr 13
👨🏾💻 Stats I love from Karl-Anthony Towns this season:
🇩🇴 FG%: 50.1% | FT: 85.8%
🇩🇴 Rebounds: 11.9 | Off Rebounds: 3.1
🇩🇴 C&S 3P%: 36.9%
🇩🇴 Wide Open 3s: 40.7%
🇩🇴 Total Rebounds: 889
🇩🇴 TS%: 61.9%
📊 Elite Advanced Metrics (Databallr.com):
🧠 DPM: 2.6 (96th %ile)
🧠 O-DPM: 2.1 (96th %ile)
🧠 RAPM: 2.1 (90th %ile)
🧠 ORAPM: 2.3 (96th %ile)
🧠 On-Court Net RTG: 7.1 (86th %ile)
🧠 On-Court ORTG: 5.8 (94th %ile)
🧠 On-Off (Off impact): 3.8 (88th %ile)
🧠 DRB%: 27.7% (99th %ile)
🧠 D-DPM: 0.5 (76th %ile)
🧠 Loose Balls: 0.5 (87th %ile)
🧠 ONBALL: 12.3% (83rd %ile)
📊 Crafted (CraftedNBA.com):
🔒 True Shooting %: 61.6% (82nd %ile)
🔒 Shot Quality (SQ): 68.9 (88th %ile)
🔒 Free Throw Rate: 40.4% (89th %ile)
🔒 Load: 38.6 (81st %ile)
🔒 Creation: 5.9 (81st %ile)
🔒 Portability: 8.3 (91st %ile)
🔒 CraftedOPM: 2.0 (92nd %ile)
📊 Efficiency & Scoring Profile:
🔵 Roll-Man (13.6%): 1.37 PPP
🔵 Cut (6.1%): 1.41 PPP
🔵 Transition (15.2%): 1.21 PPP
🔵 Spot-Up (17.9%): 1.11 PPP
🔵 Putback (13.6%): 1.06 PPP
🔵 Handler (2.2%): 1.31 PPP
🗣️ 50.1% FG and 61.9% TS with 85.8% from the line is elite efficiency for a high-usage big, and Karl-Anthony Towns pairs that with real volume production (11.9 rebounds, 3.1 offensive boards, 889 total). The shooting versatility (36.9% C&S 3s, 40.7% wide open 3s) forces defenses to guard him everywhere, opening up his inside game and play finishing (1.37 PPP roll-man, 1.41 PPP cuts, 1.31 PPP as a handler). Impact metrics back it up 2.6 DPM, 2.1 O-DPM, 2.3 ORAPM all in the 90th percentiles with a 7.1 net rating and 5.8 offensive rating on court. Add elite rebounding (27.7% DRB, 99th %ile), strong offensive load (38.6), creation (5.9), and a 2.0 CraftedOPM (92nd %ile), and you’re looking at a true offensive engine big who combines scoring, spacing, rebounding, and scalable impact at a near-elite level.
#NewYorkForever #NYK #Knicks #KnicksTape #KnicksNation #KAT #KarlAnthonyTowns #Towns #NYC #NBATwitter #NBA #NY #StretchBig #EliteBig #OffensiveEngine #NBA #AdvancedStats #BasketballAnalytics #Hoops #Efficiency #newyork
2
8
706
Apr 12
👨🏾💻 Stats I love from 🦠 Mikal Bridges season:
🌉 Def Field Goal %: 45.8%
🌉 3P%: 37.1% | C&S 3P%: 37.5%
🌉 Wide Open 3P%: 39.0%
🌉 Wide Open 2P FG%: 73.6%
🌉 FG%: 49%
🌉 Off Rating: 118.1 | Ast: 3.8
🌉 Ast%: 15.8% | Ast/TO: 3.66
🌉 Steals: 1.3 | Blocks: 0.8
📊 Mikal Matchups holding player under 40% on the season (NBA.com):
🚳 Desmond Bane: FG% 35.3%
🚳 Donovan Mitchell: FG% 35.0%
🚳 Andrew Wiggins: FG% 18.2%
🚳 Devin Booker: FG% 33.3%
🚳 Kon Knueppel: FG% 25%
🚳 Brandon Miller: FG% 0%
📊 Elite Impact Metrics (Databallr.com):
🧠 sTOV%: 4.0% (86th %ile)
🧠 PASSTOV: 7.9% (96th %ile)
🧠 ASTEFG: 0.8 (91st %ile)
🧠 oTS: 0.9 (93rd %ile)
🧠 rTS%: 1.0% (67th %ile)
🧠 STL: 1.9 (68th %ile)
🧠 BLK: 1.2 (90th %ile)
🧠 STOP%: 3.0% (80th %ile)
📊 Advanced (CraftedNBA.com)
🔒 cTOV%: 5.2% (96th %ile)
🔒 Portability: 8.4 (92nd %ile)
🔒 Passer Rating: 56.2 (84th %ile)
🔒 CraftedOPM: 0.8 (83rd %ile)
🔒 CraftedDPM: 0.8 (74th %ile)
🔒 rPF: -1.4 (97th %ile)
📊 Play Types & Efficiency:
🔵 Cut (7.5%) | PPP 1.49
🔵 Putback (2.7%) | PPP 1.33
🔵 Transition (24.7%) | PPP 1.31
🟠 Spot Up Shooting (35.9%) | PPP 1.08
🟠 Hand-Off (6.3%) | PPP 1.02
🟠 Isolation (2.2%) | PPP 1.00
🗣️ 49% FG, 37.1% from three (37.5% C&S, 39.0% wide open) and an elite 73.6% on wide open 2s shows how efficient Mikal Bridges is when he’s playing within the offense. Pair that with a 118.1 Off Rating, 3.8 assists, 15.8% AST% and a 3.66 AST/TO ratio elite ball security (4.0% sTOV, 96th %ile cTOV) and you’re getting high-level decision making every possession. His scoring profile (1.49 PPP cuts, 1.31 PPP transition, 1.08 PPP spot-ups) proves he maximizes touches without needing creation, while still adding defensive playmaking (1.3 STL, 0.8 BLK, 3.0% STOP%).
#NewYorkForever #NYK #Knicks #KnicksTape #KnicksNation #NBA #NBATwitter #MikalBridges #Bridges #NYC #NYKx #NY #AdvancedStats #BasketballAnalytics #Hoops #Basketball #NewYork #NY #SNYK
1
1
3
959
Apr 12
👨🏾💻 Stats I love from Mitchell Robinson season:
🧌 Games Played: 60 (best in 4 years)
🧌 Rebounds Per: 8.8
🧌 Steals: 0.9 | Blocks: 1.2
🧌 Def Rebounding %: 22.7%
🧌 Off Rebounding %: 20.1%
🧌 Rebounding %: 21.4%
🧌 Def Rating: 109.9
🧌 Def Field Goal%: 44.3%
🧌 Net Rating: 7.8 | - 2.6
🧌 Only NBA player 20% Rate in all Rebounding Stats
🧌 Mitch • Brunson • Diawara • Clarkson • OG: Net 104.0 | Off Rating 185.3
📊 Elite Impact Metrics (Databallr.com):
🧠 D-DPM: 2.6 (99th %ile)
🧠 DPM: 2.4 (96th %ile)
🧠 RAPM: 2.0 (90th %ile)
🧠 DRAPM: 1.2 (86th %ile)
🧠 rTS%: 9.9% (87th %ile)
🧠 FTR: .50 (84th %ile)
🧠 STL: 2.4 (97th %ile)
🧠 BLK: 3.0 (81st %ile)
🧠 STOP%: 4.3% (97th %ile)
🧠 DEFL: 5.5 (98th %ile)
🧠 ORB (Own Miss): 31.9% (99th %ile)
🧠 ORB (Team Miss): 21.1% (100th %ile)
📊 Advanced (CraftedNBA.com)
🔒 Block%: 5.3 (94th %ile)
🔒 CraftedDPM: 2.1 (94th %ile)
🔒 raDTOV: 0.9 (96th %ile)
🔒 Rim Frequency: 45.5% (91st %ile)
📊 Play Types & Efficiency:
🔵 Transition (4.7%) | 1.77 PPP
🔵 Roll Man (15.6%) | 1.70 PPP
🔵 Cut (18.7%) | 1.67 PPP
🟠 Putbacks (44.4%) | 1.01 PPP
🗣️ Mitchell Robinson played 60 games (most in 4 years) and anchored everything inside: 8.8 REB with elite 22.7% DREB, 20.1% OREB, and 21.4% total REB while being the only NBA player above 20% in all three. He added 0.9 STL, 1.2 BLK, held opponents to 44.3% FG, and posted a 109.9 DRTG with a 7.8 NET. Impact metrics back it up: 2.6 D-DPM (99th %ile), 2.4 DPM (96th), 2.0 RAPM (90th), with elite activity (5.5 deflections, 97th STL rate, 81st BLK rate). He dominated the glass (31.9% own-miss ORB, 99th; 21.1% team-miss ORB, 100th) and finished efficiently ( 9.9 rTS%, .50 FTR). Lineups with Mitch–Brunson–Diawara–Clarkson–OG exploded ( 104 NET, 185.3 ORTG), showing his rim protection, rebounding, and low-usage finishing (1.77 PPP transition, 1.67 PPP cuts) directly drive winning
🎬 Mitchell Robinson plays from this season⏬⏬⏬⏬⏬⏬⏬⏬⏬⏬
#NewYorkForever #Knicks #NYK #KnicksTape #NBATwitter #NBAStats #MitchRobinson #Defense #NBA #RimProtection #AdvancedStats #NYC #NY #stats #newyork #blocks #moneymitch #MR
1
10
34
4,501
Apr 4
🗽 New York Knicks: 49–28
🇩🇴 KAT vs 🐻 Grizzlies
🇩🇴 20 Points | 8/12 FG (66.7%)
🇩🇴 8/12 2P (66.7%) | 0/0 3P (0%)
🇩🇴 4/5 FT (80%)
🇩🇴 11 Rebounds (6 OREB | 5 DREB)
🇩🇴 11 Assists | 7 Turnovers
🇩🇴 0 Steals | 1 Block
🇩🇴 5 Fouls Drawn | 3 Fouls
🇩🇴 29.5 MIN | 5 /−
🇩🇴 70.4 TS% | 66.7 eFG%
🧾 Reasons Why Knicks Won:
🗒️ Mikal Bridges added 24 points as the New York Knicks snapped their 3-game losing streak
🗒️ Knicks came out hot, missed just 2 of their first 15 shots. Dominated early with 22 points in the paint and an 11-2 rebounding edge in the 1st quarter. Shot 71% from the field and 7/10 from three in the first half, took a 79-62 lead into halftime
🗒️ The 79 first-half points were a season-high for New York and just shy of the 83 they dropped in a half vs Minnesota earlier this season. Memphis Grizzlies got crushed on the glass 49-20, with those 20 rebounds being a franchise low
🗒️ Grizzlies made a push and cut it to 90-87 in the 3rd, but Knicks responded and pushed it back to 99-90 going into the 4th
🗒️ Memphis bench gave them nothing, Bal, Mashack, Burton, Clayton Jr and Jarreau combined for a brutal -77
#Knicks #NewYorkKnicks #NYK #KnicksNation #NBA #NBATwitter #Basketball #Hoops #KnicksWin #MikalBridges #DefenseWins #SNYK #Rebounding #BoxScore #NYKx #AdvancedStats #DataBallr #DraftBallr #SNYK #EastStandings #NYC #NY
1
3
417
Mar 31
📰 Why the hell Josh Hart continues to start?
💻 Current starting 5:
Josh • KAT • Jalen Brunson • OG Anunoby • Mikal Bridges
📉 This season: -0.2 NET in 437 MIN
🍗 Def Rating: 116.7
📉 Last season: 1.6 NET in 843 MIN
🍗 Def Rating: 117.1
💻 The Miles McBride starting 5 doesn’t work either the McBride/Brunson backcourt too small
💻 McBride • Brunson • Bridges • OG • Kat: 134.1 OFF RTG | 133.9 DEF RTG
📊 0.2 NET (86 MIN)
📝 The 2 starting 5s that work:
📝 With Mitchell Robinson
Brunson • Bridges • OG • Robinson • KAT
📊 123.7 OFF | 110.9 DEF
📊 12.8 NET (50 MIN)
📝 With Diawara
Brunson • Bridges • OG • Diawara • KAT
📊 117.9 OFF | 109.0 DEF
📊 9.0 NET (30 MIN)
📈 4-man units that work:
📝 Brunson • Robinson • KAT • McBride
📊 111.1 OFF | 75.0 DEF
📊 36.1 NET
📝 Brunson • Hart • Robinson • KAT
📊 125.0 OFF | 102.6 DEF
📊 22.4 NET
📝 Brunson • OG • Robinson • KAT
📊 122.6 OFF | 107.8 DEF
📊 14.8 NET
📝 Brunson • Clarkson • Diawara • Robinson
📊 138.3 OFF | 107.0 DEF
📊 31.2 NET
📝 Brunson • Bridges • Diawara • KAT
📊 127.5 OFF | 103.3 DEF
📊 24.2 NET
📝 Bridges • OG • Diawara • KAT
📊 124.8 OFF | 102.5 DEF
📊 22.4 NET
📝 Brunson • OG • Diawara • Robinson
📊 141.2 OFF | 122.1 DEF
📊 19.1 NET
🎬 Video of the 1997 Knicks player introductions during the playoffs⏬
#newyorkforever #NewYorkKnicks #NYK #KnicksNation #KnicksTape #SNYK #KnicksTwitter #NBA #NBATwitter #NBARotation #NBAStats #NYKx #NYK #AdvancedStats #BasketballAnalytics #Lineups #newyork #NYC #NYKnicks #NY
3
2
10
3,939

Mar 25
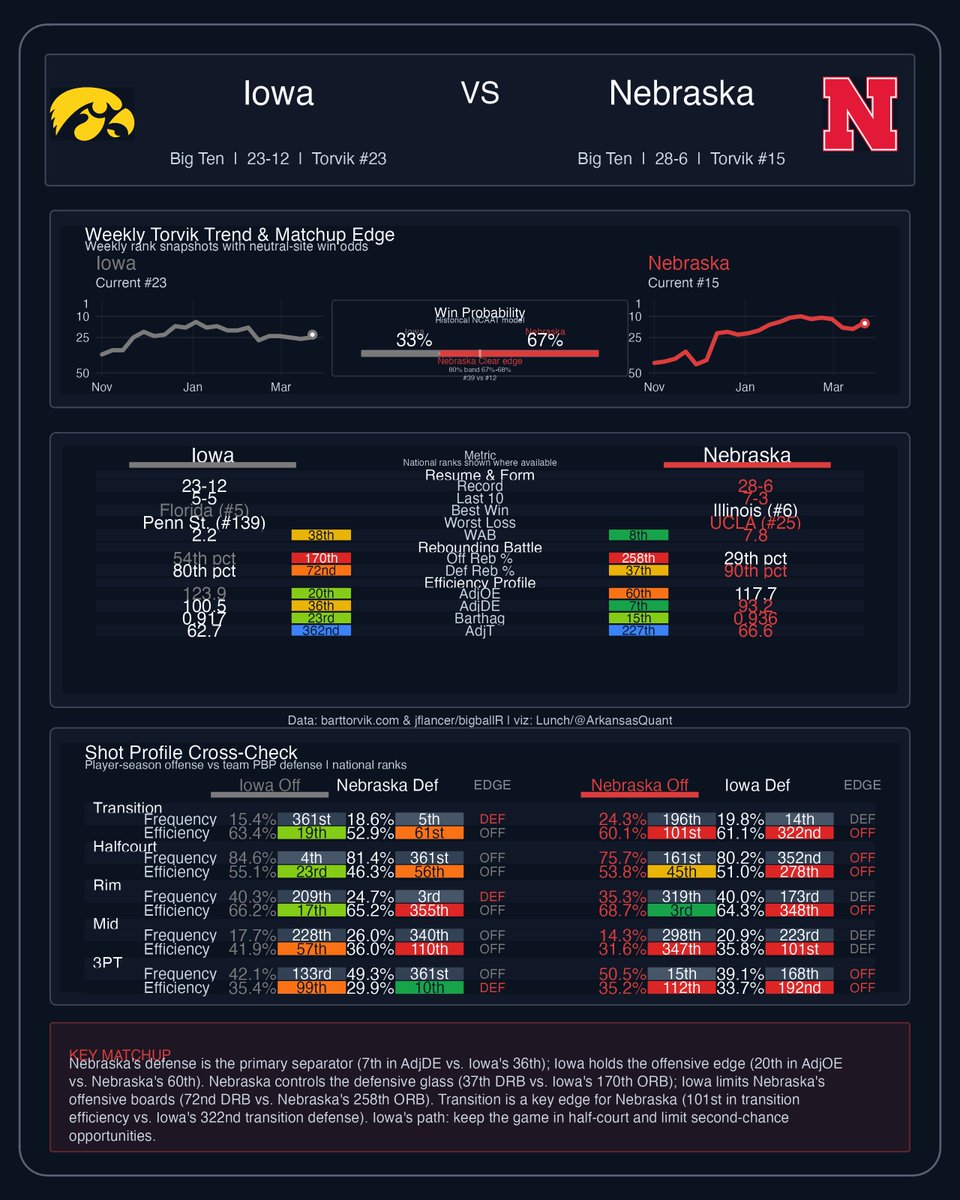
🏀 Sweet 16 Matchup Preview — Iowa vs. Nebraska
▪️ Nebraska (28-6, Torvik #15) is a 67% win probability favorite over Iowa (23-12, Torvik #23)
▪️ Nebraska's defense is the separator: 7th in AdjDE vs. Iowa's 36th
▪️ Iowa holds the offensive edge (20th in AdjOE vs. Nebraska's 60th) — the Hawkeyes need to make this a shootout
▪️ Nebraska controls the defensive glass (37th DRB vs. Iowa's 170th ORB) and holds the transition edge (101st efficiency vs. Iowa's 322nd transition defense)
Data: barttorvik.com & jflancer/bigballR | viz: Lunch/@ArkansasQuant
#Sweet16 #MarchMadness #Hawkeyes #GBR #Huskers #IowaBasketball #NebraskaBasketball #NCAATournament #CollegeBasketball #CBB #BigTen #B1GTourney #Torvik #AdvancedStats #MarchMadness2026
@IowaHoops @HuskerHoops @HawkCentral @HawkeyeReport @ScottDochterman @InsideNebraska @NebraskaOnBTN @MarchMadnessMBB @JonRothstein @GoodmanHoops @CBBonFOX @BarttorVik
1
2
1,386
Mar 25
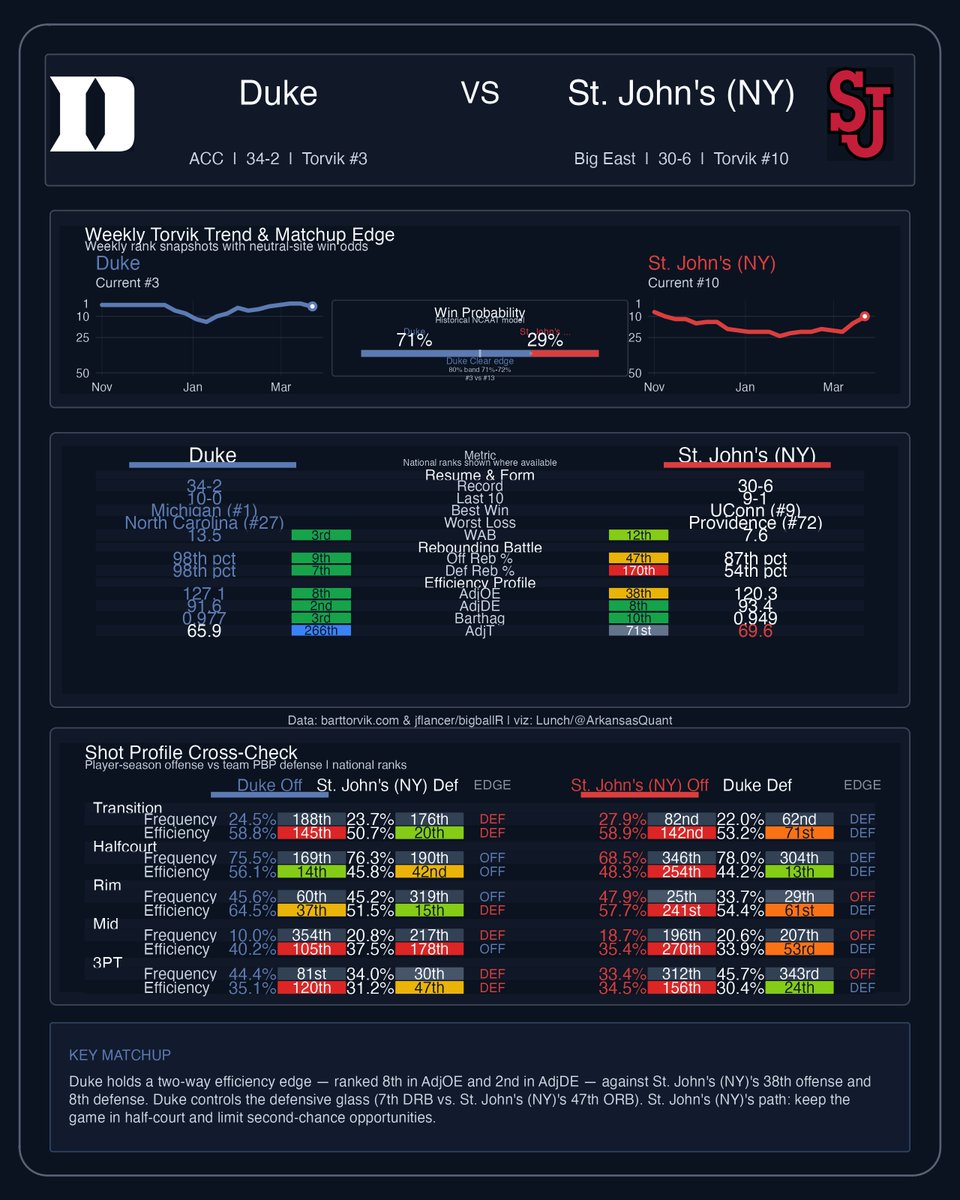
🏀 Sweet 16 Matchup Preview — Duke vs. St. John's (NY)
▪️ Duke (34-2, Torvik #3) is a 71% historical win probability favorite over St. John's (30-6, Torvik #10)
▪️ Duke holds a two-way efficiency edge: 8th in AdjOE and 2nd in AdjDE vs. St. John's 38th offense and 8th defense
▪️ Duke controls the defensive glass (7th DRB vs. St. John's 47th ORB)
▪️ St. John's path: keep the game in half-court and limit transition opportunities
Data: barttorvik.com & jflancer/bigballR | viz: Lunch/@ArkansasQuant
#Sweet16 #MarchMadness #GoDuke #WeAreNewYork #DukeBasketball #StJohns #NCAATournament #CollegeBasketball #CBB #BluDevils #RedStorm #ACC #BigEast #Torvik #AdvancedStats
@DukeMBB @StJohnsBBall @DukeReport @TheDukeNation @DukeNBA @UpdateDuke @RumsInTheGardn @StormThePaint @John_Fanta @dukebasketball @MarchMadnessMBB @JonRothstein @GoodmanHoops @CBBonFOX @BarttorVik
2
6
676