
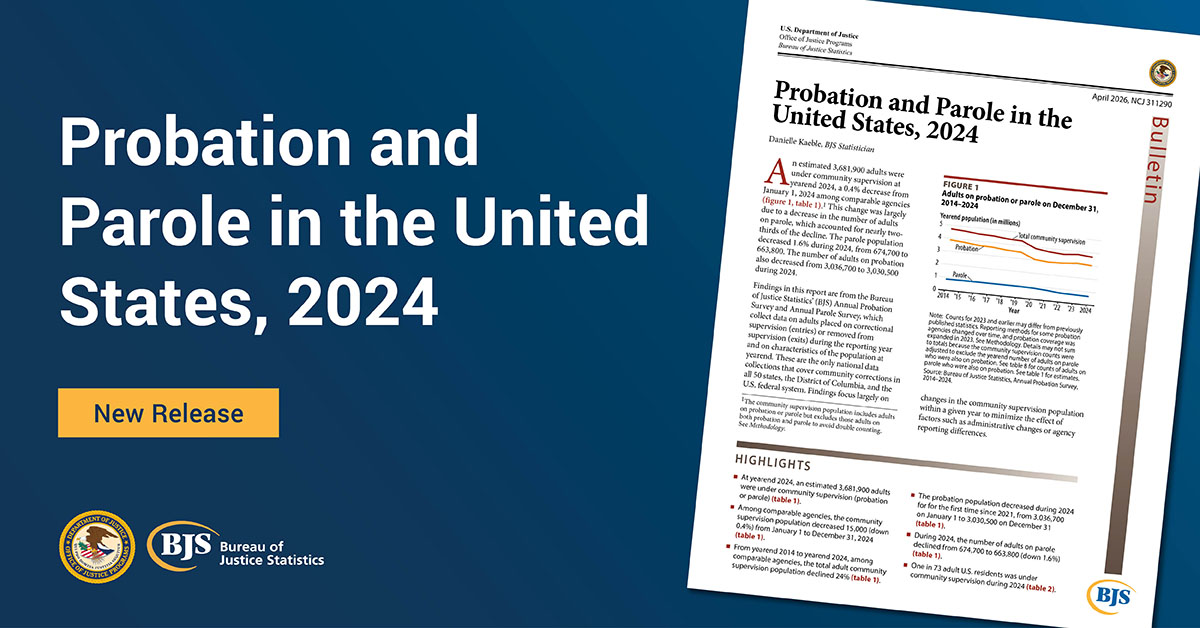
ALT Graphic with a navy-blue background and bold white text on the left reading: "Probation and Parole in the United Sates, 2024." Below this text appears "New Release" in a gold box. A picture of the report appears on the right side of the graphic. The OJP seal and BJS logo appear at the bottom left.


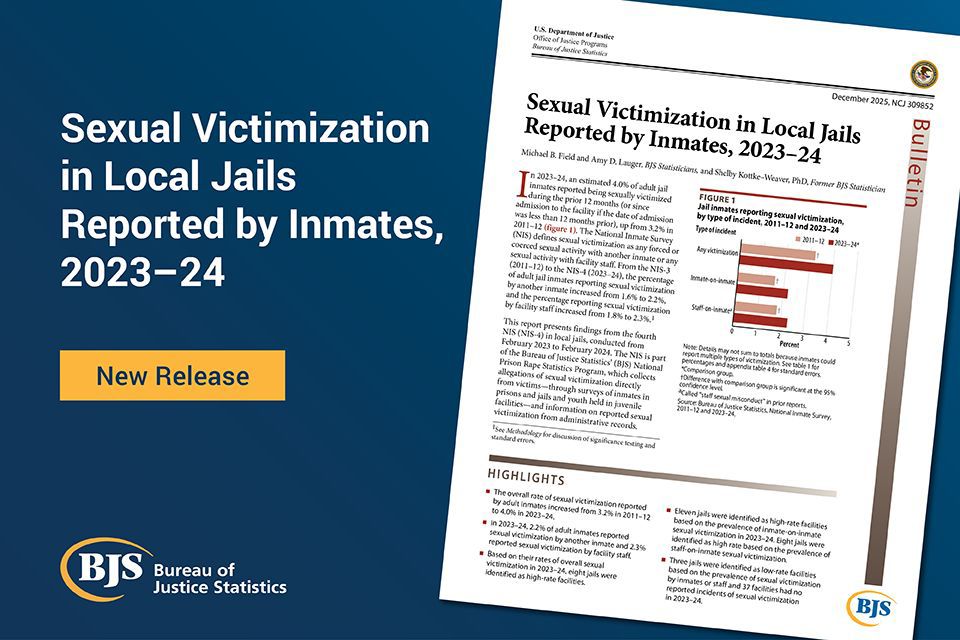
ALT BJS pub card titled, "Sexual Victimization in Local Jails Reported by Inmates, 2023–24" with a screen capture of the report's cover page.

ALT BJS pub card for Jails Report Series: 2024 Preliminary Data Release with a “view report” button.

ALT BJS graphic for the Survey of Prison Inmates Questionnaire Crosswalk Data Tool.
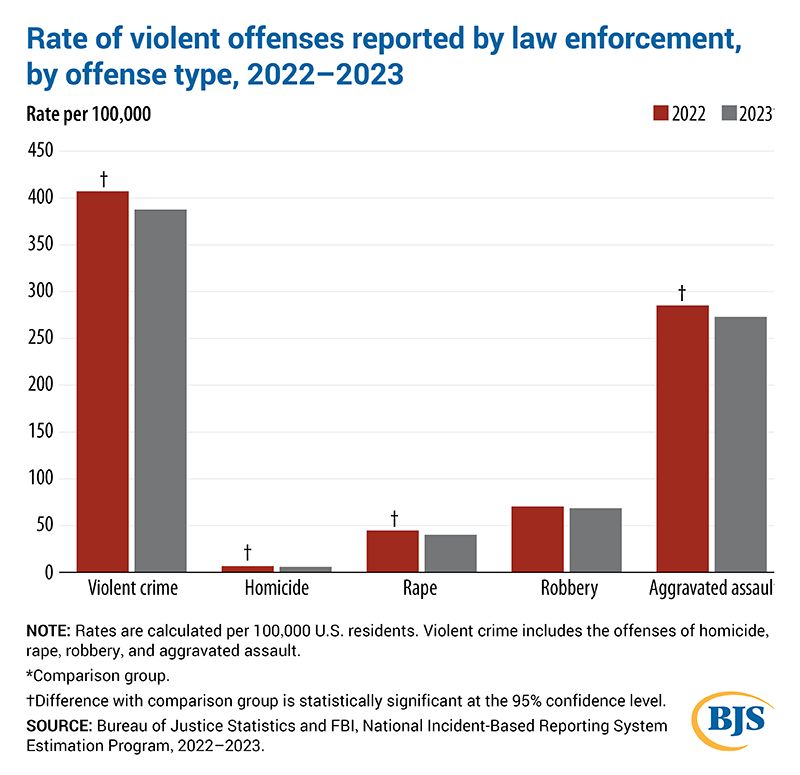
ALT Bar chart showing rates of violent offenses reported by law enforcement per 100,000 U.S. residents, comparing 2022 (red bars) and 2023 (gray bars) across five categories. Violent crime overall: 401.9 in 2022, 385.2 in 2023. Homicide: 6.3 in 2022, 5.7 in 2023. Rape: 40.0 in 2022, 35.2 in 2023. Robbery: 65.5 in 2022, 65.1 in 2023. Aggravated assault: 279.7 in 2022, 269.1 in 2023. Daggers indicate statistically significant differences at 95% confidence level for violent crime overall, homicide, rape, and aggravated assault.

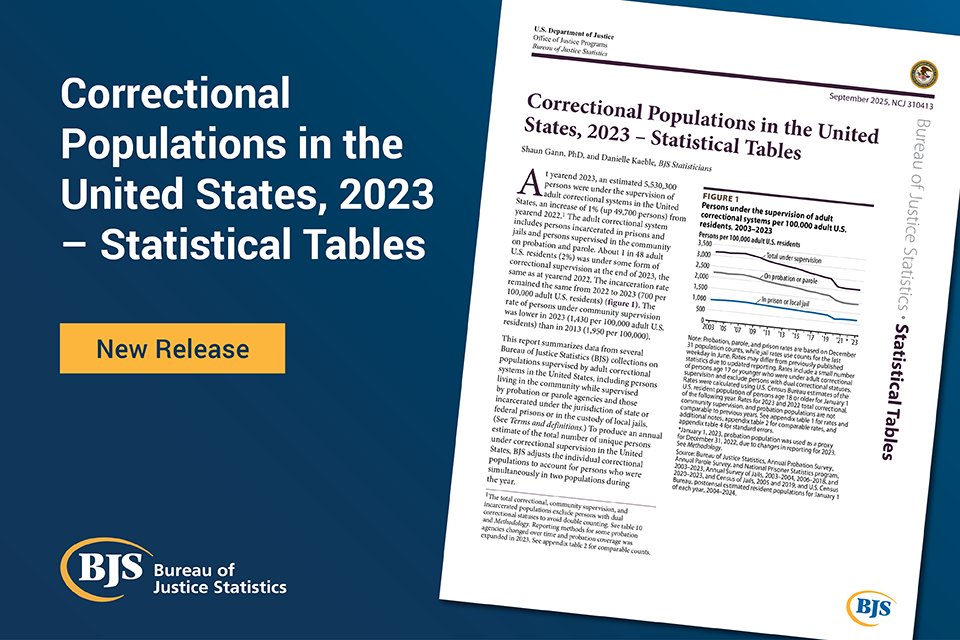
ALT BJS pub card for Correctional Populations in the United States, 2023 – Statistical Tables with a “new release” button.

ALT BJS graphic for the National Crime Victimization Survey Data Dashboard (N-DASH) Updated with 2024 Data with five icons and four people around a data chart. The icons say, “characteristics of victims, display and filter settings, analysis type, comparison view, and units of measurement.”

ALT BJS NACJD Datasets graphic
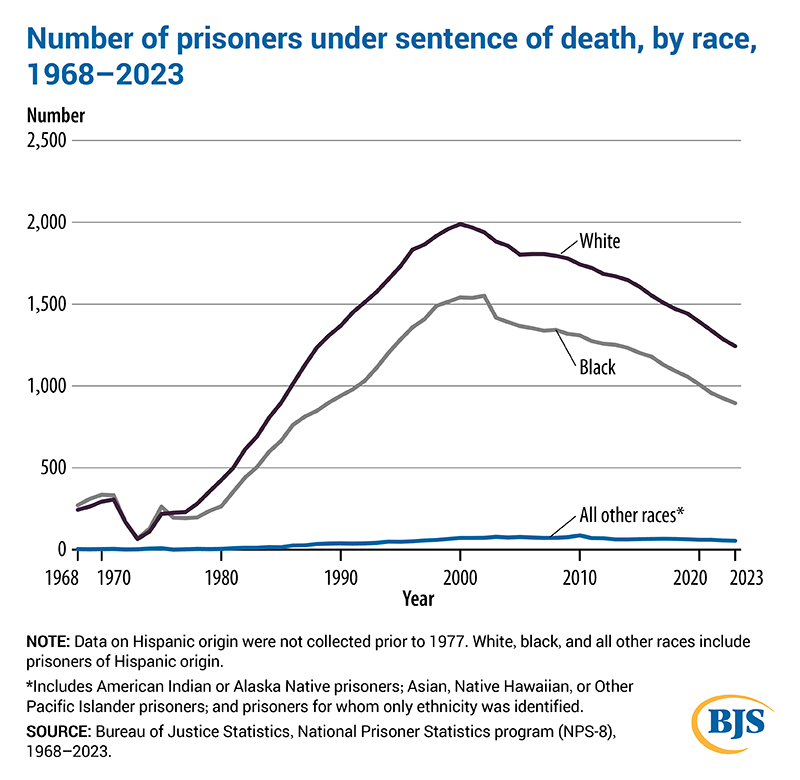
ALT Line graph showing the number of prisoners under sentence of death by race. The line for white prisoners under sentence of death starts at 243 in 1968, drops to 64 in 1973, and then generally increases before reaching 1,989 in 2000. The number then decreases over time, ending at 1,286 in 2022. The line for black prisoners under sentence of death follows a similar pattern, starting at 271 in 1968, dropping to 68 in 1973, increasing to 1,551 in 2002, and then decreasing over time to 927 in 2022. The line for all other races (American Indian or Alaska Native prisoners; Asian, Native Hawaiian, or Other Pacific Islander prisoners; and prisoners for whom only ethnicity was identified) starts at 3 in 1968 and generally increases over time to 87 in 2010, before decreasing to 57 in 2022.
ALT BJS third-party graphic for the Survey of Inmates in Local Jails Redesign and Pretest report with a “Read now” button.