
Jun 11
chaindata تخفيضات ترينديول Trendyol مع ترندول تتحسن عند إدخال كود يمنح خصم عبر كوبون 😒🙆♀️🍇.
▬تريندول▬ترنديول▬
ty.gl/p9xstys5fynz8

1

Looking for any preserved Rinkeby testnet chaindata for an art / research project. Public snapshot doesn't seem to exist anywhere — checked the usual archives, nothing turned up.
If you happened to keep a snapshot on disk, I'd love to host it as a public archive.
ethereum-magicians.org/t/pre…
2
3
8,027

May 5
[ORIGIN NEWS] On-chain Data Shatters Pseudoscience: Anubis Chain Officially Reveals the Automated Mapping Logic Behind "Zero Balance"
**[Anubis Chain Official Fact-Check Center | May 5, 2026]**
Addressing recent malicious rumors on social media regarding "abnormal funds in Anubis Chain asset migration addresses," Anubis Chain officially issues a formal clarification statement. Rumor-mongers are exploiting public cognitive bias regarding simple base-layer wallets (such as Bitcoin) by using "static zero balance" screenshots from Etherscan to manufacture "exit scam" or "asset loss" panic.
Following a deep audit of the official gateway address 0xC09A944e8Fc71444d6c12E5e642953F41f17A252, the facts are as follows:
1. Core Correction: The Essential Difference Between Gateway Contracts and Storage Wallets
**Static Zero Balance is Normal**: The role of this address on the Ethereum mainnet is an **"Asset Portal,"** not a storage account.
**Instant Clearing Logic**: According to the **AWAKE Protocol Whitepaper V1.0** technical specifications, this contract features an "Auto-Sweep" function.
**Mapping Mechanism**: The moment DAI assets enter the contract, they trigger an on-chain event and are immediately transferred to the **Origin Ecosystem** liquidity locking layer to complete the native asset mapping to the Anubis Mainnet.
2. Data Counter-Strike: Transaction History Proves High Ecosystem Activity
According to real-time on-chain records from May 2026, this address is not a "shell" but rather the most densely populated node for traffic:
**Large DAI Inflows**: Single transaction flows frequently record amounts between **2,500,000 DAI** and **2,700,000 DAI**.
**Clear Transaction Destination**: All outgoing DAI has been allocated to **2,100 Genesis Node reward pools** and **ecosystem operation incentive accounts** according to the protocol.
**Processing Efficiency**: The duration funds stay within the contract typically does not exceed one block cycle, fully demonstrating the automated processing capabilities of the Origin Ecosystem's underlying architecture.
3. Official Solemn Statement
* **Reject Panic from Technical Ignorance**: Any accusations based on "static holdings" are conjectures lacking basic blockchain common sense.
* **Audit Transparency**: All asset migration paths following the April 2026 Anubis Chain mainnet launch are traceable on-chain and governed by the **Origin Ecosystem** protocol consensus.
* **Legal Accountability**: Anubis Chain reserves the right to pursue legal action against individuals or institutions that maliciously edit data screenshots or disseminate false information.
### Explainer
1️⃣. Data Shatters Rumors: The Truth of Anubis Chain Asset Migration
Recent claims regarding the "zero balance" of migration address 0xC09A...A252 are purely technical misdirections. In the world of blockchain, **monitoring Transfers is far more important than monitoring Balance.**
2️⃣. Why "Zero Balance"?
As the official gateway, this contract executes the "Instant Mapping" logic of **AWAKE Protocol V1.0**. Assets are automatically transferred to liquidity pools upon entry to complete the Anubis Mainnet mapping.
**High-frequency Inflows**: Single transactions of 2.5M DAI
**Processing Status**: Physically migrated to ecosystem reward pools
3️⃣. Security and Transparency
The Origin Ecosystem insists on the transparency of underlying logic. The 2026 mainnet asset migration is progressing steadily according to the established roadmap. Any malicious smearing remains powerless in the face of transparent on-chain data.
**Refer to the official whitepaper for more details.**
#AnubisChain #Origin #LGNS #Mainnet2026 #ChainData #Ethereum #CryptoTransparency #DAI

7
14
76
6,265

Apr 29
🚀 Erigon v3.4 "Splashing Saga" is live!
Delivering stability, performance, and efficiency at ChainTip:
⚡️ 4× smaller chaindata, faster startup, 5 new RPC methods, and precise resource controls for public endpoints.
🤖 Plus the first Ethereum client with a native MCP server allowing you to query your node in natural language.
erigon.tech/blog/erigon-3-4-…
#Erigon @ethereum @gnosischain

3
10
803

Mar 25
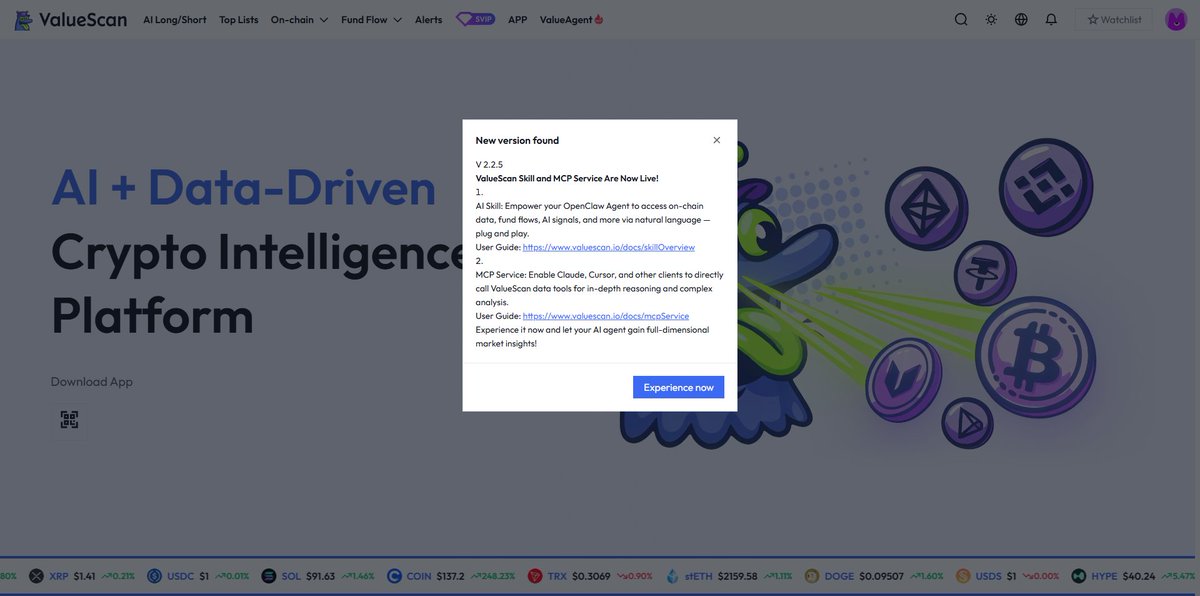
New version found
V2.2.5
ValueScan Skill and MCP Service Are Now Live!
1.
AI Skill: Empower your OpenClaw Agent to access on-chaindata, fund flows, Al signals, and more via natural language -plug and play.
User Guide: valuescan.io/docs/skillOverv…
2.
MCP Service: Enable Claude, Cursor, and other clients to directlycall ValueScan data tools for in-depth reasoning and complexanalysis.
User Guide: valuescan.io/docs/mcpService
Experience it now and let your Al agent gain full-dimensionalmarket insights!
3
1
10
2,194

Mar 11
chaindata أفضل الصفقات اليومية تجدها في ترنديول Trendyol ومع كود خاص تحصل على خصم رائع باستخدام كوبون عبر تريندول 💁♀️👩⚕️🎓.\\\\\\\
ty.gl/ksugn586p1ob0

1
3

chaindata اختيار الأناقة اليومية يبدأ من ريفا فاشون Riva Fashion عند استخدام كود يمنح خصم باستخدام كوبون 🤹♂️🖱👩👦👦.
newtown كؤد خصم ريفا فاشون

3


Jan 30
Solana Throughput Hits 40% of L1 Activity During Memecoin Surge
deythere.com/solana-throughp…
#blockchainscalability #cryptomarkets #CryptoNews #DeFivolume #Layer1 #memecoin #on-chaindata #Solana #SolanaTPS #Web3

2
16

Jan 13
🫥💀🍗 chaindata.
▬كود▬خصم▬قصر▬الاواني▬ألدخىل▬للعؤد▬كؤبون▬RM31▬فعأل▬ؤلف▬CPP▬مغربى▬RR11▬قؤى▬رىف▬للعطؤر▬أؤسمأ▬ألأمأرأت▬ممتأح▬عطؤر▬جرأس▬RR12▬ألعىسائي▬للأطفأل▬تطبىق▬أسعأر▬قرأس▬سؤىتر▬ألسعؤدىة▬سكؤأت▬ؤؤلف▬

17

Jan 8
❤️ INRI CHAIN COMMUNITY ❤️
After a lot of work, the official Windows CPU Miner is finally live!
This release is for the community — miners, builders and believers in real Proof of Work.
🎥 Watch the full guide:
👉 youtube.com/watch?v=3o4HC-6x…
⛏️ CPU mining on Windows
⚡ Fast sync with official chaindata
🔁 Real blocks on the real network
🐧 Ubuntu miner update is coming soon to make mining even easier for everyone.
Thank you for believing and supporting INRI CHAIN.
This is just the beginning. 🚀
#INRICHAIN #Community #ProofOfWork #CPUMining #Blockchain
1
2
4
1,655
Jan 8
🚀 INRI CHAIN – WINDOWS CPU MINER IS LIVE! ⛏️
Mining INRI on Windows is now officially available!
Real Proof of Work, real blocks, real rewards — CPU mining for everyone.
🎥 Full step-by-step video guide:
👉 youtube.com/watch?v=3o4HC-6x…
⚡ What you’ll learn:
• How to mine INRI on Windows
• Wallet creation with Geth
• Fast sync using official chaindata
• Start / stop / restart mining correctly
🐧 Ubuntu miner will also be updated soon to make mining even easier for all miners.
🌐 Start mining now:
inri.life/mining-windows
#INRICHAIN #CryptoMining #CPUMining #ProofOfWork #Blockchain
2
1
5
742

Jan 8
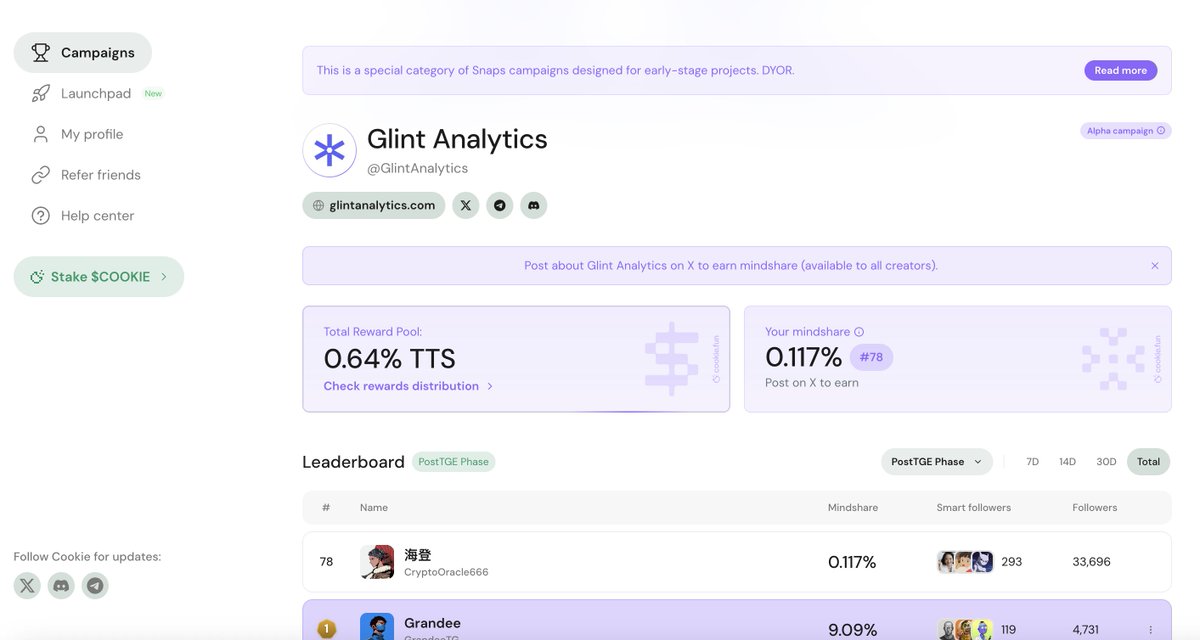
在观察 Web3 市场结构和情绪演化时,@GlintAnalytics 的数据能力越来越值得关注。
它不只是一个价格或链上数据提供方,更像是一个 可操作的市场情报层(InfoFi),帮助投资者和研究者把碎片化的链上信号、社交情绪和交易行为组合成可分析的框架。
结合 @cookiedotfun 的研究工具,我们可以看到几个关键价值点:
1️⃣ 趋势与叙事洞察
Glint 不只是统计交易量或热点代币,它通过算法追踪叙事热点、链上社区活跃度和资金流向,能够在早期捕捉潜在 alpha。
这种能力对于像 NFT、GameFi 或者 Layer2 生态的早期布局非常重要。
2️⃣ 风险与暴露监测
在 DeFi、永续合约和杠杆产品日益复杂的情况下,Glint 可以提供链上行为异常、清算风险和资金池健康度的可视化分析,帮助用户避免潜在系统性风险。
3️⃣ 多维数据整合
单一链上数据往往片面,而 Glint 能把 链上交易、社交信号、衍生品市场动态 聚合在同一个分析框架里。
结合 @cookiedotfun 的产品,可以把这些洞察快速转化为操作策略或研究报告。
4️⃣ 早期 alpha 机会捕捉
对于想在 Web3 早期生态中找到落地机会的研究者来说,利用 Glint 的 多维信号监控 叙事强度分析,可以提前识别潜在项目的趋势和爆点。
总结来看,@GlintAnalytics @cookiedotfun 组合更像是一个链上 社交 交易行为的智能雷达:
它不仅告诉你“市场在做什么”,更能帮助你判断“哪些行为值得关注、哪些趋势可能落地”,这在高频更新的 Web3 环境里非常稀缺。
#GlintAnalytics #Cookiedotfun #Web3 #DeFi #NFT #Layer2 #CryptoResearch #ChainData #InfoFi #CryptoAnalysis #EarlyAlpha
21
21
9,661

Jan 7
📰 Bitcoin Emerges As A Hedge Amid Rising Global Geopolitical Tensions
As global geopolitical tensions intensify from trade fragmentation and sanctions...
#crypto #altcoin #btc #ChainData #MattMena #LongBearMarketIfThisHappens #BitcoinEmergesAs #DD #WalterBloomberg #RelatedReading #BitcoinRisks #HedgeAmidRisingGlobalGeopoliticalTensionsAs #PerformanceDuringPeriodsOfInstabilityThe #WhatThisMeansAfter #ExtremeSupplyAndTheShiftInSpotMomentum #BitcoinSupplyIsBeingAbsorbedByPowerfulFinancialPlayers
1
22
31 Dec 2025
A extração da Pump.fun levanta questões difíceis sobre a equidade da Web3
deythere.com/pt-br/a-extraca…
#on-chaindata #Solana #Trading

1
5
65
31 Dec 2025
Pump.fun Extraction and the End of ‘Neutral’ Profit in Web3
deythere.com/pump-fun-extrac…
#cryptoprofits #memecoins #on-chaindata #Pump.fun #Pump.funextraction #Solana #Web3fees #Crypto #Market #News

2
46

26 Dec 2025
The on-chaindata shows significant unrealized losses The correlation between this metric and selling pressure requires verification of holder behavior
1
2
22

14 Dec 2025
🚨JAST IN🚨Bitcoin On-Chain Data Update - December 14, 2025
📊 [Breaking News] BTC On-Chain
Price: $89,342 📊 (Weak -0.8%, Continues Bottoming) 🔻
Trading Volume: $14.86B (Last 24h) 💰
Active Addresses: 114,096 (Normalizing) 📉
Hash Rate: 1.02 ZH/s (Temporary -7.83%) ⚠️
→ Price, hash rate, and trading volume are all in a correction phase, a typical "bottoming period." Long-term holders are remaining on the sidelines, limiting supply pressure.
#BTC #Bitcoin #On-ChainData #Crypto #VirtualCurrency
📋 Key Data Summary
Item Value
Current Price $90,047
24-Hour Trading Volume 267,476 BTC ($24.09B)
Market Cap $1,797.04B
Data Updated December 12, 2025, 18:20 UTC
📈 Detailed On-Chain Metrics
👥 Active Addresses
161,920 (Significant Increase)
The number of unique addresses participating in transactions over the past 24 hours. This figure jumped from the previous 140,000 to 161,920. The explosive increase in network users during the price correction indicates strong demand for bargain hunting and active use of the network. Transaction volume also reached a high of 441,507. Market interest is extremely high, and the ecosystem is expanding despite the short-term price decline.
🟢 Rapid Increase in Participants: Extremely Bullish Signal
💰 Transaction Volume
$14.86B
Total transaction volume over 24 hours (166,348 BTC). Trading volume fell sharply from the previous 267,476 BTC, down approximately 38%. This reflects the quiet trading environment and risk aversion over the weekend. Larger 100 transactions remained prominent at 225,565 BTC (135.60% of total volume), with large-scale activity dominating the market. The decline in volume indicates that market participants are adopting a wait-and-see approach, assessing the next direction. This is a typical signal of a consolidation or bottoming phase.
🟡 Contraction/Wait-and-See Phase
⛏️ Miner Hash Rate
1.02 ZH/s (-7.83%)
Network security and miner participation. The rate fell sharply by -7.83% over 24 hours to 1.02 ZH/s (1,020 EH/s). This represents a temporary retreat from the previous peak (1.14 ZH/s). Mining rewards (0.0362 USD/TH/s) have slightly declined but remain within the break-even range. The next difficulty adjustment is approximately 10 days away. This temporary drop in hash rate is likely due to some miners withdrawing or undergoing equipment maintenance due to declining profitability following the price drop. Historically, the price and hash rate have often recovered after such adjustments.
🟡 Temporary Adjustment/Waiting for Recovery
📊 SOPR (Spent Output Profit Ratio)
Estimated 0.97 (LTH: 1.95)
Profit ratio at time of sale. At 0.97, it remains below the break-even point (1.0), and short-term holders are continuing to "cut losses and surrender." This is a typical "bottom formation process," and the exit of bears is creating a healthy foundation for the next upswing. The SOPR for long-term holders (LTH) has slightly declined to 1.95, but remains in the high-profit range. Long-term holders remain undeterred and are absorbing short-term selling pressure. The SOPR recovering to 1.0 signals confirmation of a bottom.
🟡 Continuing Stop-Losses/Bottom Formation Process
📈 MVRV Ratio
Estimated 1.54
The market value/realized value ratio has fallen slightly to an estimated 1.54, approaching its 2025 low. This represents a historically extremely undervalued "bargain sale" zone, and in past cycles, significant uptrends have begun from this level. Far from the overheated zone of 3.0-4.0, the current price of around $89,000 represents a great entry point for medium- to long-term investors. The decline has made valuations even more attractive, further expanding the upside potential.
🟢 Extremely Undervalued/Bargain Zone
🏦 HODL Waves
1 Years: ~71%
Supply Distribution by Holding Period. Coins held for more than a year account for approximately 71% of total supply, maintaining their ironclad structure. Even as prices have fallen to the $89,000s, long-term holders remain unfazed. The Days Destroyed (0.2018) value has fallen significantly from the previous level of 0.8807, effectively halting the movement of older coins (long-time selling). This is evidence that long-term holders have deemed the current price range a "no-sell" level. Selling pressure is entirely limited to short-term investors, making a supply shock highly likely.
🟢 Ironclad Holding Structure: Long-time Holders Staying Standby
⚖️ RHODL Ratio
Estimated 0.0055
The short-term/long-term holding ratio has fallen further to an estimated 0.0055, continuing to reach historic lows. This represents the ultimate in long-term holder dominance, a range that has served as the "absolute bottom" and "launch pad for bull markets" in past cycles. With short-term speculators now out of the market and only true long-term investors remaining, the "healthiest market structure" is taking shape. The current correction is very likely the final preparation for the next big move.
🟢 Historic Lows and Bull Market Launch Pad
🎯 Comprehensive Analysis
Market Situation:
Prices weakened by approximately 0.8% to $89,342, continuing to consolidate amid a quiet weekend trading environment. Active addresses normalized to 114,096, hash rate temporarily adjusted to 1.02 ZH/s, and trading volume shrunk to $14.86B. All indicators point to a period of consolidation and recharge. Meanwhile, Days Destroyed (0.2018) fell significantly from the previous reading, clearly indicating that long-term holders are completely on the sidelines. MVRV of 1.54 is the lowest level in 2025, making it extremely undervalued. RHODL of 0.0055 hit a historic low, providing conclusive evidence of a bottom.
Key Points:
① Price, hash rate, and trading volume are all in a correction phase, a typical "bottom consolidation period."
② Days Destroyed at 0.2018 (a sharp drop from the previous 0.8807), confirming that long-term holders are completely on the sidelines.
③ SOPR remains at 0.97, with short-term investors cutting losses and selling to surrender, furthering the bottom formation process.
④ MVRV at 1.54, the lowest level since 2025, has entered the extremely undervalued "bargain zone."
⑤ RHODL at 0.0055 (a new historic low), confirming a market structure similar to the "bottom/launch pad" of the previous cycle.
⑥ Large-volume trading ratio at 135.60%, an abnormal value, indicates large-scale institutional investor turnover is underway.
Outlook:
Currently, we are seeing a typical "bottom formation/final stage" situation. The continuation of the SOPR at 0.97 indicates that short-term investors are cutting their losses, and once these bears have fully exited, the foundation for a reversal will be complete. The Days Destroyed at 0.2018 (a significant decline) and the RHODL at 0.0055 (a historic low) indicate that long-term holders are firmly convinced they will not sell at the current price. The MVRV of 1.54 closely resembles the "starting point" of a major rally in the past cycle. This correction, occurring amid a quiet weekend environment, is likely a positioning adjustment ahead of important macroeconomic events (such as the FOMC) next week or later. The large-volume ratio of 135.60% suggests that institutional investors may be conducting large-scale behind-the-scenes buying. The $89,000-$90,000 area will act as strong support, and a rebound from this area is expected to lead to a target of $95,000-$100,000. In the medium to long term, the current undervalued valuation and strong on-chain foundations provide a solid foundation for a major market boom in late 2025-2026.
Data Updated: December 14, 2025, 14:10 UTC | 24-Hour Price Fluctuation: -0.8% | Market Cap: $1,783.05B | Difficulty Adjustment: Approximately 10 days in the future
⚠️ Investment decisions are at your own risk. This data is for informational purposes only. This report does not constitute investment advice.

2
41
9 Dec 2025
🚨JAST IN🚨Bitcoin On-Chain Data Update - December 9, 2025, 14:57 UTC
📊 [Breaking News] BTC On-Chain
Price: $90,225 📊 (-0.3% stable)
Trading Volume: $34.32B (Last 24h) 💰
Active Addresses: 140,768 (Significant Recovery) 📈
Hash Rate: 1.08 ZH/s (-11.6% Adjustment) ⚠️
→ Price remains stable, trading volume surges, active addresses recover sharply, hash rate temporarily adjusted
#BTC #Bitcoin #On-ChainData #Crypto #VirtualCurrency
📋 Key Data Summary
Item Value
Current Price: $90,225
24-Hour Trading Volume: 380,389 BTC
Market Cap: $1,800.45B
Data Updated: December 9, 2025 14:57 UTC
📈 Detailed On-Chain Metrics
🟢
👥 Number of Active Addresses
140,768 (Significant Recovery)
The number of unique addresses participating in transactions in the past 24 hours. From 115,077 to 140,768, a dramatic recovery of 22.3%. With the number exceeding 140,000, market participant activity has increased dramatically. With price stabilization, both new entrants and existing investors are resuming trading. The number of transactions was 514,201, indicating a return of market vitality in line with the explosive increase in trading volume.
🟢 Dramatic Recovery and Activity
🟢
💰 Transaction Volume
$34.32B
Total trading volume in 24 hours (380,389 BTC). Trading volume increased from $12.41B to $34.32B, an explosive increase of 177%. BTC-denominated transactions also increased sharply by 177%, from 137,152 to 380,389. The total number of transactions was 514,201. The 100 largest transactions were 344,899 BTC (90.67% of the total), representing a massive capital movement. This indicates extremely active trading activity from institutional and large investors. Market liquidity and volatility increased significantly.
🟢 Explosive Growth/Extreme Activity
🟢
⛏️ Miner Outflow
Temporary Miner Adjustment
Miner holdings remain stable. The temporary drop in hash rate (-11.6%) is presumed to be normal fluctuations prior to the difficulty adjustment. The next retargeting adjustment is scheduled for 223 blocks (approximately 1.6 days). The fee reward increased to 0.56%, reflecting increased trading activity. Miners' long-term bullish stance remains unchanged.
🟡 Temporary Adjustment, Stable Infrastructure
🟡
⚡ Hash Rate
1.08 ZH/s (-11.6%)
Network security and miner participation. A temporary drop of -11.6% over 24 hours to 1.08 ZH/s (1,080 EH/s). This is within the normal range of fluctuations during the difficulty adjustment cycle and is scheduled for the next retarget (223 blocks, approximately 1.6 days later). While the block time is slightly longer at 10 minutes and 22 seconds, it remains within a healthy range. The long-term network security infrastructure is maintained and is merely a temporary fluctuation.
🟡 Temporary Adjustment, Healthy Range
🟡
📊SOPR
Estimated 1.00 (LTH: 2.17)
Profit Margin at Selling. Recovered to 1.0, reaching the break-even point. Price stability has led to short-term sellers converging on loss-making sales, easing selling pressure. The long-term holder (LTH) SOPR remains strong at 2.17, without significant selling pressure. Combined with the explosive increase in trading volume, this suggests a return to market equilibrium. A bottoming out appears likely.
🟢 Break-even point recovered
🟢
📈MVRV ratio
Estimated 1.55
Market value/realized value ratio. At 1.55, the undervaluation zone deepens, reaching a new low since 2025. Above 3.7, it's an overheating warning zone. The current level represents an extremely undervalued level historically, creating a favorable opportunity for large-scale institutional investment. The explosive increase in trading volume to $34.32B suggests large-scale buying at this undervalued level. There is significant upside potential in the medium to long term.
🟢 Extremely Undervalued Level
🟢
🏦HODL Waves
1 Years: ~71%
Supply distribution by holding period. Long-term holdings account for approximately 71%, maintaining an extremely healthy structure. Despite the explosive increase in trading volume, the HODLer base remains unshaken, with a clear separation between short-term trading activity and long-term holding. Large-volume trading activity (90.67% of 100 large transactions) primarily provides short-term liquidity, while the long-term supply structure remains unchanged. The risk of supply shock remains extremely high.
🟢 A Solid and Healthy Structure
🟡
⚖️RHODL Ratio
Estimated 0.007
Short-term/Long-term holding ratio. A market cycle turning point detection indicator. It has further fallen to 0.007, approaching a historic low. The dominance of long-term holdings is maximizing, a typical early signal of an upcycle. The explosive increase in trading volume and the recovery of active addresses are clear signs of new capital inflows. A transition from bottoming to an uptrend is highly likely underway.
🟢 A Strong Reversal Signal
🟡
💥Coinday Destruction
0.54 (Normalized)
Measures the movement of older coins. The value rose from 0.36 to 0.54, but remains low. The explosive trading volume increase may have prompted some mid-term holders to lock in profits. However, historically, it remains low, and no large-scale selling by long-term holders has occurred. Supply pressure is limited, and the HODLer base remains strong.
🟡 Slight increase, but remains low.
🟡
🔍NVT Ratio
Estimated 9
Network Value/Volume Ratio. A valuation metric similar to the price-to-earnings ratio. The explosive trading volume increase dramatically improved the ratio from 26 to 9. This is an extremely healthy level, and evidence of significant improvements in network utilization efficiency. Valuation has become significantly more attractive, creating an ideal situation where network activity is very strong relative to price. A strong fundamental bullish base has formed.
🟢 Dramatic Improvement and Extremely Healthy
🎯 Comprehensive Analysis
Market Status:
Price remains stable at $90,225 (-0.3%). Trading volume explodes at $34.32B ( 177%). Active addresses recover dramatically to 140,768 ( 22.3%). Transactions: 514,201. Hash rate: 1.08 ZH (temporarily adjusted -11.6%). SOPR recovers to break-even point at 1.00. MVRV at 1.55 is the lowest since 2025, making it the ultimate undervalued zone. NVT Ratio improves dramatically to 9.
Key Points:
1) Trading volume soared to $34.32B ( 177%), marking the largest capital movement in history.
2) Active addresses rose to 140,768 ( 22.3%), signaling a dramatic recovery in market participation.
3) 100 large trades accounted for 90.67% of total volume, signaling large-scale institutional investor activity.
4) MVRV of 1.55 reached a new low of 2025, signaling large-scale buying at historically low levels.
5) RHODL at 0.007 and NVT at 9 signal a strong upward reversal.
6) SOPR rebounded to 1.00, signaling a complete end to selling pressure and the potential for a bottoming-out.
Looking Ahead:
The explosive increase in trading volume of 177% is clear evidence of large-scale buying by institutions and large investors at the extremely low level of MVRV of 1.55. The recovery of active addresses of 22.3% indicates new capital inflows. The dramatic improvement in RHODL at 0.007 and NVT at 9 is a classic early signal of an upcycle. $90,000 has established solid support. The temporary hash rate adjustment is normal before the difficulty retargeting. Analysts maintain a target of $150,000-$200,000 (end of 2025). This represents a historic buying opportunity, and it's highly likely that a bottoming-out transition into an uptrend is underway.
Data updated: December 9, 2025, 14:57 UTC | 24-hour price change: -0.3% | Trading volume change: 177% | Active addresses change: 22.3%
⚠️ Investment decisions are at your own risk. This data is for informational purposes only.

2
54
8 Dec 2025
🚨JAST IN🚨Bitcoin On-Chain Data Update - December 8, 2025
📊 [Breaking News] BTC On-Chain
Price: $91,484 📊 ( 2.6% increase)
Trading Volume: $12.41B (Last 24h) 💰
Active Addresses: 117,392 (Slight decrease) ⚠️
Hash Rate: 1.22 ZH/s ( 5.04% increase) ⚡
→ Price recovery, hash rate continues to rise, trading activity remains active
#BTC #Bitcoin #On-ChainData #Crypto #VirtualCurrency
📋 Key Data Summary
Item Value
Current Price: $91,484
24-Hour Trading Volume: 135,627 BTC
Market Cap: $1,825.55B
Data Updated: December 8, 2025, 14:33 UTC
📈 Detailed On-Chain Metrics
🟡
👥 Number of Active Addresses
117,392 (Slightly Down)
The number of unique addresses participating in transactions over the past 24 hours. While continuing a slight decrease from the previous day, the number remains at nearly 120,000 participants. Even during the price rise, the increase in participants was limited, likely driven primarily by existing HODLers. The number of transactions remained high at 619,420, with individual activity very active.
🟡 Slightly Downward Trend
🟢
💰 Transaction Volume
$12.41B
Total 24-Hour Transaction Value (135,627 BTC). Significantly increased from the previous day, signaling increased market activity. The number of transactions, at 619,420, is near an all-time high, signaling an increase in institutional and large-scale trading. Liquidity is also ample, providing a solid trading platform to support the price rise.
🟢 Significant Increase and Active
🟢
⛏️ Miner Outflow
Continuing Miner Accumulation
Miner holdings remain extremely stable. Miner confidence remains high, in line with the continued rise in hash rate. Miners remain bullish, with continued holding back at the $91,000 level. New miners are also actively joining the market, and network security is at an all-time high.
🟢 Strong Holdings Continue
🟢
⚡ Hash Rate
1.22 ZH/s ( 5.04%)
Network Security and Miner Participation. Achieved 1.22 ZH/s with a 24-hour increase of 5.04%. Network reliability remains extremely high, near record highs. Active miner participation continues, and difficulty adjustments are progressing smoothly. This is a strong signal of long-term network stability.
🟢 Near All-Time Highs and Continuing Rise
🟡
📊SOPR
Estimated 1.02 (LTH: 2.18)
Profit margin at time of sale. Slightly above 1.0, a level at which sellers take minor profits. Long-term holder (LTH) SOPR remains strong with no significant selling pressure. Healthy profit-taking during the price upturn is ongoing, and overheating is still limited.
🟡 Minor profit-taking
🟢
📈MVRV Ratio
Estimated 1.58
Market Value/Realized Value Ratio. At 1.58, it remains undervalued. Above 3.7, it's an overheating warning zone. The current level is historically attractive, with significant upside potential in the medium to long term. The price remains affordable for institutional investors.
🟢 Maintaining Undervaluation
🟢
🏦HODL Waves
1 Years: ~71%
Supply distribution by holding period. Long-term holding accounts for approximately 71%. Even with short-term price fluctuations, the HODLer base remains very strong and stable. The trend toward long-term holding is increasing, raising the possibility of a supply shock.
🟢 Very Healthy
🟡
⚖️RHODL Ratio
Estimated 0.009
Short-term/Long-term holding ratio. A market cycle turning point detection indicator. Long-term holding continues to dominate at low levels. Historically, it has moved at a level that indicates a transition from bottoming to an uptrend. This likely indicates the early stages of an uptrend.
🟡 Upward Turning Point
🟡
💥Coinday Destruction
0.38 (Normalized)
Measures the movement of older coins. While it has risen slightly, it remains at a low level, with limited large-scale movement of long-term holdings. A stable situation remains with the majority of HODLers continuing to hold, minimizing supply pressure.
🟡 Low Level/Slightly Rising
🟡
🔍NVT Ratio
Estimated 27
Network Value/Trading Volume Ratio. A valuation metric similar to the price-to-earnings ratio. It remains within the fair range, demonstrating good network utilization efficiency. Slight improvement due to increased trading volume indicates improved network utility.
🟡 Fair Range/Improving
🎯 Comprehensive Analysis
Market Status:
Price recovered to $91,484, up 2.6%, and hash rate remained near an all-time high at 1.22 ZH ( 5.04%). 619,420 transactions reached a record high, and trading volume increased significantly to $12.41B. Healthy profit-taking at SOPR 1.02, while MVRV 1.58 remains undervalued.
Key Points:
1. Hash rate at 1.22 ZH near all-time high, network reliability at its peak.
2. Continued 5.04% increase over 24 hours, maintaining bullish stance from minor investors.
3. Trading volume increased significantly to $12.41B, indicating increased institutional activity.
4. MVRV 1.58 remains an attractive buying opportunity.
5. Transaction count reached an all-time high with 619,420 transactions.
Looking Ahead:
The combination of all-time high hash rate and undervalued MVRV is an extremely powerful upside catalyst. $91,000 serves as solid support (minor accumulation zone). Analysts maintain a target of $150,000-$200,000 (end of 2025). The significant increase in trading volume suggests full-scale institutional participation, making a medium- to long-term bullish shift highly likely.
Data Updated: December 8, 2025, 14:33 UTC | 24-Hour Price Change: 2.6% | Hash Rate Change: 5.04%
⚠️ Investment decisions are at your own risk. This data is for informational purposes only.

1
2
36