
19 Nov 2024
The Evolution of Education Channels: From Boys to Title IX
youtube.com/live/aqs-x_15OeA
#ChannelEvolution #TitleIX #YouTubeHistory #EducationalContent #MaleStudents #Rebranding #DigitalJourney #FutureOfEducation #Serendipity #ContentCreation
3
532

10 Mar 2024
A salty snapshot: extreme variations in basal erosion patterns preserved in a submarine channel.
Read the Open Access article in the Lyell Collection lyellcollection.org/doi/10.1…
#Erosion #Geology #EarthScience #ChannelEvolution
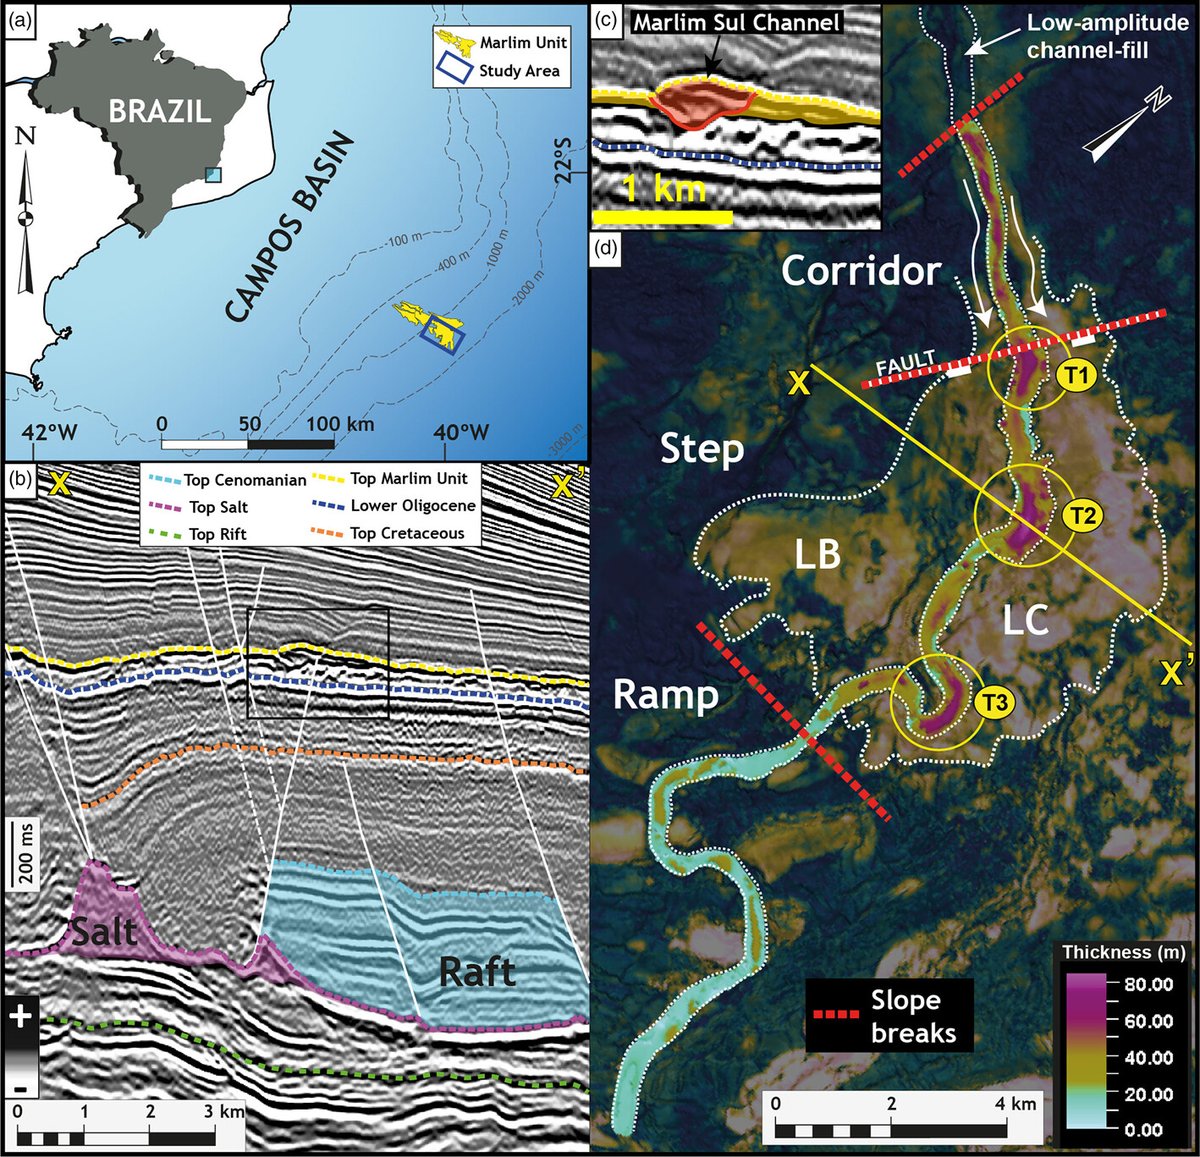
ALT Fig. 1. (a) Location map of the Campos Basin and the study area within the Marlim Unit (blue rectangle).
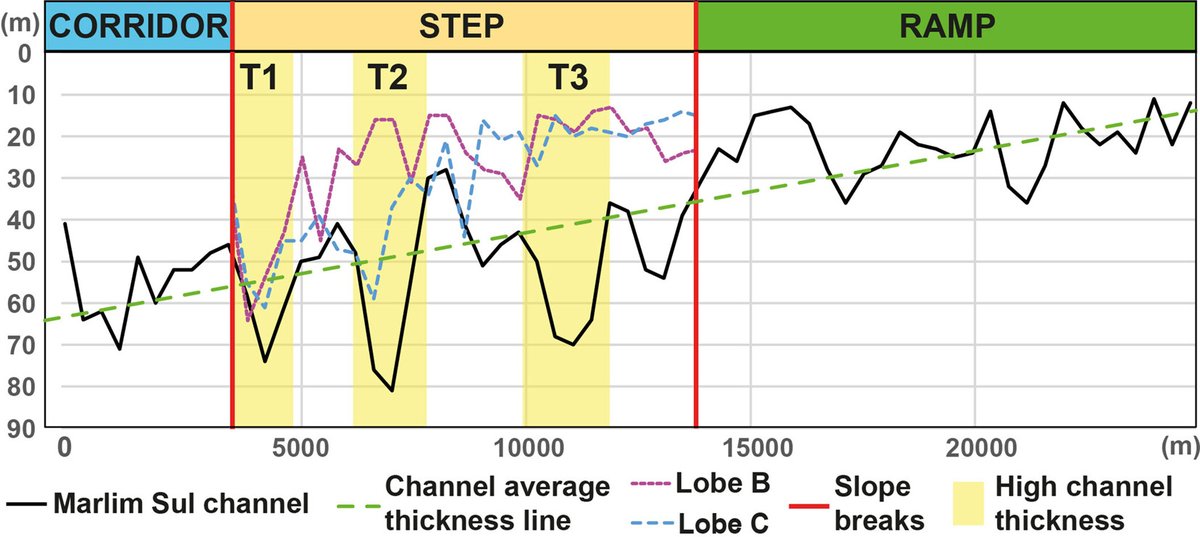
ALT Fig. 2. Graph showing longitudinal variations in thickness along and parallel to the channel thalweg (across the corridor, step and ramp) and the lobate features LB and LC (across the step).
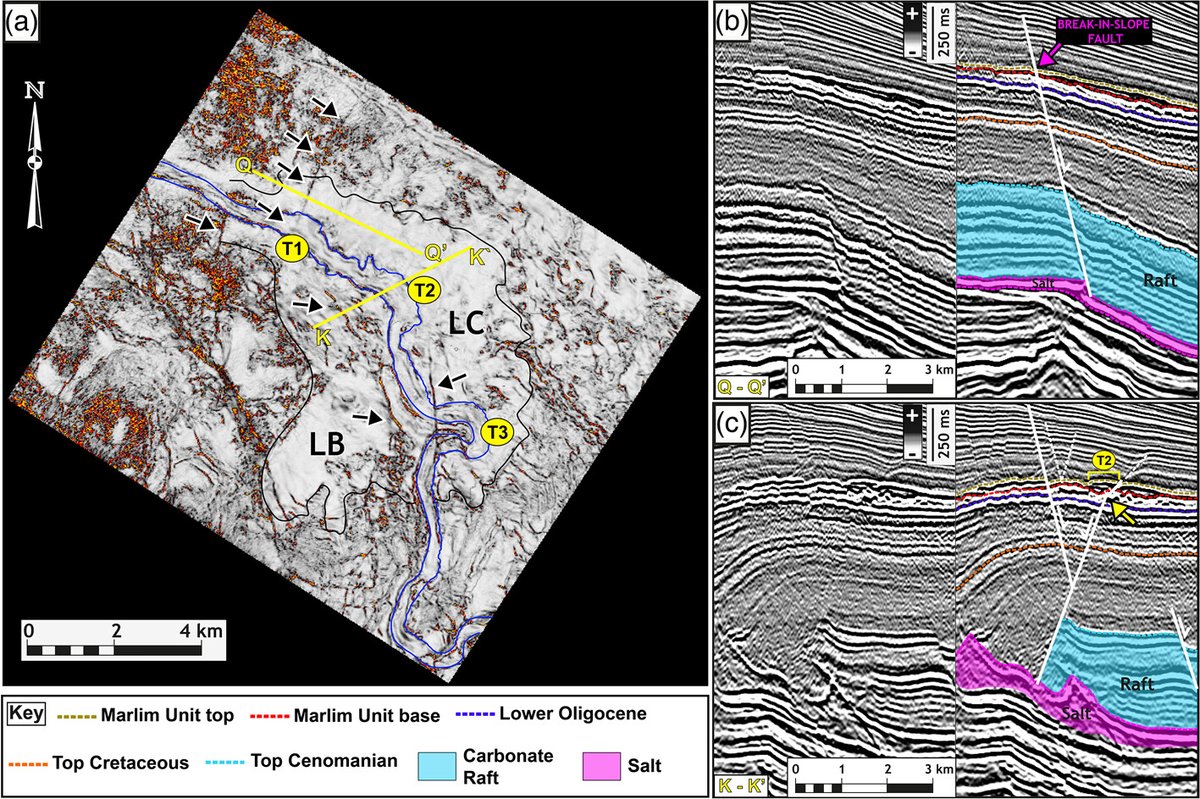
ALT Fig. 3. Large-scale structural control on the Marlim Sul Channel (marked as blue lines).
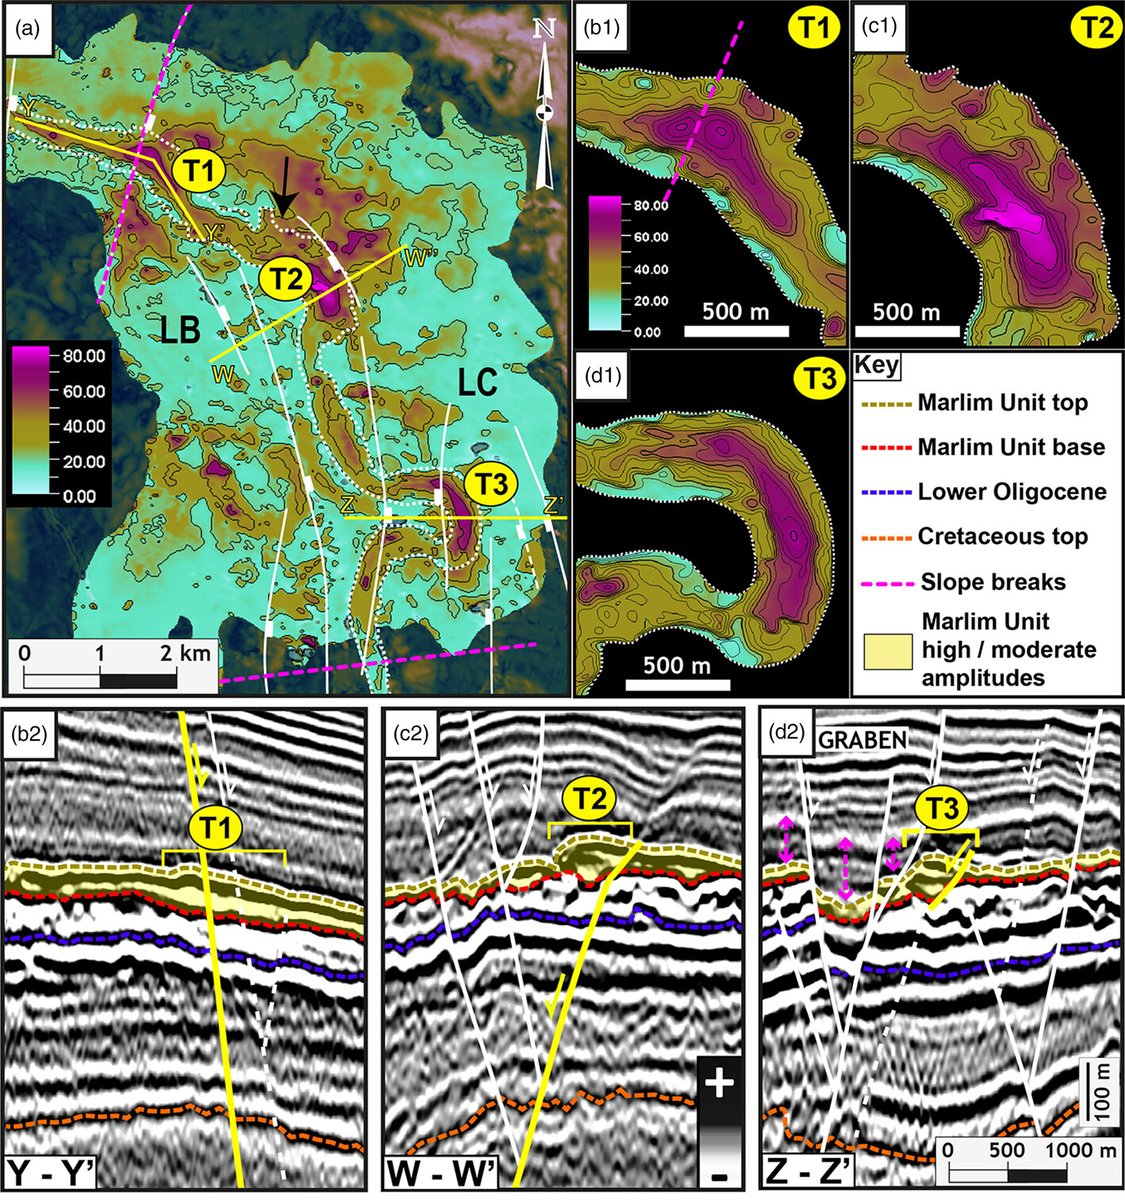
ALT Fig. 4. (a) Thickness map (m) of the lobate features (LB and LC) and the Marlim Sul Channel fill with the main faults. Slope breaks shown as dotted pink lines (the slope break at the entrance of the step coincides with a fault). The channel geomorphology is marked by white dotted lines.
4
13
1,871

5 Oct 2018
Join BCN @Avant_CCC Special Forces lunch and reception in Philadelpha! #ChannelEvolution #Avant #BCN

3

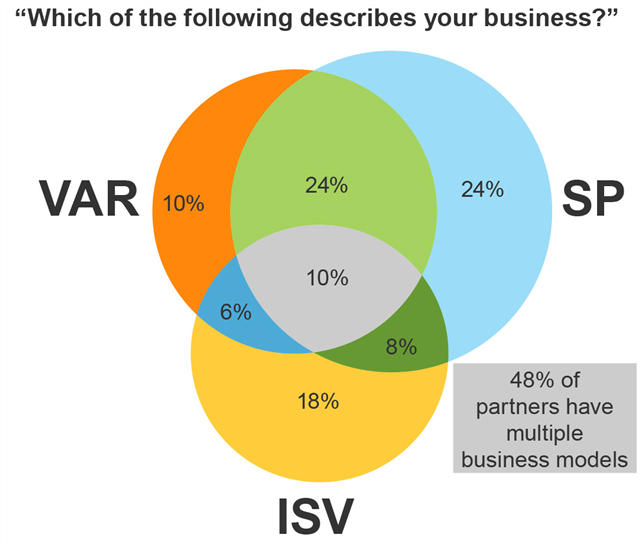
"We are on the ground, around the world, and our customers and users will benefit from more in-language support and multi-lingual campaigns." Read more from CEO Gordon Rapkin on the growth of Zift: buff.ly/2zMIeJZ #channelevolution #channelmarketing #PRM
1

9 Oct 2016
@kbailey on the first leg of his WW partner meeting tour. Safe travel. @HPE_Partner #ChannelEvolution
9 Oct 2016

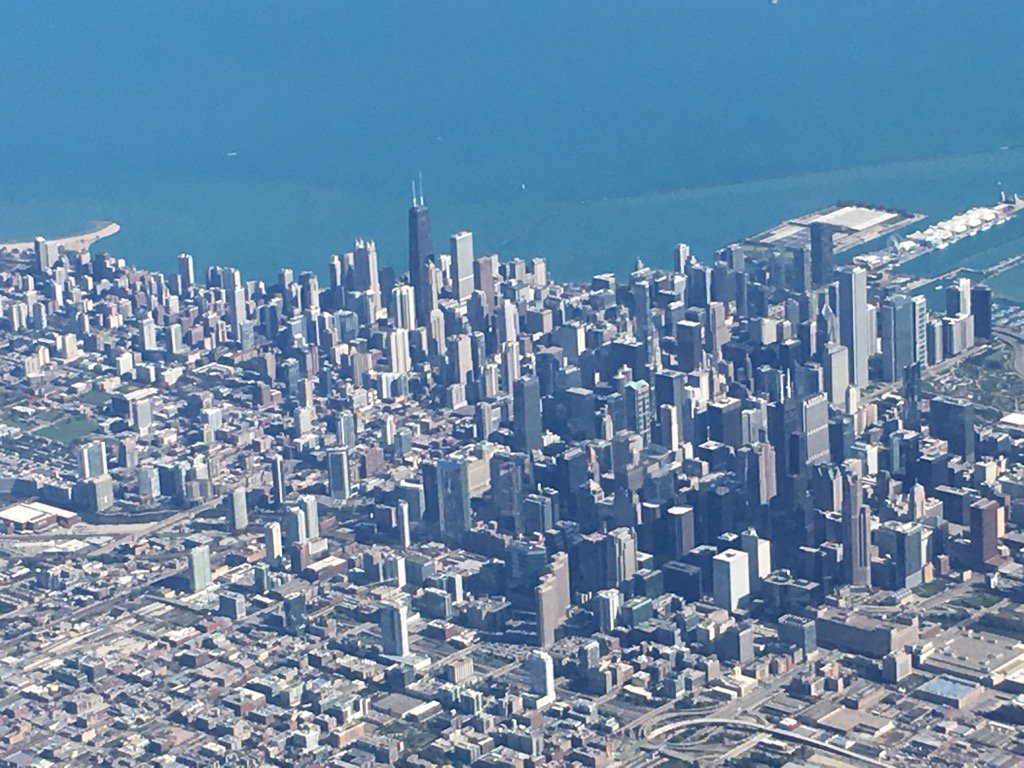
Headed over to meet #hpe partners & @bpatrick001 in Hong Kong. Enjoying a beautiful Chicago skyline on layover
2
2
31 Mar 2016
30 Mar 2016

Crafting your own #Cloud Ecosystem Strategy for Channel Service Providers bit.ly/1RKgQ0p
1
1
9 Jan 2016
@kbailey driving #ChannelEvolution for @HPE_Partner success. Voted "Best&Most Admired" vendor by service providers.
8 Jan 2016
#HPE has LASER focus on our channel & partner ecosystem success. So awesome to be voted "best and most admired" goo.gl/ND4cCP
2
1