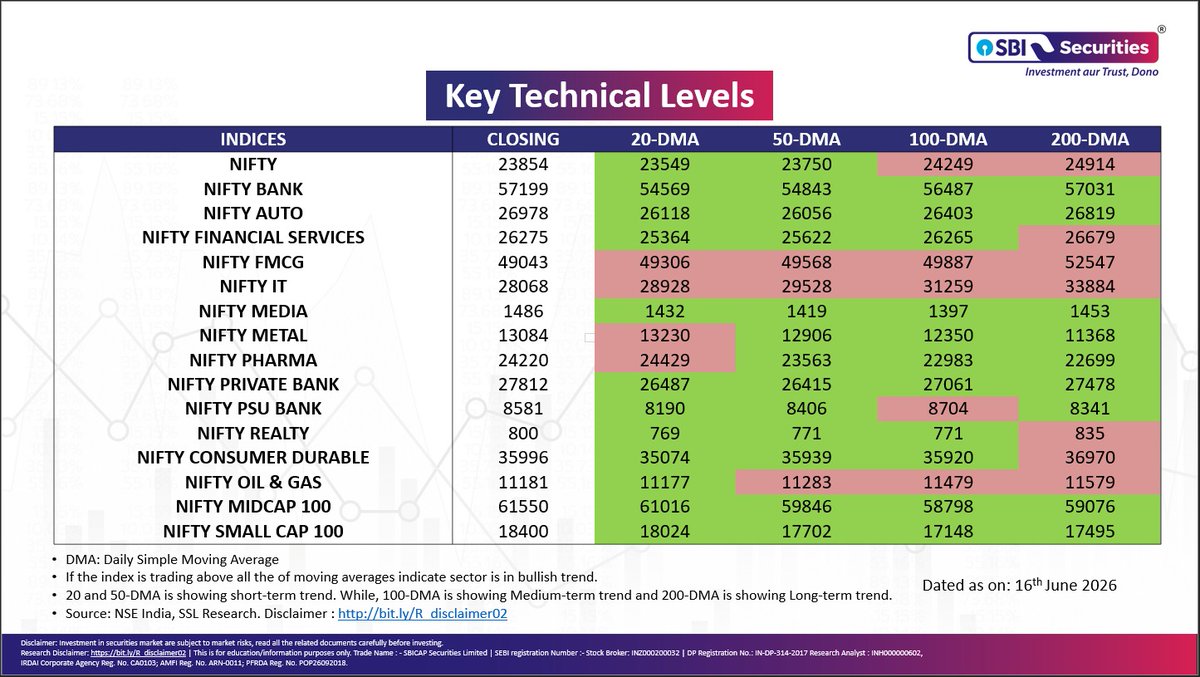
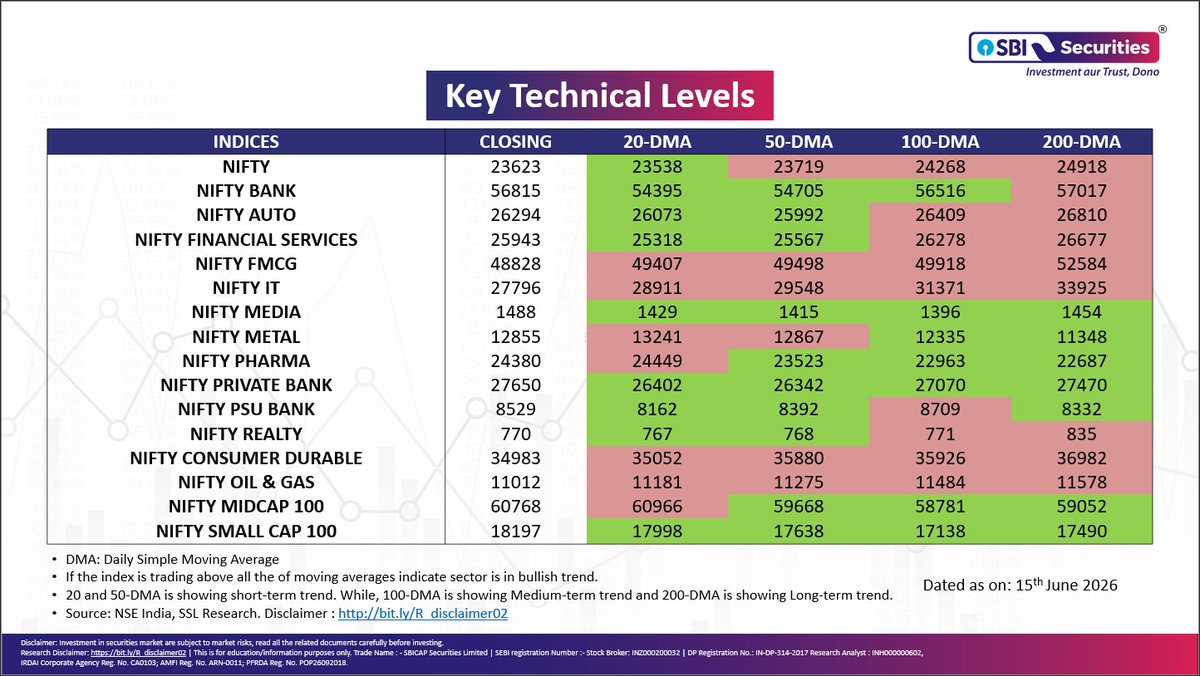
Key Index Levels at a Glance!
Track the 20, 50, 100 & 200-day SMAs of key indices.
Stay aligned with the trend. 📈📉
Disclaimer: bit.ly/R_disclaimer02
#NiftyLevels #BankNifty #TechnicalAnalysis #SMA #ChartSetup #SupportResistance #MarketUpdate #StockMarketIndia #SwingTrading

2
185
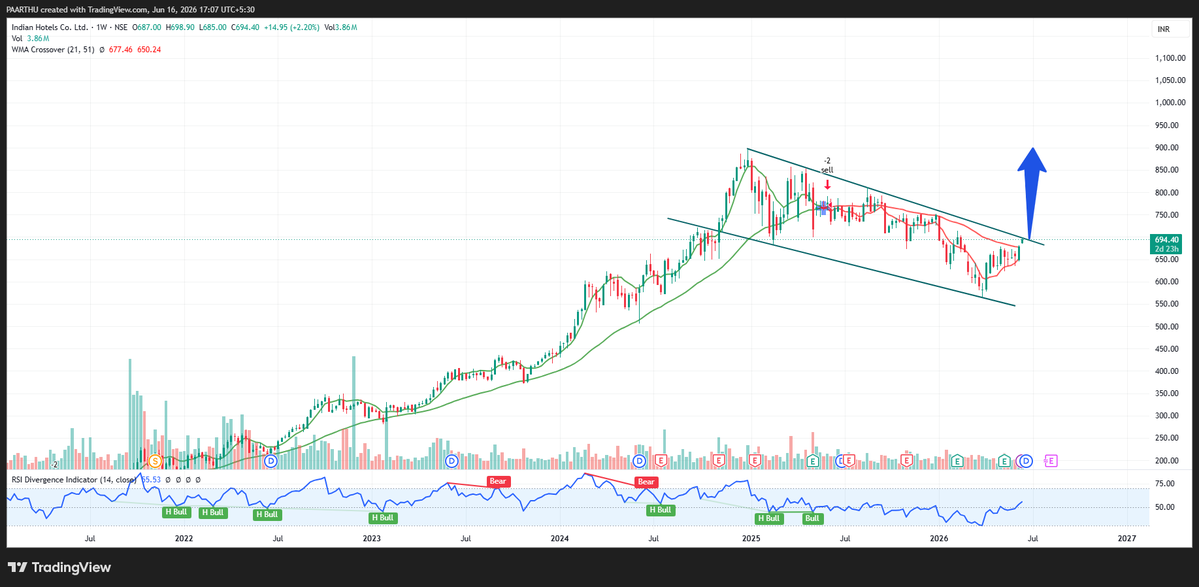
INDIAN HOTELS – FALLING CHANNEL BREAKOUT
After a strong multi-year uptrend, Indian Hotels underwent a healthy correction and has been consolidating within a falling channel. Price is now testing the upper boundary of the channel, making this a crucial breakout zone.
Well-defined falling channel after the recent correction
Strong rebound from the ₹580–600 support area
Price reclaiming short and medium-term moving averages
RSI turning upward above 50, indicating momentum recovery
Recent higher lows suggest accumulation near support
Price approaching channel resistance after a sharp recovery.
Immediate Resistance: ₹700–720 zone
Breakout Trigger: Sustained weekly close above ₹720
Strong Support: ₹640–650 zone
Major Support: ₹580–600 zone
Indian Hotels appears to be completing a corrective phase within a larger primary uptrend. The recovery from recent lows has been supported by improving momentum and constructive price action.
📌 Key Observation:
The ₹700–720 zone is the decisive resistance area. A strong weekly breakout above this level with volume support could trigger the next leg of the uptrend toward ₹800–900.As long as the stock holds above ₹640, the medium-term bullish structure remains intact.
#IndianHotels #IHCL #HospitalityStocks #BreakoutWatch #StockMarketIndia #TechnicalAnalysis #SwingTrading #NSE #ChartSetup #talkwithcandle
5
77
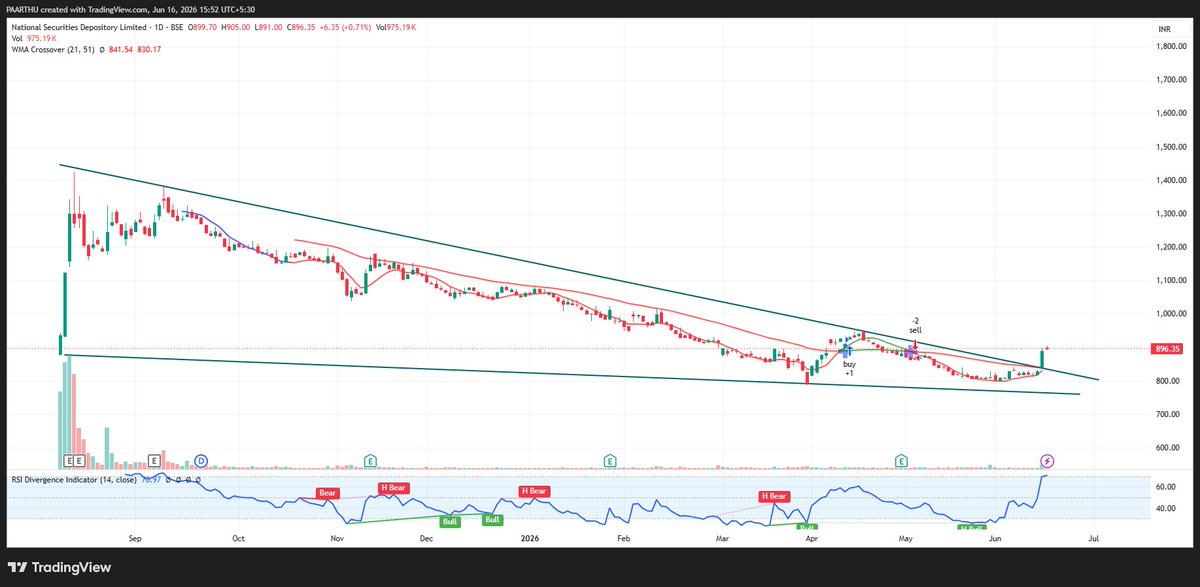
NSDL – FALLING WEDGE BREAKOUT
NSDL appears to be emerging from a prolonged corrective phase and is attempting a breakout from a broad falling wedge structure. The recent surge in price and RSI indicates improving momentum after months of consolidation.
Broad falling wedge pattern visible since listing highs
Strong bullish breakout candle near wedge resistance
Price reclaiming key moving averages
RSI near 70, showing strong momentum expansion
Volume spike accompanying the breakout attempt
Higher lows forming from the ₹800 support zone.
Immediate Resistance: ₹900–920 zone
Breakout Trigger: Sustained close above ₹920
Strong Support: ₹840–850 zone
Major Support: ₹780–800 zone
After months of lower highs and corrective price action, NSDL is showing signs of accumulation. The stock has reached a crucial technical juncture where buyers are attempting to regain control.
📌 Key Observation:
The ₹900–920 zone is the immediate hurdle. A decisive breakout with strong volume could trigger a momentum move toward ₹1,000–1,250 in the coming months.
As long as price remains above ₹840–850, the short-term structure remains constructive and favors further upside.
#NSDL #FinancialServices #BreakoutWatch #StockMarketIndia #TechnicalAnalysis #SwingTrading #BSE #ChartSetup #talkwithcandle
6
136
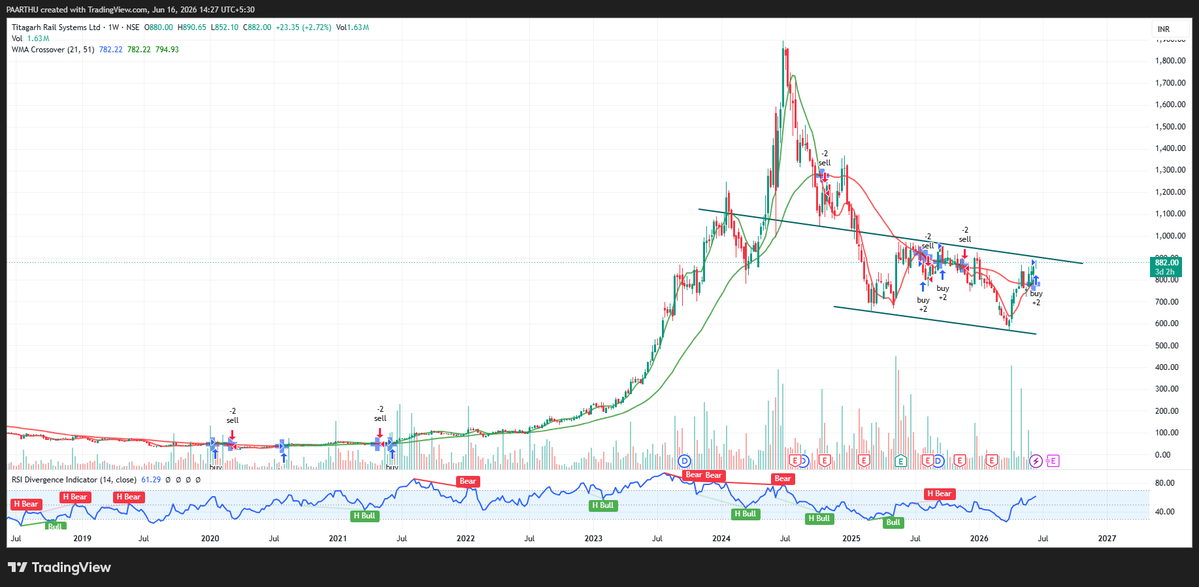
TITAGARH RAIL SYSTEMS – FALLING CHANNEL BREAKOUT
After a steep correction from the all-time highs near ₹1,900, Titagarh Rail Systems appears to be forming a recovery structure within a falling channel. Price is now approaching the upper boundary resistance, making the current zone technically important.
Multi-month falling channel formation visible
Strong rebound from the ₹600–650 support zone
Higher lows forming since the recent bottom
Price trading above short and medium-term moving averages
RSI above 60 and rising, indicating improving momentum
Volume expansion seen during recent recovery rallies
Immediate Resistance: ₹880–900 zone
Breakout Trigger: Sustained weekly close above ₹900
Strong Support: ₹780–800 zone
Major Support: ₹650–700 zone
The stock appears to be transitioning from correction to accumulation. The falling resistance line that has capped rallies for several months is now being tested again.
📌 Key Observation:
The ₹880–900 zone is the critical breakout area. A strong weekly close above this zone with rising volume could trigger a momentum move toward ₹1,000–1,250 over the medium term.
As long as price remains above ₹780, the recovery structure remains intact and the bullish bias continues.
#TitagarhRail #RailwayStocks #BreakoutWatch #StockMarketIndia #TechnicalAnalysis #SwingTrading #NSE #ChartSetup #TALKWITHCANDLE
4
189
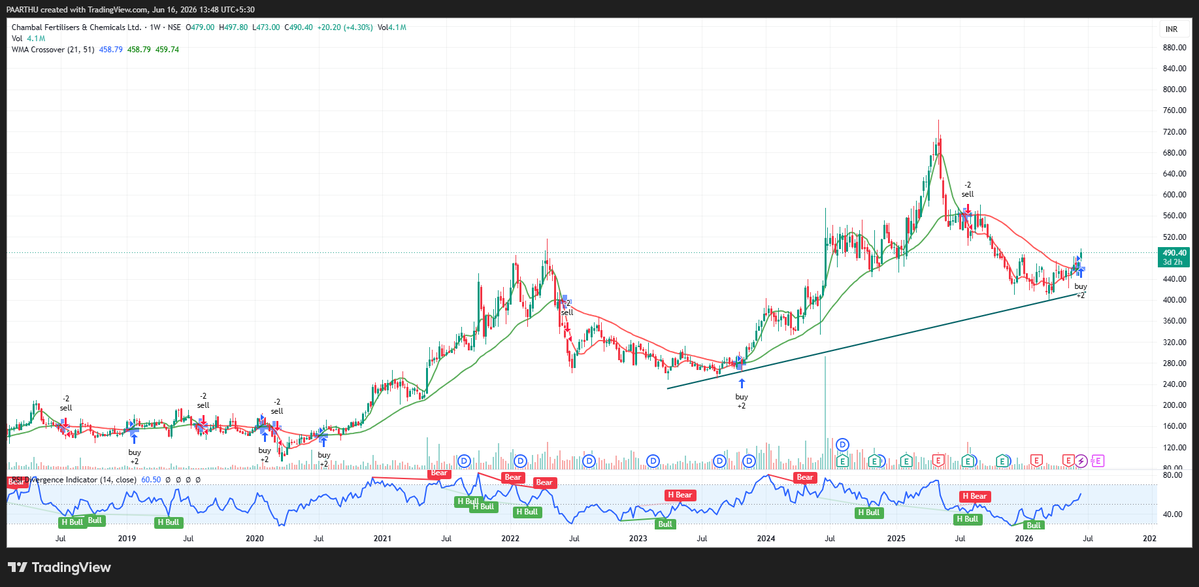
CHAMBAL FERTILISERS – ROUNDING BOTTOM BREAKOUT
After a prolonged corrective phase from the 2025 highs, Chambal Fertilisers appears to be forming a rounded recovery structure and is now approaching a key resistance zone. The stock has reclaimed major moving averages and is showing improving momentum.
Long-term uptrend support remains intact
Strong recovery from the ₹420–430 demand zone
Price trading above 21 & 51-period moving averages
Higher low formation visible on the weekly chart
RSI near 60 and rising, indicating bullish momentum
Recent bullish crossover signals strengthening trend
Immediate Resistance: ₹500–520 zone
Breakout Trigger: Sustained weekly close above ₹520
Strong Support: ₹450–460 zone
Major Support: ₹420–430 zone
Chambal Fertilisers is showing signs of renewed strength after a lengthy consolidation and correction phase. The stock has established a series of higher lows and is gradually approaching a crucial resistance area.
Key Observation:
The ₹500–520 zone is the key hurdle. A decisive breakout above this level, supported by strong volume, could trigger a fresh momentum rally toward ₹560–700.
As long as the stock remains above ₹450, the weekly structure remains constructive and favors further upside.
#ChambalFertilisers #FertilizerStocks #BreakoutWatch #StockMarketIndia #TechnicalAnalysis #SwingTrading #NSE #ChartSetup #talkwithcandle
4
138
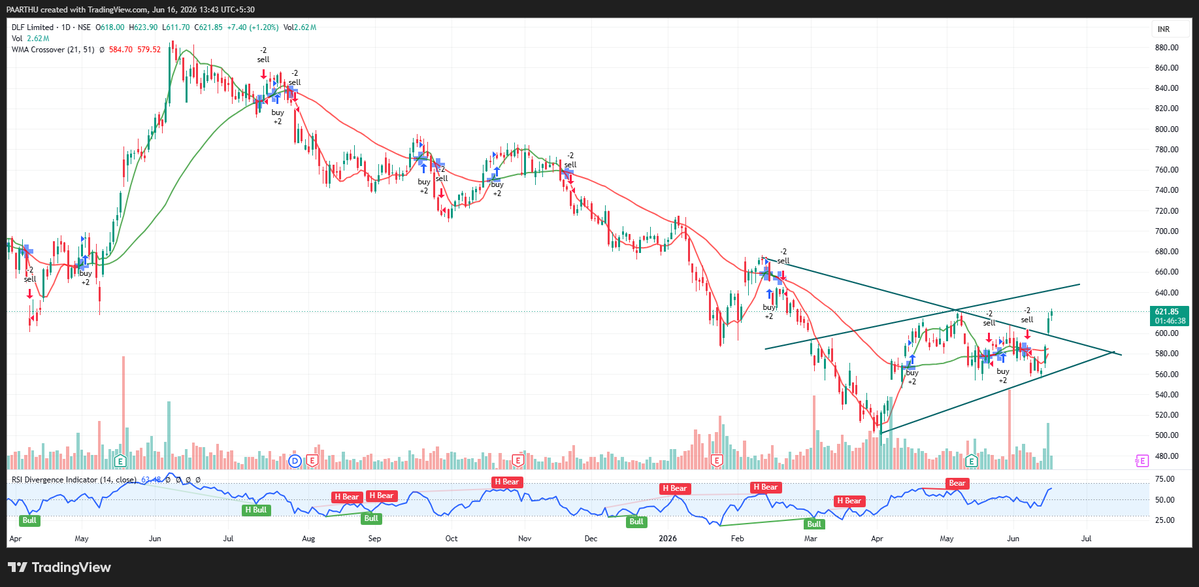
DLF – SYMMETRICAL TRIANGLE BREAKOUT
After a sharp recovery from the March lows, DLF has been consolidating within a symmetrical triangle pattern and is now approaching the upper boundary resistance. The structure suggests a potential volatility expansion move.
Symmetrical triangle formation visible after the recovery rally
Higher lows indicating gradual accumulation
Price trading above the rising trendline support
Moving averages flattening and preparing for directional move
RSI improving above 60, indicating strengthening momentum
Volume likely to be the key confirmation factor near breakout
Immediate Resistance: ₹620–625 zone
Breakout Trigger: Sustained close above ₹625
Near-Term Support: ₹580–585 zone
Major Support: ₹550–560 zone
DLF appears to be building a base after a strong rebound from its recent lows. The contracting triangle indicates a balance between buyers and sellers, which is often followed by a decisive directional move.
📌 Key Observation:
The ₹620–625 zone is the immediate breakout area. A strong close above this level with rising volume can trigger a fresh bullish leg toward ₹650–720.
As long as the stock remains above ₹580, the short-to-medium-term bias remains constructive.
#DLF #RealEstateStocks #TriangleBreakout #BreakoutWatch #StockMarketIndia #TechnicalAnalysis #SwingTrading #NSE #ChartSetup #talkwithcandle
2
89

Jun 16
Key Index Levels at a Glance!
Track the 20, 50, 100 & 200-day SMAs of key indices.
Stay aligned with the trend. 📈📉
Disclaimer: bit.ly/R_disclaimer02
#NiftyLevels #BankNifty #TechnicalAnalysis #SMA #ChartSetup #SupportResistance #MarketUpdate #StockMarketIndia #SwingTrading
1
263

Jun 15
GEM AROMATICS – FALLING WEDGE BREAKOUT
After a prolonged correction from listing highs, the stock appears to be completing a falling wedge pattern and has now broken above the descending resistance trendline with strong momentum and volume support.
Falling wedge structure visible since March highs
Recent breakout above descending trendline resistance
Strong bullish candle with notable volume expansion
Price trading above short and medium-term moving averages
RSI near 75, indicating strong bullish momentum
Higher lows forming from the ₹140 support zone.
Immediate Resistance: ₹190–200 zone
Breakout Confirmation: Sustained close above ₹190
Strong Support: ₹160–165 zone
Major Support: ₹140–145 zone
Gem Aromatics is showing early signs of trend reversal after a lengthy corrective phase. The breakout above the falling trendline, improving RSI, and strong volume participation suggest accumulation by buyers.
📌 Key Observation:
The ₹190–200 zone is the next important hurdle. A decisive breakout and sustained close above this resistance can trigger fresh momentum towards ₹210–250.
As long as the stock holds above ₹160–165, the bullish breakout structure remains intact.
#GemAromatics #ChemicalStocks #TrendlineBreakout #BreakoutSetup #StockMarketIndia #TechnicalAnalysis #SwingTrading #NSE #ChartSetup #TALKWITHCANDLE

1
3
216
Jun 15
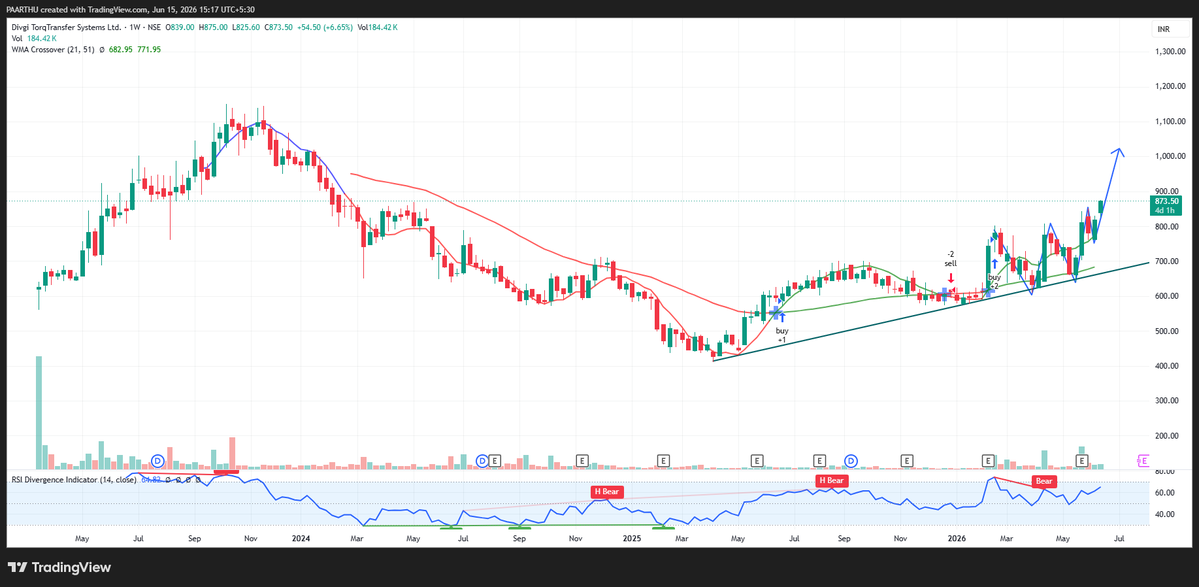
DIVGI TORQTRANSFER SYSTEMS – TREND CONTINUATION BREAKOUT
The stock has been forming a strong sequence of higher highs and higher lows since its 2025 bottom and is currently attempting a breakout from a multi-month consolidation range. Price action suggests accumulation within a rising trend structure.
Strong uptrend supported by a rising trendline
Consistent higher high–higher low formation
Price trading above key moving averages
Recent pullbacks finding support near the rising trendline
RSI holding above 60, indicating bullish momentum
Volume expansion visible during recent advances
Immediate Resistance: ₹880–900 zone
Breakout Trigger: Sustained weekly close above ₹900
Trendline Support: ₹700–720 zone
Major Support: ₹620–650 zone
Divgi TorqTransfer is showing signs of a strong trend continuation after spending several months consolidating within an established uptrend. The rising trendline remains intact, moving averages are positively aligned, and momentum indicators continue to support the bullish case.
📌 Key Observation:
The ₹880–900 zone is the decisive resistance area. A convincing weekly breakout above this level with strong volume could trigger the next leg higher toward ₹1,000–1,250.
As long as the stock remains above the rising trendline near ₹700–720, the medium-term trend remains positive.
#DivgiTorqTransfer #AutoAncillary #BreakoutSetup #TrendContinuation #StockMarketIndia #TechnicalAnalysis #SwingTrading #NSE #ChartSetup #TALKWITHCANDLE
3
80
Jun 15
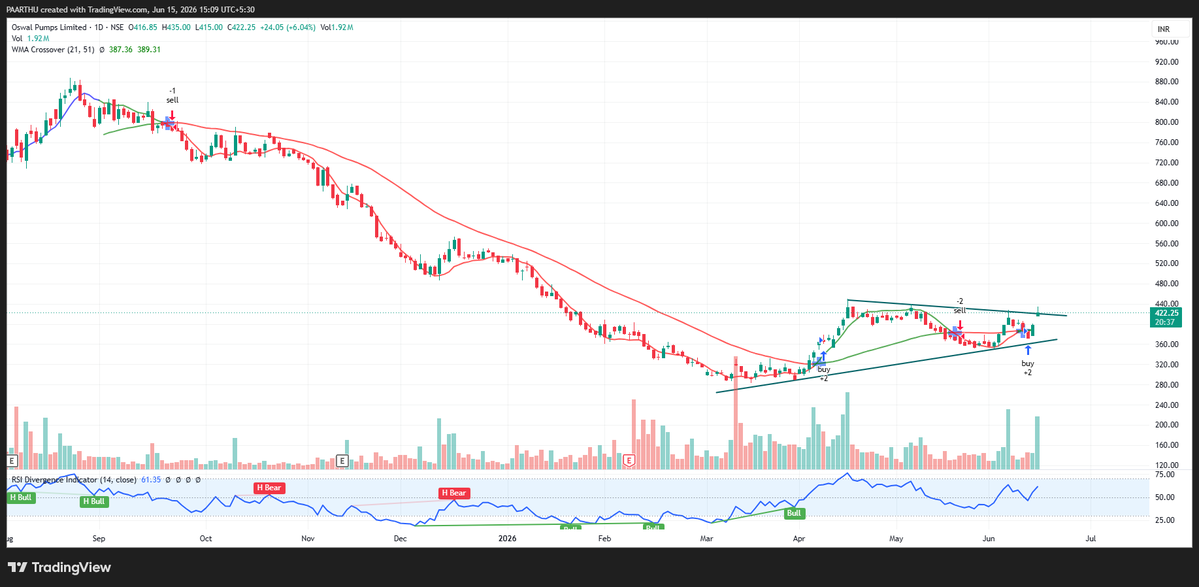
OSWAL PUMPS – ASCENDING TRIANGLE BREAKOUT
After a prolonged correction from listing highs, the stock has built a strong base and is now consolidating within an ascending triangle pattern near resistance. Recent price action suggests accumulation and increasing breakout potential.
Strong recovery from the ₹280–300 bottom zone
Ascending triangle formation with rising support trendline
Price trading above key moving averages
Higher lows indicating steady buying interest
RSI near 61, showing strengthening bullish momentum
Recent volume expansion supporting accumulation
Immediate Resistance: ₹425–435 zone
Breakout Trigger: Sustained close above ₹435
Trendline Support: ₹380–390 zone
Major Support: ₹340–350
Oswal Pumps appears to be transitioning from a recovery phase into a potential uptrend continuation. The ascending triangle pattern, rising RSI, and price holding above moving averages indicate growing bullish strength.
📌 Key Observation:
The ₹425–435 zone is the decisive breakout area. A strong close above this resistance with volume confirmation could trigger the next momentum leg toward ₹480–600. Until then, the stock remains constructive as long as it holds above the rising support zone near ₹380–390.
#OswalPumps #IndustrialStocks #AscendingTriangle #BreakoutWatch #StockMarketIndia #TechnicalAnalysis #SwingTrading #NSE #ChartSetup #TALKWITHCANDLE
4
202
Jun 15
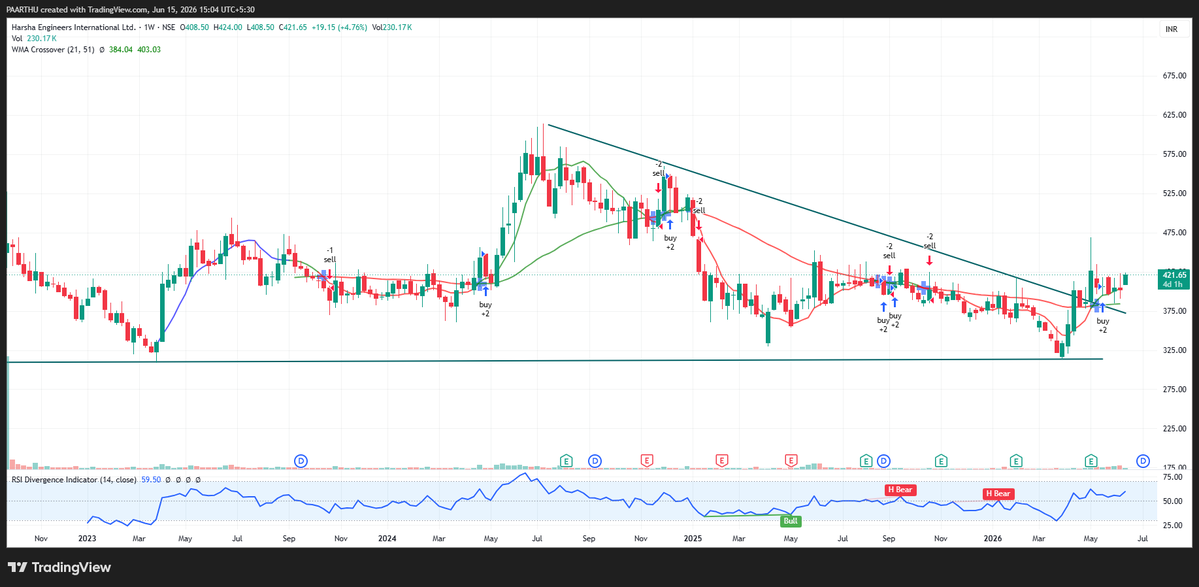
HARSHA ENGINEERS – FALLING TRENDLINE BREAKOUT
The stock appears to be emerging from a prolonged corrective phase. Price has recently broken above a long-term descending trendline and is holding above key moving averages, suggesting a potential trend reversal.
Multi-month falling trendline breakout visible
Strong rebound from the ₹310–325 demand zone
Price trading above short and medium-term moving averages
Formation of higher lows after the March 2026 bottom
RSI near 60 and rising, indicating improving momentum
Breakout followed by healthy consolidation above resistance.
Immediate Resistance: ₹425–435 zone
Major Resistance: ₹460–480 zone
Breakout Confirmation: Sustained weekly close above ₹435
Strong Support: ₹380–390
Major Support: ₹310–325
Harsha Engineers has spent several months correcting from its 2024 peak and is now showing early signs of a trend reversal. The breakout above the descending resistance line, coupled with improving RSI and moving-average alignment, points toward strengthening bullish sentiment.
Key Observation:
The ₹425–435 zone is the immediate hurdle. A decisive weekly close above this area could trigger fresh momentum and pave the way toward ₹475–575 over the medium term. As long as price remains above ₹380, the bullish bias remains intact.
#HarshaEngineers #IndustrialStocks #TrendlineBreakout #BreakoutSetup #StockMarketIndia #TechnicalAnalysis #SwingTrading #NSE #ChartSetup #TALKWITHCANDLE
3
158
Jun 15
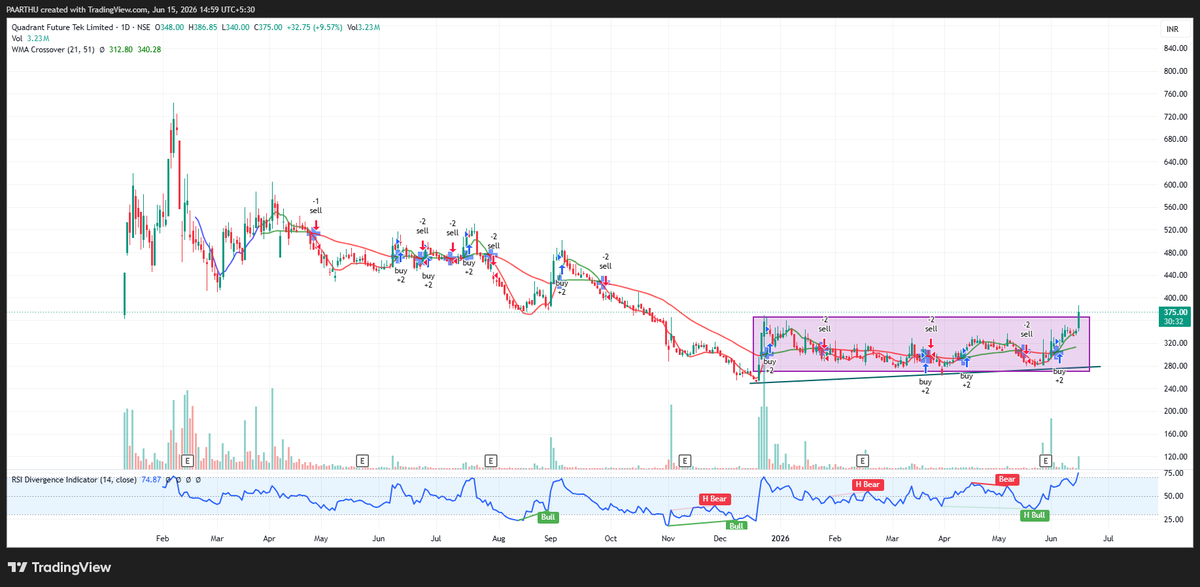
QUADRANT FUTURE TEK – RECTANGLE BREAKOUT SETUP
The chart shows a prolonged consolidation phase after a sharp decline from listing highs. Price has now moved above the upper boundary of a multi-month trading range with a strong bullish candle and volume expansion, indicating a potential breakout.
Multi-month rectangular consolidation between ₹270–350
Strong breakout candle above range resistance
Significant increase in volume during breakout attempt
Price trading above both moving averages
RSI near 75, showing strong bullish momentum
Higher lows forming along the rising support trendline
Immediate Resistance: ₹375–385 zone
Breakout Confirmation: Sustained close above ₹380
Range Support: ₹340–350
Major Support: ₹300–310
Key Observation:
The ₹375–380 zone is the most important level on the chart. A decisive close above this area can trigger fresh buying interest and open the path toward ₹420–500 over the medium term. Until then, traders should watch whether the breakout holds above the previous consolidation range around ₹340–350.
#QuadrantFutureTek #BreakoutSetup #RectangleBreakout #StockMarketIndia #TechnicalAnalysis #SwingTrading #NSE #ChartSetup #TALKWITHCANDLE
4
163
Jun 15
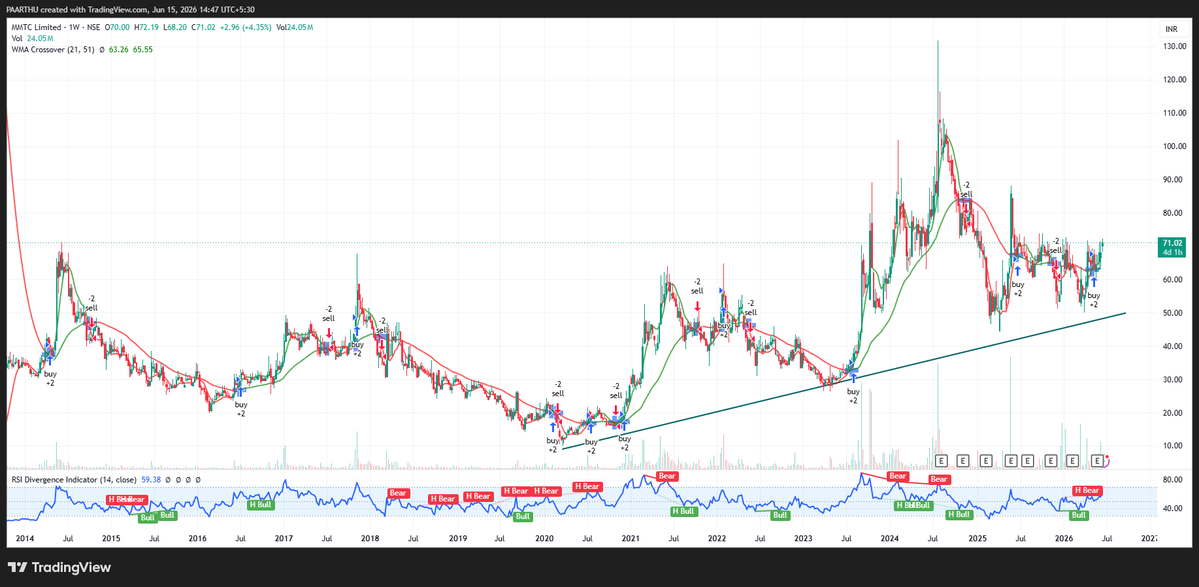
MMTC – LONG-TERM RECOVERY & RESISTANCE BREAKOUT
MMTC appears to be emerging from a prolonged consolidation phase after the sharp correction from the 2024 highs. The long-term rising trendline remains intact, and recent price action suggests renewed accumulation.
Long-term ascending support trendline intact since 2020–21
Strong recovery from the ₹55–60 demand zone
Price trading above both moving averages
Recent higher-low formation visible
RSI near 60 and improving, indicating strengthening momentum
Price attempting to reclaim an important resistance zone
The chart is showing a constructive setup. Unlike the earlier sharp rallies driven by momentum spikes, the current structure appears more stable with higher lows developing above long-term support.
A decisive weekly close above ₹75 could signal the beginning of a fresh medium-term uptrend.
Key Observation:
The ₹72–75 zone is the decision area. A breakout above this zone can open the path toward ₹85–95, while rejection may keep the stock range-bound between ₹60–75 for some more time.
#mmtc ##AscendingChannel #TrendContinuation #StockMarketIndia #TechnicalAnalysis #SwingTrading #MomentumTrading #NSE #ChartSetup #TALKWITHCANDLE
3
286
Jun 15
Key Index Levels at a Glance!
Track the 20, 50, 100 & 200-day SMAs of key indices.
Stay aligned with the trend. 📈📉
Disclaimer: bit.ly/R_disclaimer02
#NiftyLevels #BankNifty #TechnicalAnalysis #SMA #ChartSetup #SupportResistance #MarketUpdate #StockMarketIndia #SwingTrading
1
312

Jun 13
Yes. I’m seeing it too. Investigating. Keep me posted on what you are seeing.
54
Jun 12
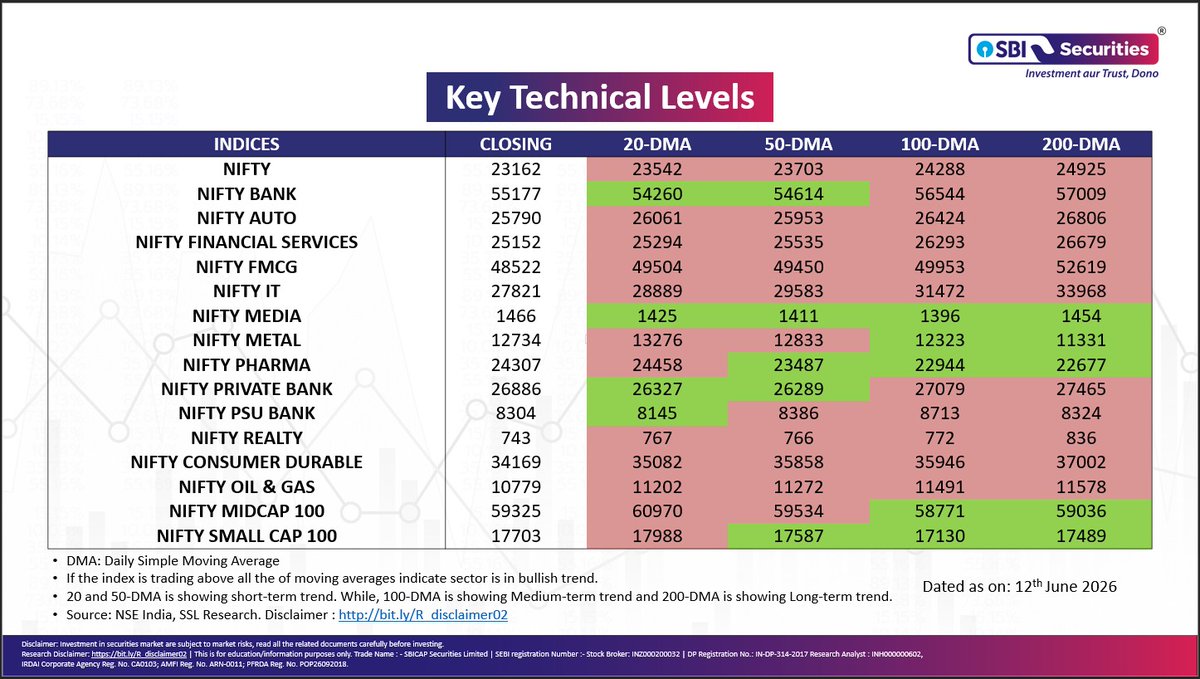
Key Index Levels at a Glance!
Track the 20, 50, 100 & 200-day SMAs of key indices.
Stay aligned with the trend. 📈📉
Disclaimer: bit.ly/R_disclaimer02
#NiftyLevels #BankNifty #TechnicalAnalysis #SMA #ChartSetup #SupportResistance #MarketUpdate #StockMarketIndia #SwingTrading
1
1
226
Jun 11
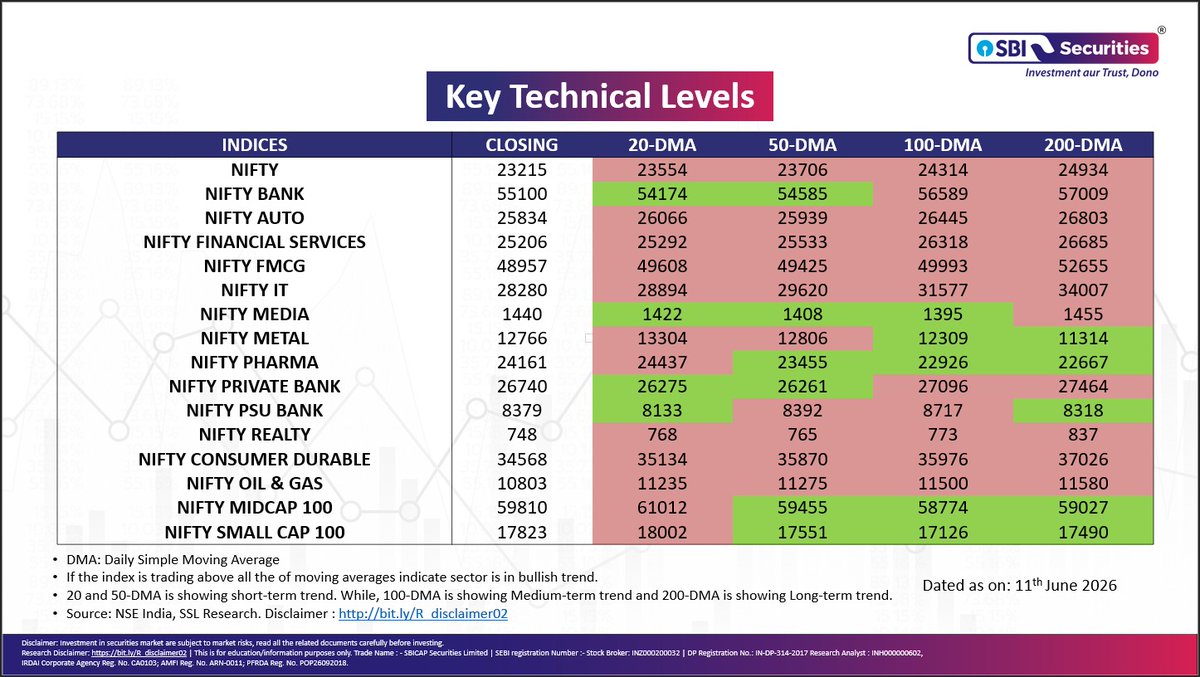
Key Index Levels at a Glance!
Track the 20, 50, 100 & 200-day SMAs of key indices.
Stay aligned with the trend. 📈📉
Disclaimer: bit.ly/R_disclaimer02
#NiftyLevels #BankNifty #TechnicalAnalysis #SMA #ChartSetup #SupportResistance #MarketUpdate #StockMarketIndia #SwingTrading
3
256
Jun 10
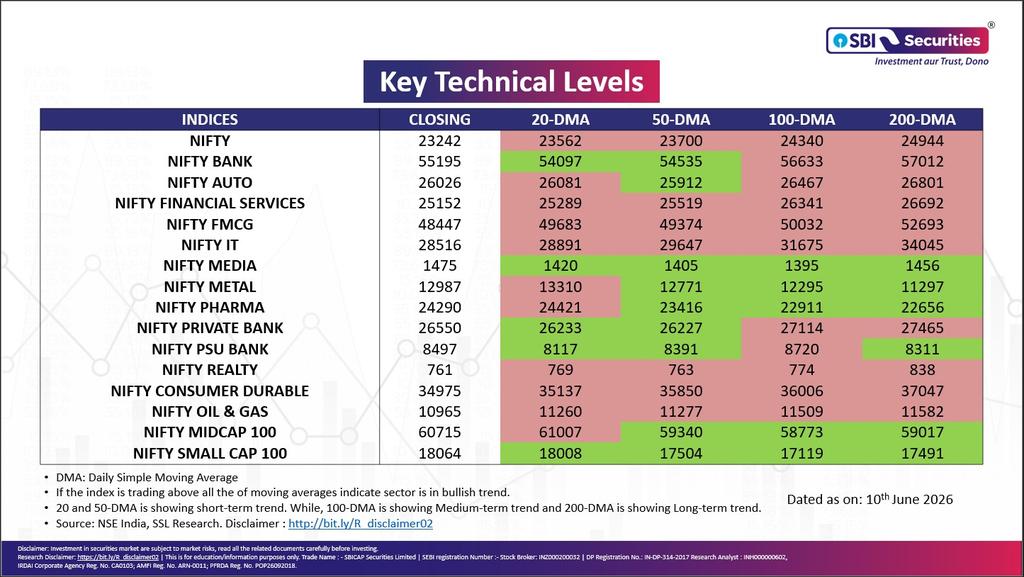
Key Index Levels at a Glance!
Track the 20, 50, 100 & 200-day SMAs of key indices.
Stay aligned with the trend. 📈📉
Disclaimer: bit.ly/R_disclaimer02
#NiftyLevels #BankNifty #TechnicalAnalysis #SMA #ChartSetup #SupportResistance #MarketUpdate #StockMarketIndia #SwingTrading
1
346
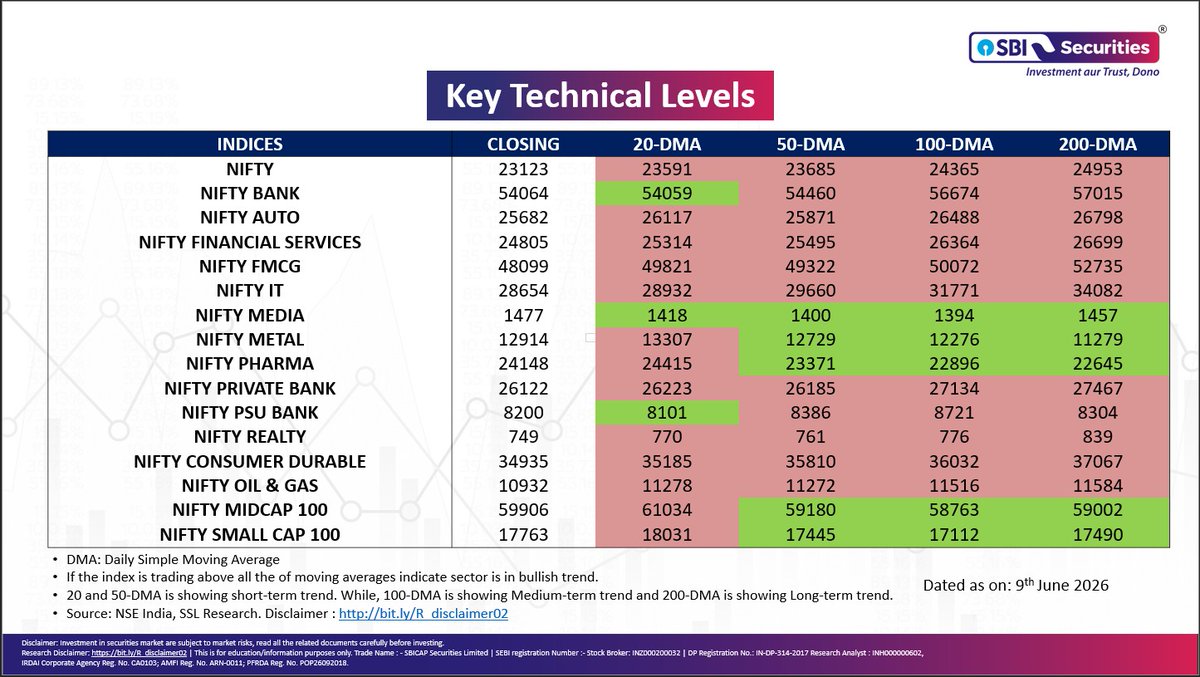
Key Index Levels at a Glance!
Track the 20, 50, 100 & 200-day SMAs of key indices.
Stay aligned with the trend. 📈📉
Disclaimer: bit.ly/R_disclaimer02
#NiftyLevels #BankNifty #TechnicalAnalysis #SMA #ChartSetup #SupportResistance #MarketUpdate #StockMarketIndia #SwingTrading
3
271
Key Index Levels at a Glance!
Track the 20, 50, 100 & 200-day SMAs of key indices.
Stay aligned with the trend. 📈📉
Disclaimer: bit.ly/R_disclaimer02
#NiftyLevels #BankNifty #TechnicalAnalysis #SMA #ChartSetup #SupportResistance #MarketUpdate #StockMarketIndia #SwingTrading

2
230