
🚀 Before this chart goes viral...
❤️ Like if you see the setup.
🔄 Repost if you believe patience creates wealth.
💬 Comment "SRF" if you're tracking this breakout.
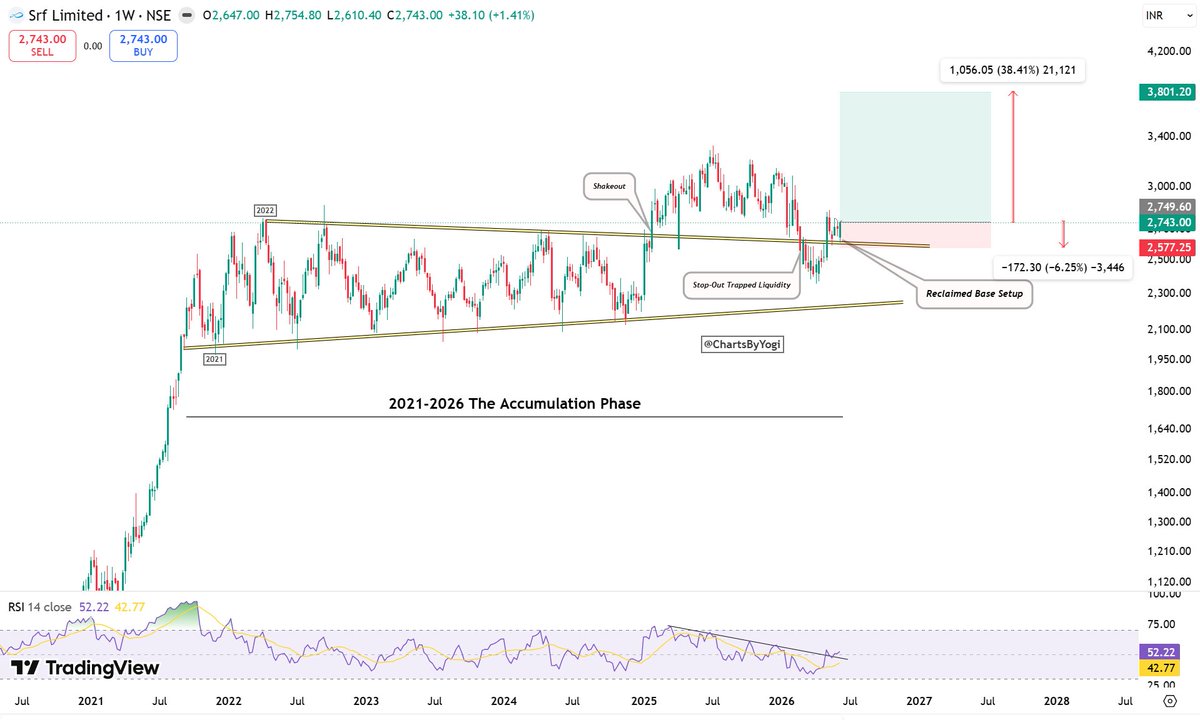
#SRF early 5 years (2021-2026), price has moved inside a massive consolidation range
The longer the base,
The bigger the potential move.
📊 Technical observations:
✅ Weekly structure remains constructive above ₹2,550-2,600 zone
✅ Previous resistance is attempting to flip into support
✅ RSI has recovered from weak levels and is turning higher
✅ Risk-reward remains favorable as downside is clearly defined
🎯 If buyers successfully defend this reclaimed base, the chart suggests a potential move toward the ₹3,800 zone over time.
That's roughly a 38% upside from current levels.
Remember:
Markets transfer shares from impatient participants to patient participants.
After 5 years of accumulation, SRF looks closer to the beginning of a new expansion phase than the end of one. 🚀
Not a recommendation. Manage risk accordingly.
#SRF #StockMarketIndia #NSE #TechnicalAnalysis #SwingTrading #Investing #BreakoutStocks #ChartOfTheDay #IndianStocks #WealthCreation #SmartMoney #PriceAction #StocksToWatch 📈🔥🚀

💥 Stocks Near 200-EMA 👀
📊 Often a key support/resistance zone where big moves can begin.
🔹 INDOCO
🔹 IDFC First Bank
🔹 AIIL
🔹 TBZ
🔹 Can Fin Homes
🔹 GAIL
🔹 Concord Biotech
🔹 Ramkrishna Forgings
🔹 Religare
🔹 V-Mart
🔹 Kotak Mahindra Bank
🔹 Page Industries
📌 Keep these stocks on your watchlist.
#200EMA #StocksToWatch #TechnicalAnalysis #IDFCFirstBank #KotakBank #GAIL #StockMarketIndia #Trading
2
17

20m
#Silver #XAGUSD #SilverPrice #SilverMarket #SilverTrading #PreciousMetals #Bullion #SilverBullion #MetalsMarket #CommodityMarket #Commodities #Investing #Trading #PriceAction #TechnicalAnalysis #MarketAnalysis #FuturesTrading #GlobalMarkets #SafeHaven #InflationHedge #WealthPreservation #StockMarket #Finance #Markets #Trader #Investors #EconomicOutlook #MacroEconomics #SilverInvesting #PhysicalSilver

6
As long as it holds above ₹128-130, the path of least resistance remains upward.
🎯 Technical projection points towards ₹160 (~20% upside) in the coming months.
#RICOAUTO #AutoAncillary #BreakoutStocks #TechnicalAnalysis #NSE #StocksToWatch #ChartOfTheDay #StockMarketIndia 📊💰🔥

4
62

📊 THE $BTC 6-MONTH PATTERN:
Red candles → then the green reversal. 🔴➡️🟢
Every cycle:
• 2015 → 3 red (the one exception) ✅
• 2018 → 2 red ✅
• 2022 → 2 red ✅
• 2026 → red candle 2 → reversal loading ⏳
History doesn't repeat, but it often rhymes. 🐂
#Bitcoin #BTC #TechnicalAnalysis #CryptoCycle
13

Is your stock in an uptrend?
Is a bull flag forming right now?
What are the last 3 candles saying?
PivChart answers all three — free, for every NSE/BSE stock.
pivchart.com
#NSE #Nifty #StockMarket #TechnicalAnalysis
33

Big-screen analysis. Pocket-sized device. The FxPro App takes serious charting wherever you go.
#FxProApp #TechnicalAnalysis #MobileCharts


Are you fading this bounce or waiting for confirmation before pulling the trigger on $ETH? Drop your levels below — and check the full AI analysis at traderead.ai
#Crypto #TechnicalAnalysis
11

التحليل الفني
يعتمد التحليل الفني على دراسة الرسوم البيانية وحركة الأسعار لفهم الاتجاهات المحتملة في السوق واتخاذ قرارات مبنية على البيانات.
مع SwissFS - الشركة السويسرية نوفر محتوى يساعدك على تطوير فهمك للأسواق المالية.
⚠️ التداول ينطوي على مخاطر وقد لا يكون مناسبًا لجميع المستثمرين.
#SwissFS #الشركة_السويسرية #التحليل_الفني #TechnicalAnalysis #فوركس #تداول #Forex #الأسواق_المالية
3

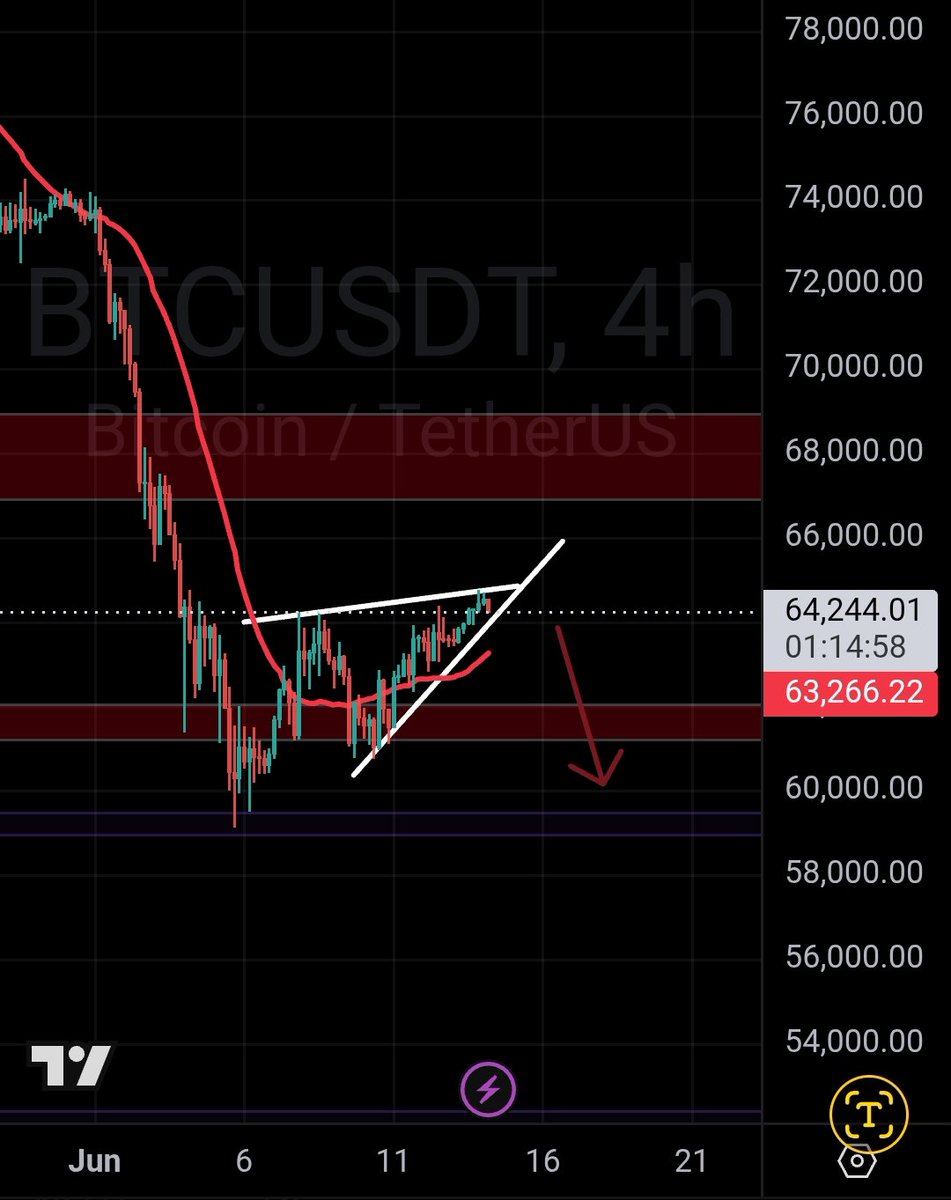
Btc now!
📉 Bitcoin is making another move toward the $59K level. With the current weak bullish structure, a rejection at dynamic resistance and a pullback toward $59K and below remains a likely scenario. ⚠️📊
#Bitcoin #BTC #Crypto #TechnicalAnalysis #CryptoMarket
1
12

Mentre i mercati tradizionali festeggiano l'ottimismo geopolitico sul fronte USA-Iran, la mappa dei flussi dietro le quinte ci mostra una struttura chiarissima. Sul grafico mensile il rapporto OTHERS.D / BTC.D sta stampando un Golden Cross storico che non si vedeva da 5 anni. Quando Bitcoin avrà finito di consolidare la sua struttura e la Fed avrà parlato, la rotazione di liquidità verso le altcoin storiche e decentralizzate sarà inevitabile. Inoltre, l'avanzamento al Senato del CLARITY Act potrebbe richiamare quantità enermi di denaro. Allacciate le cinture per la volatilità pre-Fed di mercoledì. Chi opera in Spot ignora il rumore orario e segue i muri dei grandi capitali. La molla è tesa. 💎🔋 #Bitcoin #BTC #EthereumClassic #ETC #CryptoTrading #Coinglass #MacroEconomics #TechnicalAnalysis #WhaleAlert #ClarityAct

20

3 Breakout Stocks આપશે સુપર રિટર્ન! Next Week Stock Market
આગામી અઠવાડિયા માટેની સ્પેશિયલ વોચલિસ્ટ! આ 3 સ્ટોક્સમાં ટેકનિકલ સ્ટ્રક્ચર ખૂબ જ મજબૂત દેખાઈ રહ્યું છે
#ShareMarket #BreakoutStocks #StocksToBuy #TechnicalAnalysis #ShortTermTrading @Ajay_1108
1
1
6

59m
The 8-day Nifty squeeze is over! 🚀
A clean breakout from the yellow box, a fresh RMI Buy Signal with Positive Divergence, and a strong Weekly Marubozu candle.
Bank Nifty is also in breakout mode.
Next stop: 40 EMA (23,680) & then 24,000! 📈
$NIFTY $BANKNIFTY #TechnicalAnalysis #Breakout #StockMarketIndia #PriceAction
SEBI Registered Name: Indiacharts Data Analytics Private Limited.
SEBI Registration No: INH000023630.
1
143

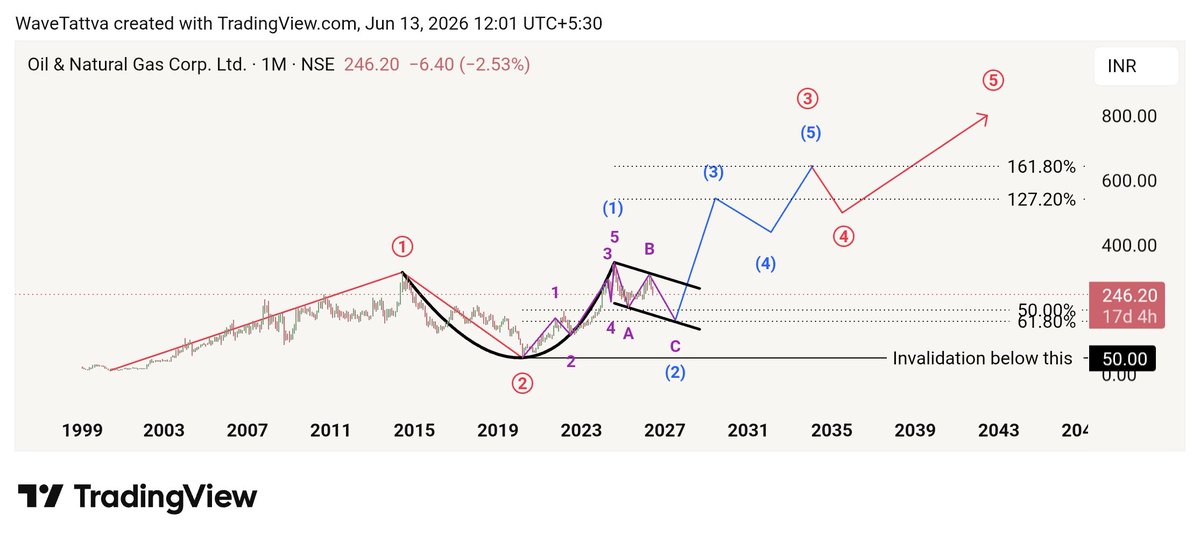
#ONGC it is.
This #Nifty50 stock is poised to give 3X-4X returns in mid term.
A goldmine just waiting for the miners!
#StockMarketIndia
#ElliottWave
#TechnicalAnalysis
Jun 13

This giant on monthly TF is correcting under wave 2 of 3 and forming handle of the cup and handle pattern.
Soon it will start its flight under wave 3 of 3.
Can you guess the stock name?
To know the name, join my free telegram channel (link in bio).
#Nifty50
#StockMarketIndia

1
2
76

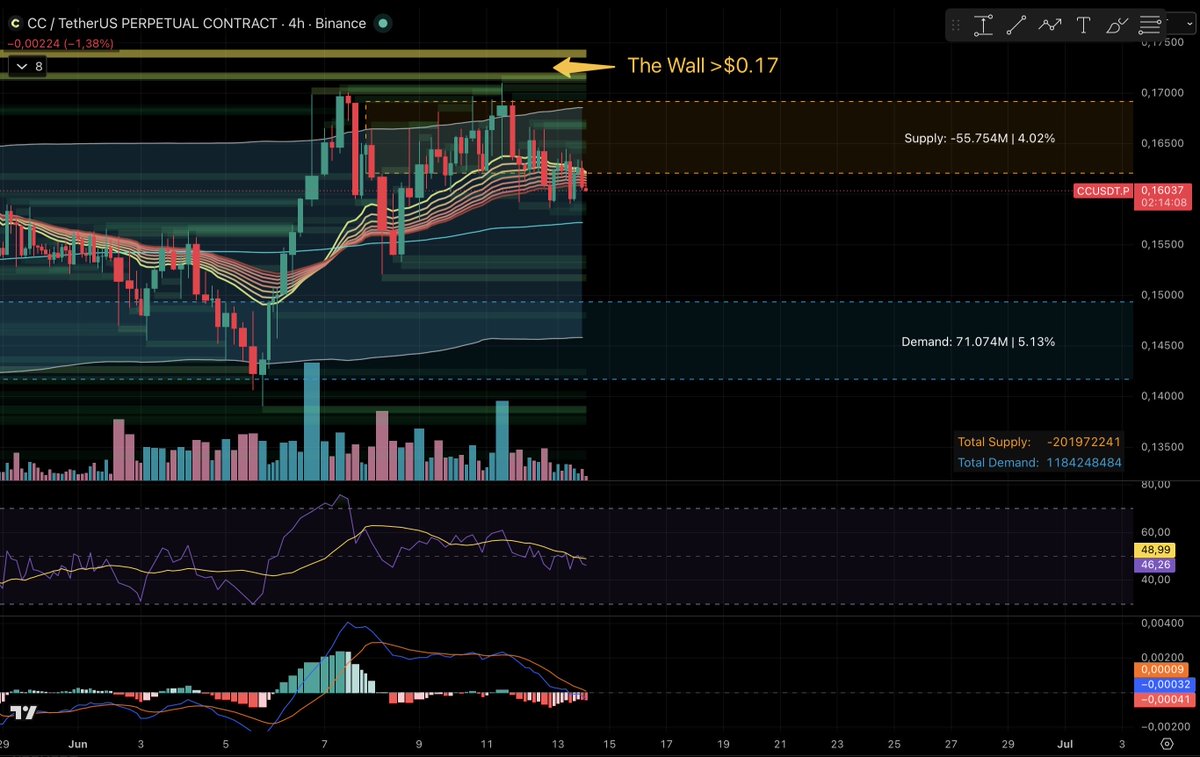
📊 Status quo for canton-network:native
So far, $CC has failed to break through the upper resistance zone at $0.17, while trading volume has continued to decline. 📉 Increased selling pressure has pushed the price back into a supply zone that is currently weighing on the market.
As a result, we’re once again moving closer to the middle of the Bollinger Bands and the 200 SMA on the 4H chart. The recent upward move caused the EMA bands within the EMA Ribbon to spread further apart, but this typically leads to price eventually returning toward the center of the bands. 🎯
The bulls failed to take full advantage of the recent upward momentum, and both the RSI and MACD have now moved below their signal lines, hovering close to the zero line. ⚠️
Let’s see what today’s session brings. 👀
A little bird whispered to me that Trump might inject some extra energy into the market today. 🚀🇺🇸
#CC #Crypto #Altcoins #TechnicalAnalysis #Trading #Charts #PriceAction #BollingerBands #EMA #RSI #MACD #CryptoCommunity #Bullish #MarketUpdate
1
1
46

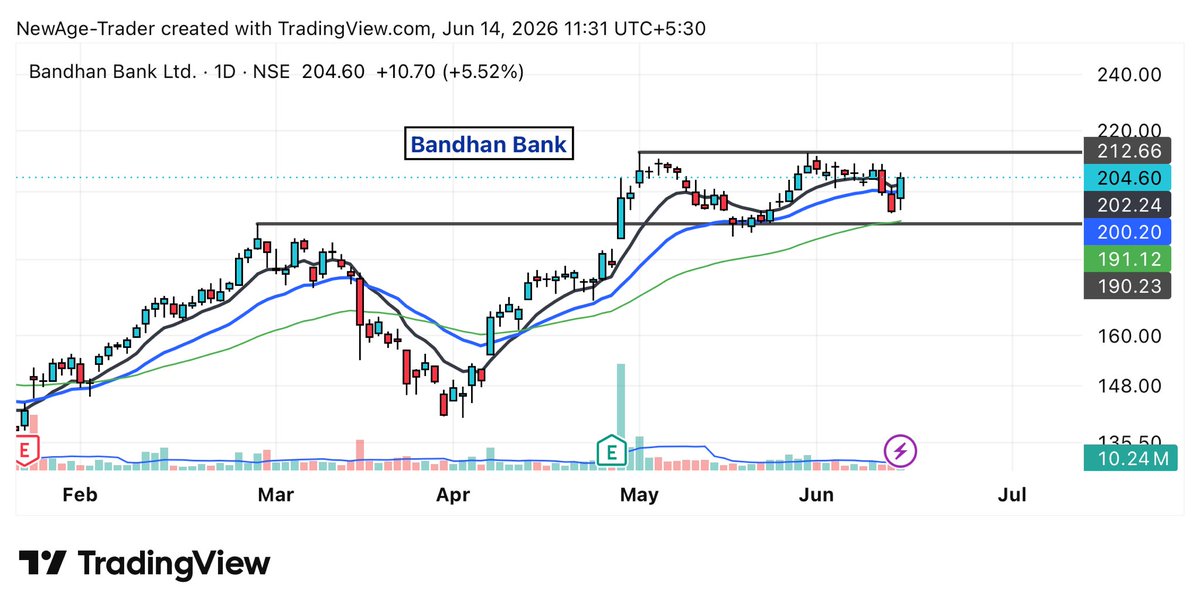
#BandhanBank looks like forming #VCP..
Interesting zone to watch now.. need #tight range for entry.
Will you trade or skip this setup?
#Nifty #Nifty50 #Sensex #IndianStocks #StockMarketIndia #FinTwit #Trading #BSE #NSE #PriceAction #SwingTrading #TechnicalAnalysis
85
#SANDHAR might still deliver a good move from here, but it is no longer on my priority list.
It isn’t part of my Value Watchlist anymore. My focus has shifted to a few stronger setups for next week, including one futures stock being tracked closely by the NewAge Traders community. 👀
Want to know what we’re tracking instead?
#Nifty #Nifty50 #Sensex #IndianStocks #StockMarketIndia #FinTwit #Trading #BSE #NSE #PriceAction #SwingTrading #TechnicalAnalysis


Good Morning 🌼
Several stocks that later delivered significant moves—including #TIMEX, #JAYBARMARU, #VIMTALABS, #ZENTEC and many others—were identified through our watchlist well before they attracted broader market attention.
I am now making the same value watchlist available for less than the cost of a cup of coffee. If you are serious about improving your stock selection process and discovering opportunities early, this may be worth exploring.
For access and details, contact me on Telegram: t.me/NewAgeTraderCommunity
#Nifty #Nifty50 #Sensex #IndianStocks #StockMarketIndia #FinTwit #Trading #BSE #NSE #StocksToWatch #SwingTrading #PriceAction #TechnicalAnalysis #Investing #StockMarket
47

Most traders spend hours looking for the perfect indicator.
The reality?
No indicator can replace:
• Risk management
• Patience
• Discipline
• A clear trading plan
Indicators support decisions.
They don’t make decisions for you.
#TechnicalAnalysis #Trading #StockMarket
1
10
A chart doesn’t predict the future.
It shows probabilities.
The goal of technical analysis isn’t to be right 100% of the time.
It’s to manage risk and let probabilities work in your favor over many trades.
#TechnicalAnalysis #TradingPsychology #investingfacts
4

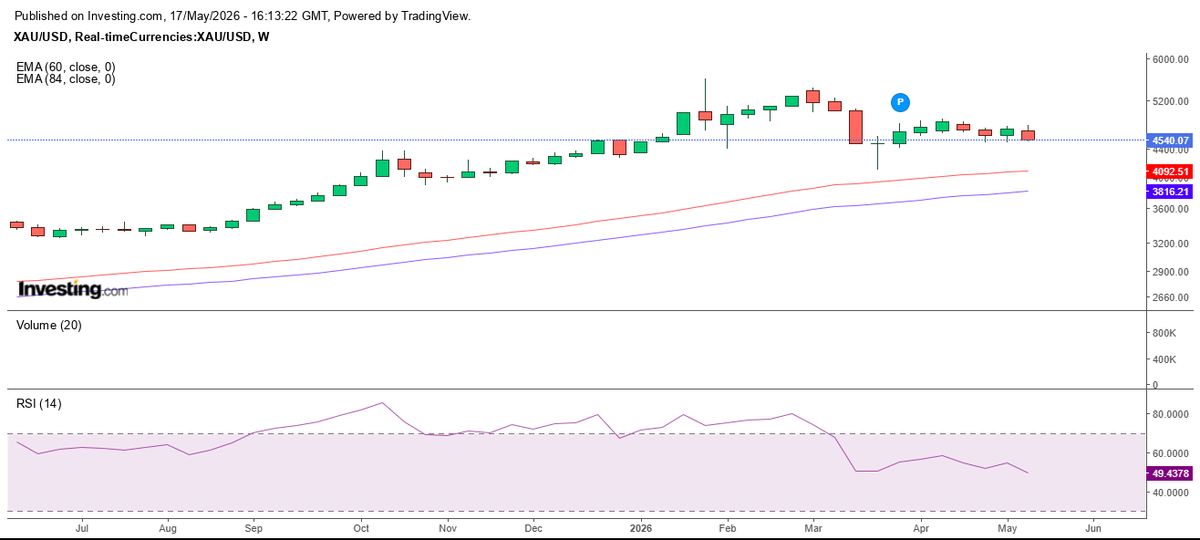
Last week Downside Target Achieved on #Gold
As highlighted earlier, a close below the key support zone of 4477 signaled further weakness in Gold.
#Gold #XAUUSD #Forex #Trading #TechnicalAnalysis #MarketUpdate #Commodities #Investing
May 17

#Gold holding above the major support zone of 4477
Any close below the 4477 price call falls towards the 4250 level.
#Gold #XAUUSD #Forex #Trading #TechnicalAnalysis #MarketUpdate #Commodities #Investing
32