Over the past 40 years, climate change has led to the shrinking of the Northern Hemisphere's seasonal snowpack. @dartmouth researchers documented these losses, which could put water supplies serving 100s of millions of people at risk. #ClimateScienceSundayhome.dartmouth.edu/news/2024…
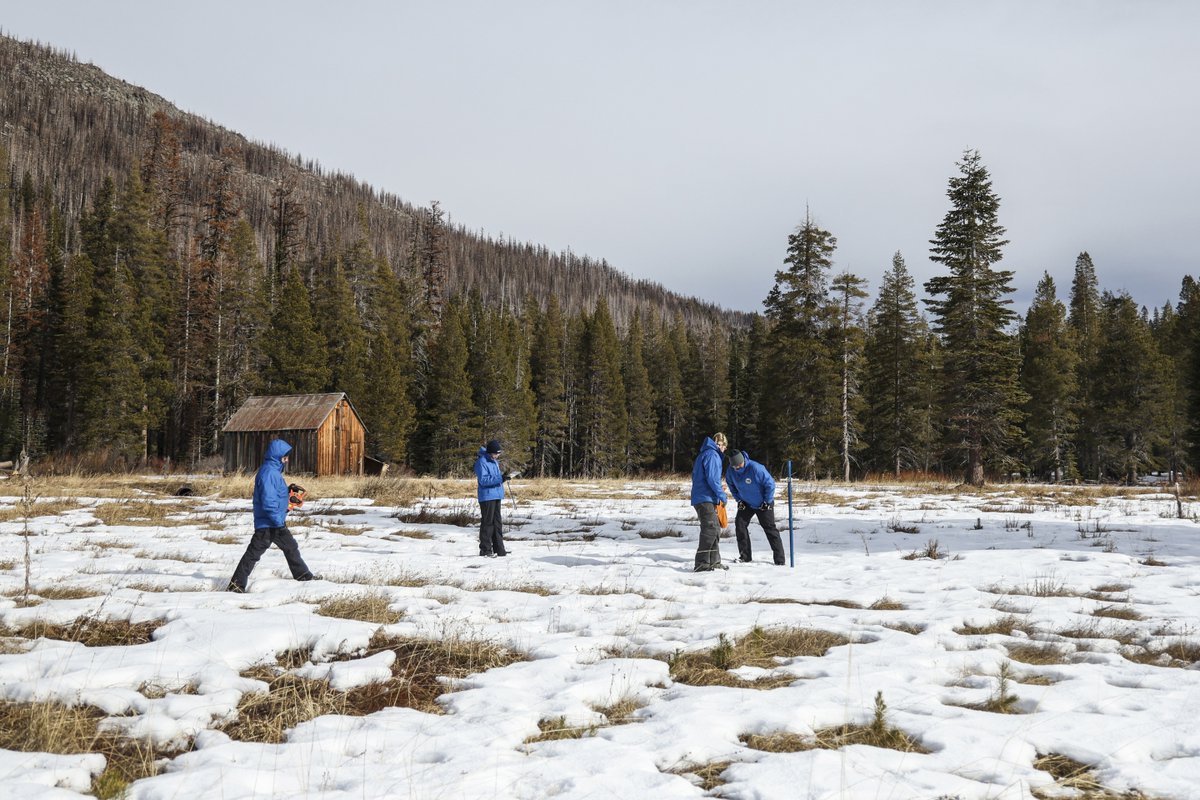
ALT Managers and engineers in winter clothes conduct the first snow survey of the year in the Sierra Nevada. They are in a field with a small layer of snow on it with mountains in the background.
Hurricanes are destructive now, but may get worse. Scientists @PNNLab found that changes in coastal conditions since 1979 have driven nearshore hurricanes to intensify faster. If warming trends continue, the rate will keep climbing. #ClimateScienceSundaypnnl.gov/news-media/coastal-…
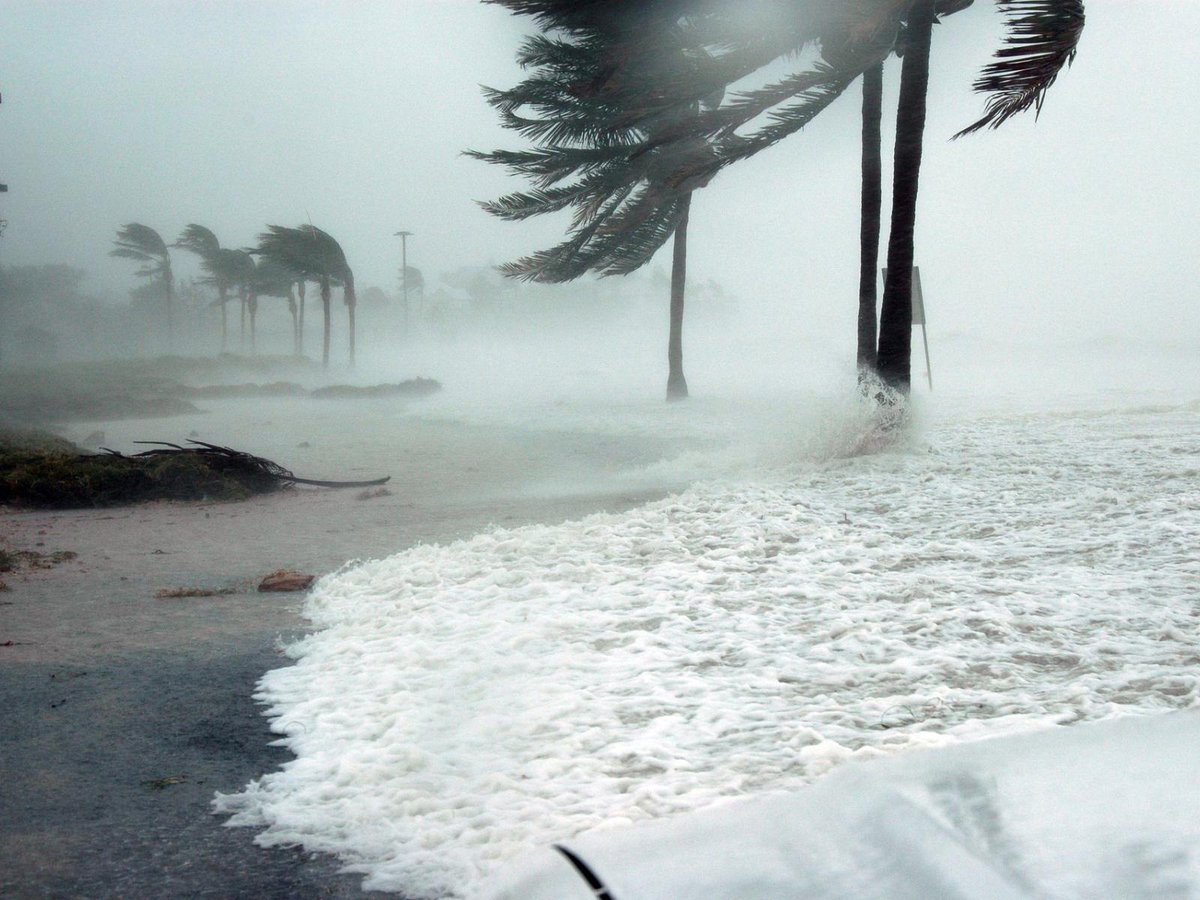
ALT A hurricane blowing palm trees and lashing water against a beach
Wetlands are the biggest natural source of the greenhouse gas methane and climate change is driving them to emit more of it. @BerkeleyLab scientists found that wetland methane emissions in the Boreal-Arctic increased ~9% since 2002. #ClimateScienceSundaynewscenter.lbl.gov/2024/02/1…
ALT An eddy covariance tower (a set of white boxes full of equipment on a large tripod), capable of measuring the release of greenhouse gases, in a tundra with mountains in the background in Alaska.
The Atlantic Meridional Overturning Circulation moves heat northward & helps maintain a temperate climate over Europe and North America. Scientists @PNNLab used climate models to explain its weakening and potential collapse. #ClimateScienceSundaypnnl.gov/publications/differ…
ALT Illustration of water circulation off the East Coast of North America represented by swirls of different colors in the ocean, with warmer water moving northward
Do we need a new category to describe hurricanes in a warming world? While the National Hurricane Center uses Categories 1-5 based on wind speed, researchers @BerkeleyLab & First St Foundation suggest a need for a Category 6. #ClimateScienceSundaynewscenter.lbl.gov/2024/02/0…
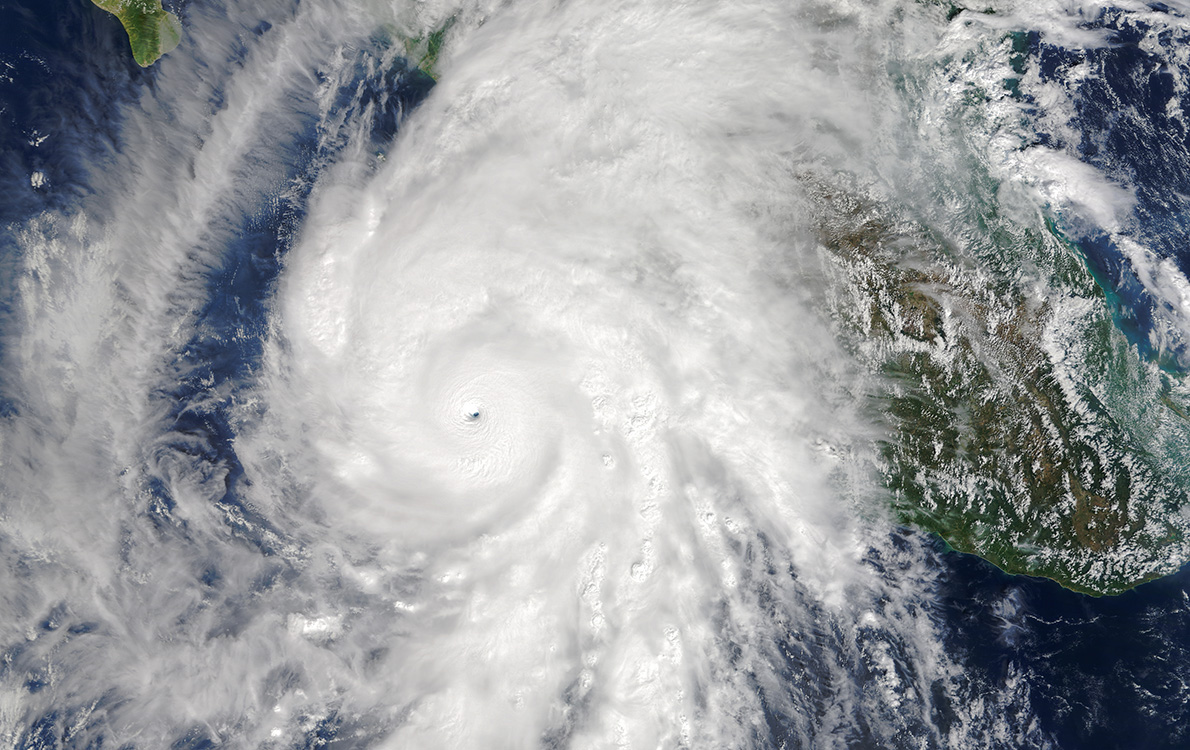
ALT Satellite image of Hurricane Patricia over the eastern Pacific Ocean
ALT Six maps of Chicago showing the effects of three different types of roofs (cool roofs, green roofs, and solar panel roofs) on temperature in buildings during the day and night. Cool roof had the biggest impact but all three lowered temperature.
The atmospheric boundary layer is familiar to you, even if you don't realize it. It's where most weather occurs. Zhien Wang @stonybrooku studies this area to increase our knowledge of cloud properties and processes. #ClimateScienceSundayarm.gov/news/features/post/9…
ALT Zhien Wang (an East Asian man in a t-shirt and shorts) poses in a Twin Otter aircraft.
“The more diverse our team, the stronger our science can be.” - Samson Hagos @PNNLab. He launched the PNNL-HBCU/MSI Climate Research Network, which establishes partnerships in climate science between the lab and universities. #ClimateScienceSundaypnnl.gov/publications/meanin…
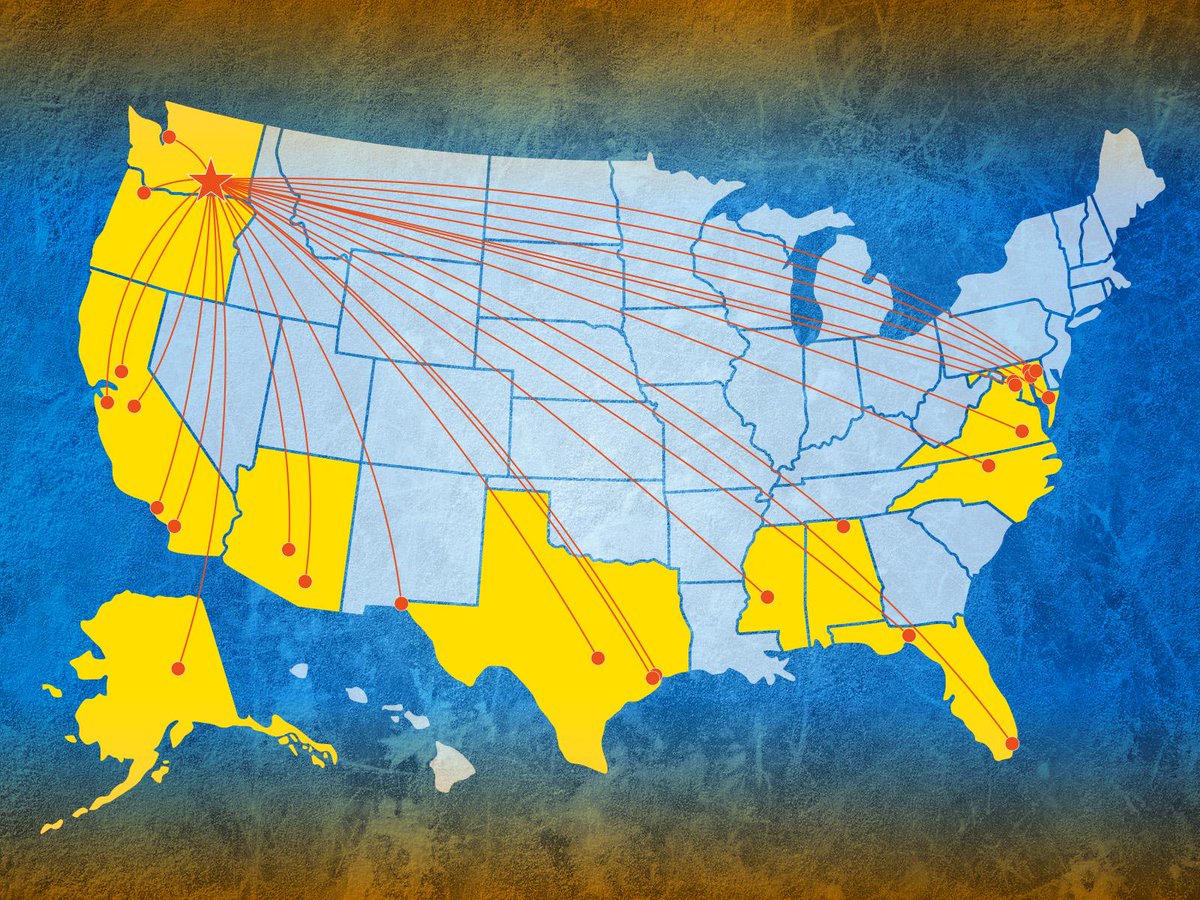
ALT A map of the United States with red lines connecting the location of Pacific Northwest National Laboratory with dots representing HBCUs and MSIs all over the country
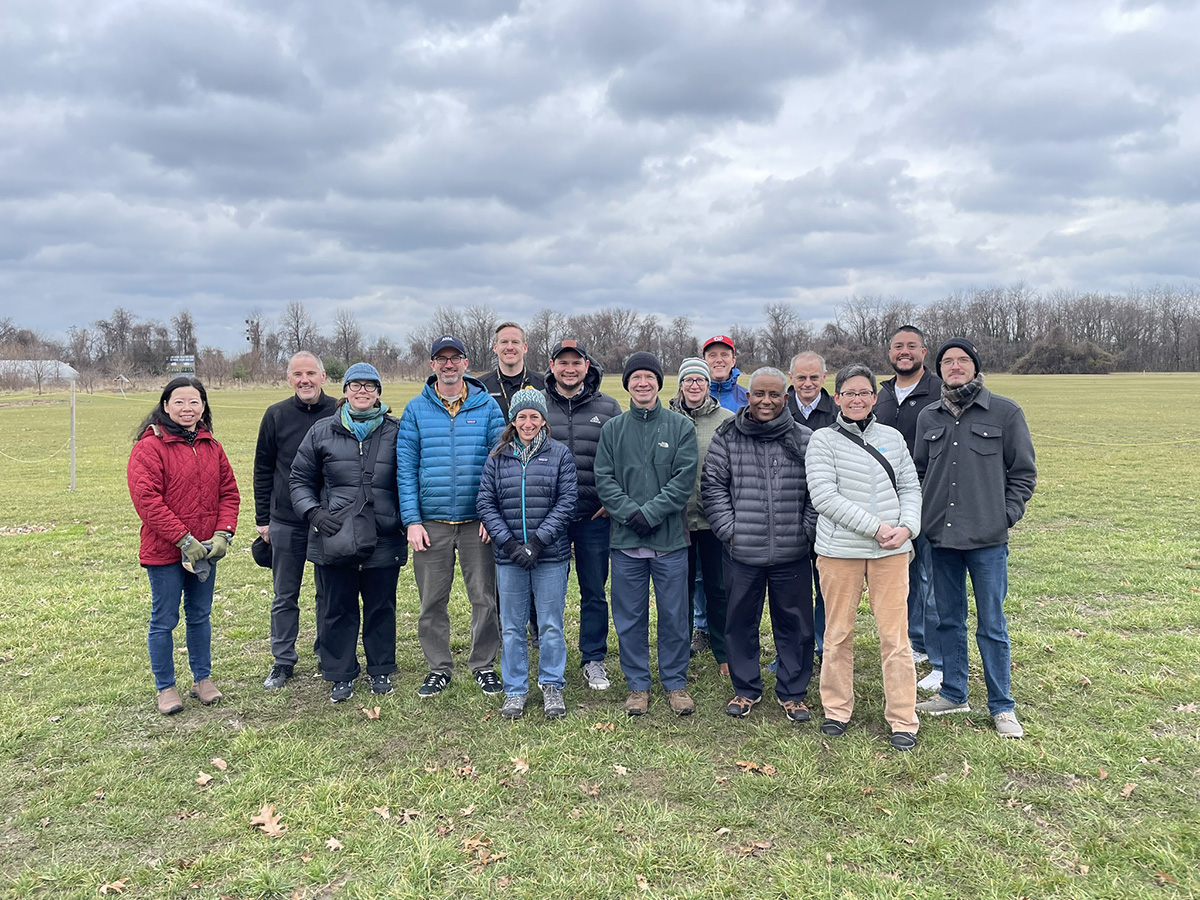
Excess ammonia can contribute to water pollution, poor soil quality, & climate change. Agriculture is the biggest source. But a team with scientists @ORNL found that we could cut ammonia emissions by 38% without limiting fertilizer. #ClimateScienceSundayornl.gov/news/reaping-agricu…
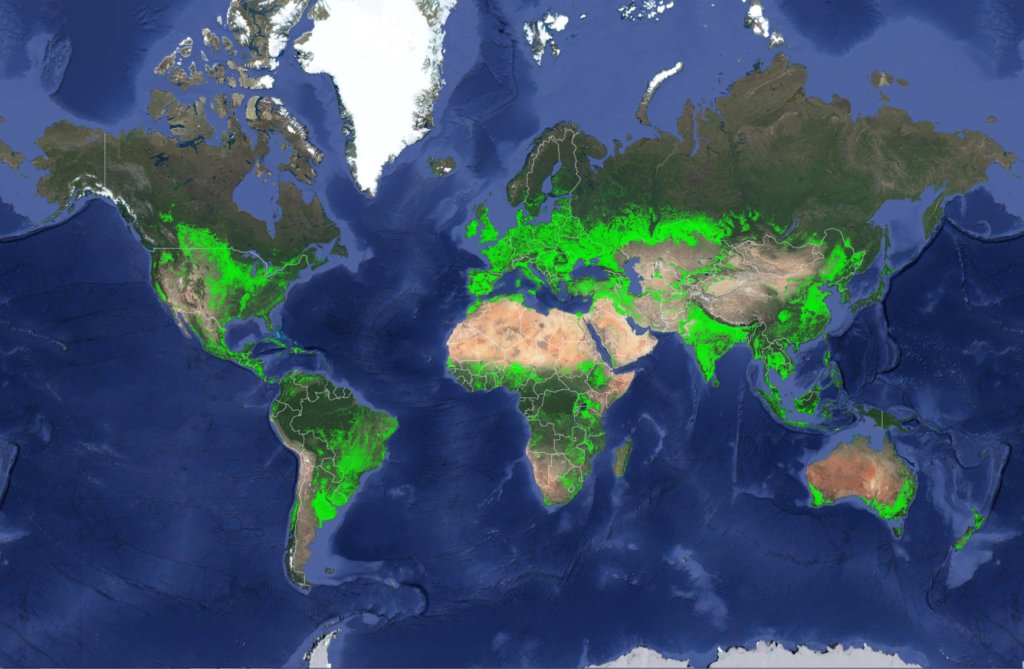
ALT Computer map of the world that highlights major croplands - midwest U.S., central America, eastern South America, southern Europe, mid and southern-Africa, India, and far eastern Asian
Increasing 9% since 2002 doesn't seem like a big jump, but when it's an increase in a powerful greenhouse gas, that's bad news. @BerkeleyLab scientists found that methane emissions from boreal Arctic wetlands are increasing. #ClimateScienceSundaynewscenter.lbl.gov/2024/02/1…
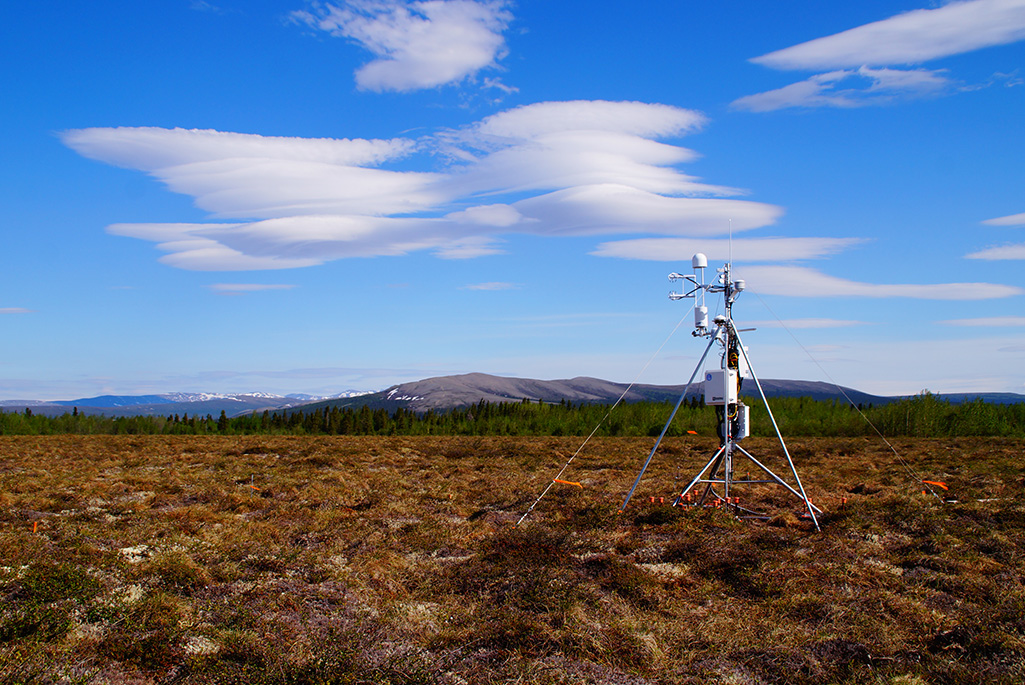
ALT A piece of equipment for measuring greenhouse gases, on a tripod in the Alaskan tundra, with mountains behind it
Climate change caused by increases in greenhouse gas emissions should increase rainfall. Strangely, it hasn't. @BerkeleyLab researchers found that aerosols caused by air pollution (like in smog) may have masked the effect. #ClimateScienceSundaynewscenter.lbl.gov/2024/02/2…
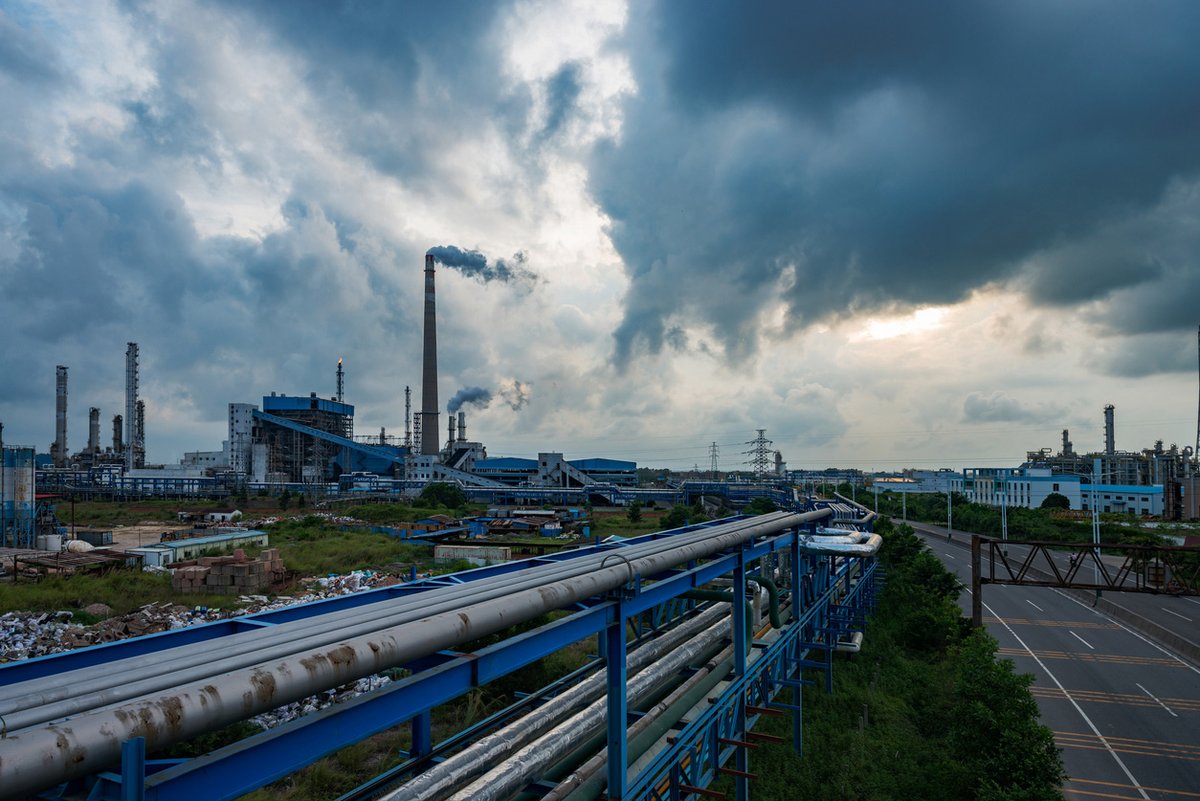
ALT A chemical plant producing pollution next to a highway with a pipeline running alongside it
Methane is 28 times more potent of a greenhouse gas than carbon dioxide. @ORNL scientists combined a new modeling framework and field data to improve predictions of methane from soils in coastal ecosystems. #ClimateScienceSundayornl.gov/news/coastal-chemis…
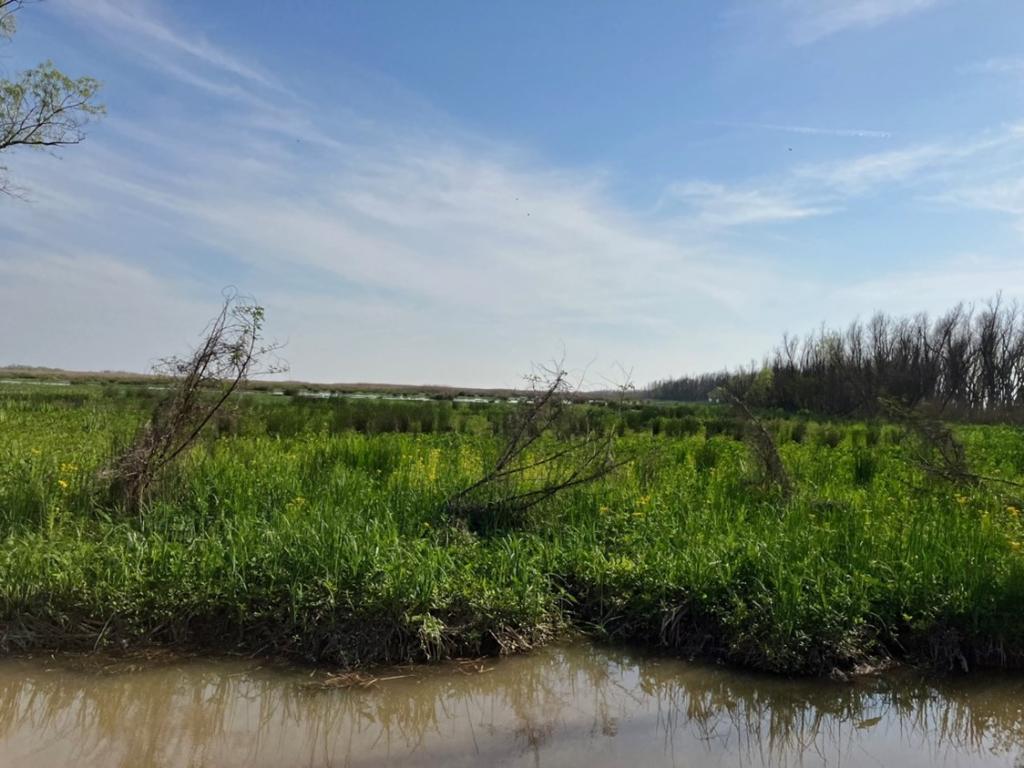
ALT A Mississippi delta march, with a gray stream with banks full of scrubby bushes and green low-lying grasses
Coastal wetlands play important roles in Earth systems. @ORNL scientists combined a new modeling framework & field data to more accurately estimate how much methane these ecosystems produce. #ClimateScienceSundayornl.gov/news/coastal-chemis…
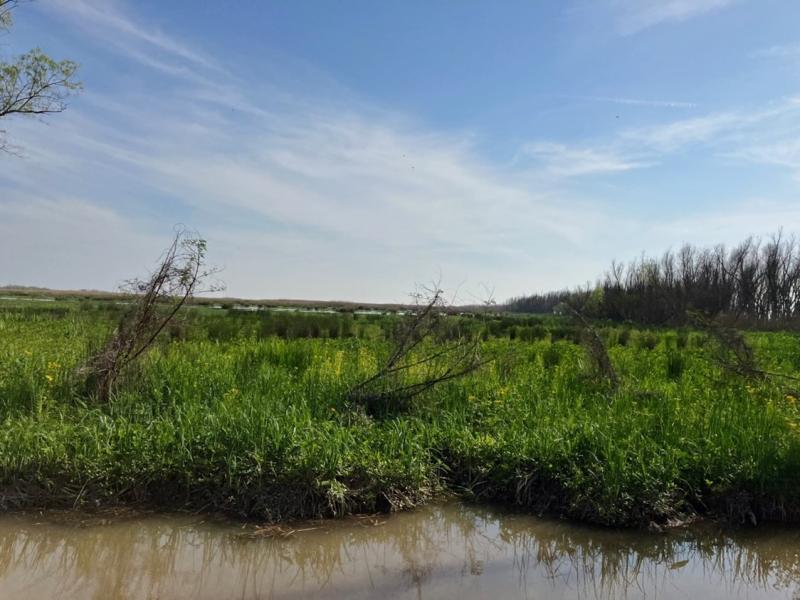
ALT A Mississippi Delta marsh, with green plants and brown water
The Amazon is both a vast rainforest and home to a city of 2 M people. That makes it a terrific place to study both unpolluted air and a plume of pollution, as scientists with @armnewsteam did for the GoAmazon2014/15 field campaign. #ClimateScienceSundayarm.gov/news/features/post/9…
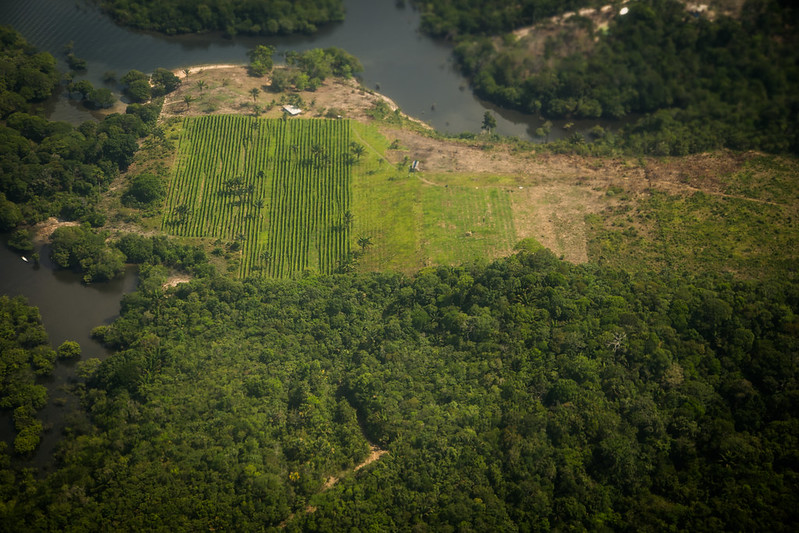
ALT Aerial view of agricultural fields and dense forest in the Amazon Basin
Happy birthday to the Energy Exascale Earth System Model (E3SM)! The vision for a simulation designed to run on exascale computers began in 2014. The team will soon release version 3, which is faster & more accurate than ever before. #ClimateScienceSundaye3sm.org/e3sm-a-decade-of-pr…
ALT Image of a globe with a heat map on the oceans. There is a large red blob, surrounded by yellow, in the middle of the Atlantic ocean. The text says "E3SM: Energy Exascale Earth System Model - Celebrating a Decade of Progress. Floating Points."
Science can't determine policy, but it can inform it. For the 1st time, @ORNL was an Observer Organization at the COP 28 climate change negotiations. Scientists from the lab provided expertise outside of the formal negotiations. #ClimateScienceSundayornl.gov/news/qa-researchers…
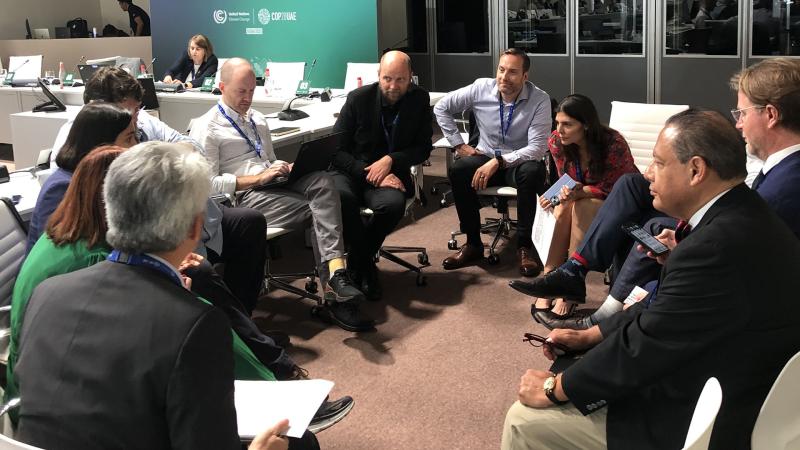
ALT A group of people of various genders and races in suits and other formal office attire in office chairs gathered in a circle, intently discussing a topic
As policymakers discuss how to deal with climate change, science can play an important role. Extreme event attribution research @BerkeleyLab & elsewhere can inform talks about financial compensation to the most affected countries. #ClimateScienceSundaycs.lbl.gov/news-media/news/2…
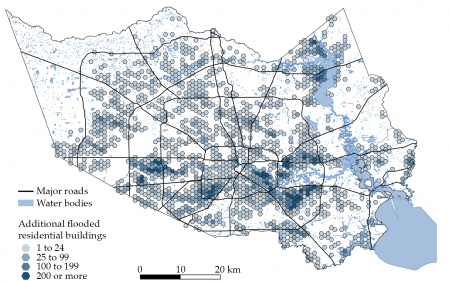
ALT A map of the City of Houston showing buildings that would not have been flooded by Hurricane Harvey due to the additional impact of climate change. There are particularly dense clumps in the southeast and western part of the city