
Jun 8
Con @Agilent CrossLab Connect, i laboratori possono monitorare in modo più efficace le performance quotidiane, individuare tempestivamente eventuali criticità e migliorare produttività, continuità operativa e conformità.
#Automation #DigitalLab #Agilent
labworld.it/migliorare-leffi…
7

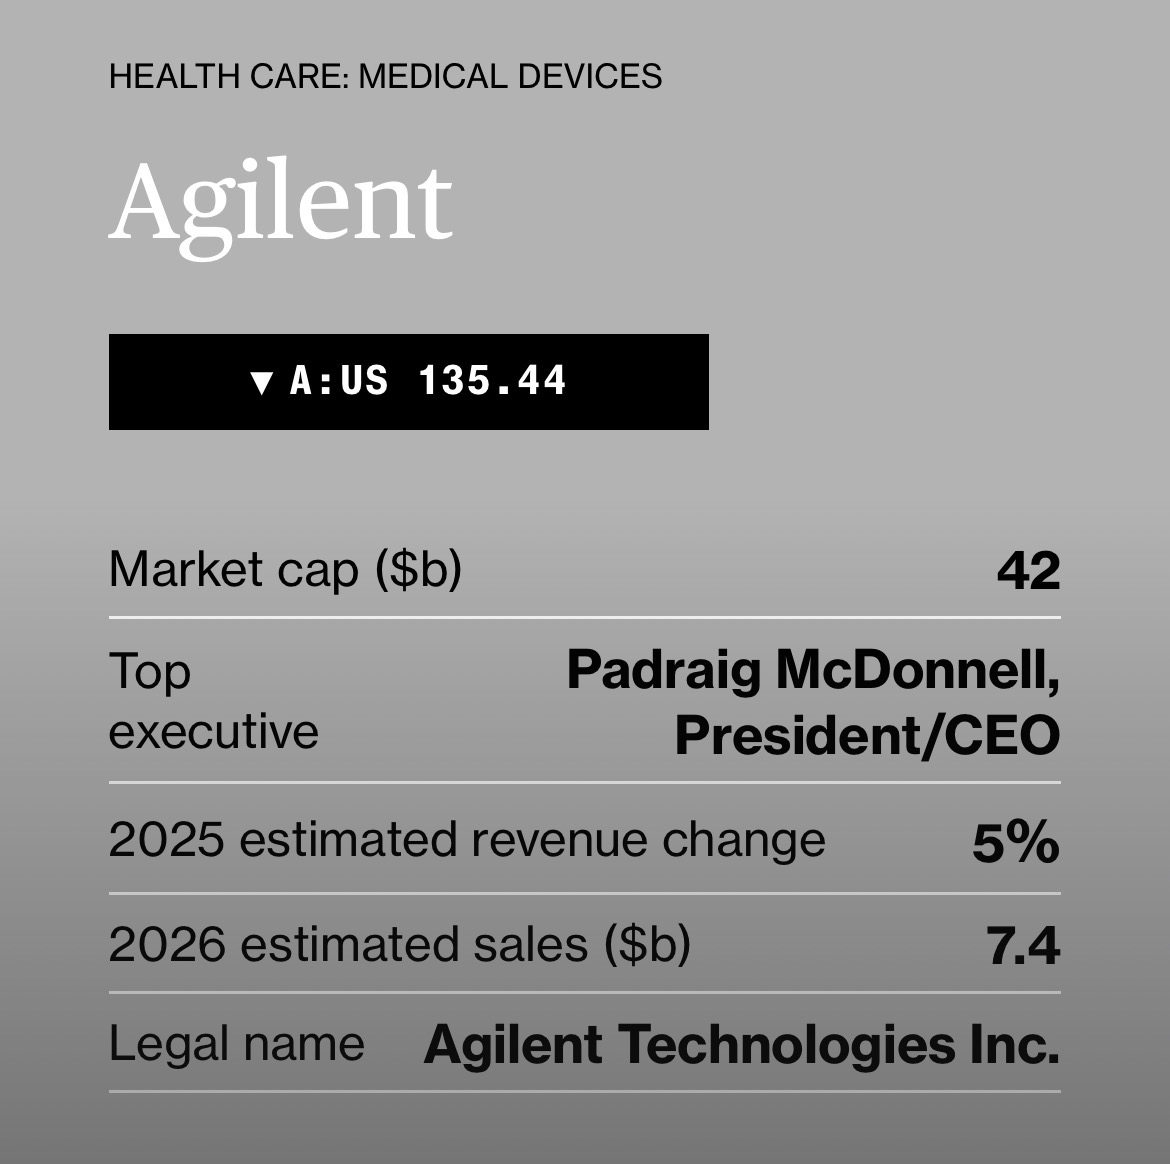
Bloomberg watch list: Agilent Technologies provides application focused solutions to the life sciences, diagnostics, and applied chemical markets worldwide. The company operates through three segments: Life Sciences and Diagnostics Markets, Agilent CrossLab, and Applied Markets.
121

【#PRESIDENT_STATION_TOKYO】は
#Spotify で過去の放送を聴くことができます📲
🔽最新回はコチラ🔽
open.spotify.com/episode/2eo…
🥰前回は
出会いから革新を生み出し
スタートアップを支える施設
#株式会社CROSSLAB
代表取締役社長・山野 礼真さん
@MayugeShacho97
#金子一也
#川越塔子
@TokoAmore
@pre_sta_radio
4
239

本日は、#COアライアンス の分科会、若手中心に展開したく、その名も「若手CrossLab.」と題して、神奈川県内某所にて実施中。
アライアンスの分科会に興味あります方は、DMにてご一報くださいね~☺️
1
31
295

24 Nov 2025
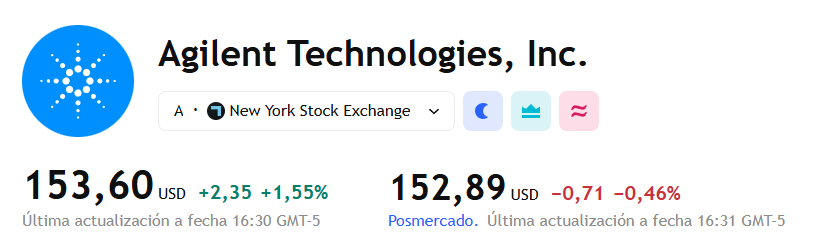
Agilent $A supera expectativas y confirma recuperación en demanda de laboratorio
Agilent Technologies presentó un trimestre sólido, apoyado en la fuerte demanda de herramientas de laboratorio, diagnóstico y servicios científicos:
🔹 Ingresos 4T: $1.860M (vs. $1.830M esperados)
🔹 EPS ajustado: $1,59 (vs. $1,58 estimado)
🔹 Segmento Life Sciences & Diagnostics: $755M (vs. $718M esperado)
🔹 CrossLab: 7% hasta $775M
La compañía también dio una guía optimista para 2026, proyectando $7.300–$7.400M en ingresos, ligeramente por encima del consenso.
📌 Contexto macro:
El sector de equipos médicos y servicios de laboratorio está viendo un repunte debido al acelerado desarrollo de fármacos en EE.UU. bajo la nueva política comercial de la administración Trump.
📈 Reacción del mercado:
Acciones de Agilent 1,55%, reflejando confianza renovada en la recuperación del ritmo de investigación biomédica.
Una lectura claramente positiva para el sector de ciencias de la vida, que llevaba meses mostrando señales de estabilización.
2
640

24 Nov 2025
$A Q4 2025 earnings: Growth Accelerates, Outlook Solid
Agilent Technologies delivered a strong finish to fiscal year 2025, beating revenue expectations and landing at the top end of its earnings guidance. The company highlighted its sixth consecutive quarter of accelerating core revenue growth, signaling that the instrument replacement cycle and market recovery are gaining traction. Management initiated FY26 guidance that projects continued steady growth.
🐂 𝗕𝘂𝗹𝗹 𝗖𝗮𝘀𝗲
• 𝗥𝗲𝘃𝗲𝗻𝘂𝗲 𝗕𝗲𝗮𝘁 𝗮𝗻𝗱 𝗔𝗰𝗰𝗲𝗹𝗲𝗿𝗮𝘁𝗶𝗼𝗻: Q4 revenue of $1.86 billion exceeded the guidance range ($1.82–$1.84B). Core growth accelerated to 7.2%, up from 6.1% in Q3, continuing a positive trend.
• 𝗟𝗶𝗳𝗲 𝗦𝗰𝗶𝗲𝗻𝗰𝗲𝘀 𝗦𝘁𝗿𝗲𝗻𝗴𝘁𝗵: The Life Sciences and Diagnostics (LDG) segment outperformed significantly with 11% core growth, suggesting strong demand in pharma and clinical end markets.
• 𝗙𝗬𝟮𝟲 𝗢𝘂𝘁𝗹𝗼𝗼𝗸: Initial FY26 guidance projects 4-6% core growth, indicating confidence that the current momentum is sustainable.
🐻 𝗕𝗲𝗮𝗿 𝗖𝗮𝘀𝗲
• 𝗠𝗮𝗿𝗴𝗶𝗻 𝗖𝗼𝗺𝗽𝗿𝗲𝘀𝘀𝗶𝗼𝗻: Operating margins in the Services (ACG) and Applied Markets (AMG) segments declined year-over-year (ACG down ~130 bps), weighing on overall profitability.
• 𝗡𝗼 𝗘𝗣𝗦 𝗕𝗹𝗼𝘄𝗼𝘂𝘁: While revenue beat handily, EPS ($1.59) only matched the high end of the prior guidance range ($1.60), implying that some of the top-line upside did not flow through to the bottom line.
• 𝗧𝗮𝗿𝗶𝗳𝗳 𝗥𝗶𝘀𝗸𝘀: While not explicitly quantified in this release, previous quarters highlighted tariff headwinds. The lack of significant margin expansion in the FY26 outlook suggests these costs may still be a factor.
⚖️ 𝗩𝗲𝗿𝗱𝗶𝗰𝘁
🟢 𝗕𝘂𝗹𝗹𝗶𝘀𝗵. The most important narrative for Agilent—market recovery—is firmly intact. Delivering a sixth consecutive quarter of accelerating core growth validates the "cyclical recovery" thesis. While margin pressure in Services is a watch item, the top-line momentum and strong performance in the core Life Sciences segment outweigh these concerns.
— • — • —
𝗧𝗵𝗲𝗺𝗲𝘀, 𝗗𝗿𝗶𝘃𝗲𝗿𝘀, 𝗮𝗻𝗱 𝗖𝗼𝗻𝗰𝗲𝗿𝗻𝘀
🟢 𝗔𝗰𝗰𝗲𝗹𝗲𝗿𝗮𝘁𝗶𝗻𝗴 𝗠𝗼𝗺𝗲𝗻𝘁𝘂𝗺
The primary story is the continued acceleration of the business. Core revenue growth has climbed steadily: 1.2% (Q1) → 5.3% (Q2) → 6.1% (Q3) → 7.2% (Q4). This confirms that the instrument replacement cycle discussed in previous quarters is materializing and gaining speed.
🟢 𝗟𝗶𝗳𝗲 𝗦𝗰𝗶𝗲𝗻𝗰𝗲𝘀 & 𝗗𝗶𝗮𝗴𝗻𝗼𝘀𝘁𝗶𝗰𝘀 (𝗟𝗗𝗚) 𝗢𝘂𝘁𝗽𝗲𝗿𝗳𝗼𝗿𝗺𝗮𝗻𝗰𝗲
The LDG segment was the standout driver, posting 15% reported and 11% core growth. This is a significant step up from the "broad-based strength" seen in Q3 and suggests that pharma spending and clinical demand have rebounded sharply. Operating margin in this segment also improved to 22.7% (vs. 21.5% last year).
🟡 𝗦𝗲𝗿𝘃𝗶𝗰𝗲𝘀 (𝗔𝗖𝗚) 𝗠𝗮𝗿𝗴𝗶𝗻 𝗣𝗿𝗲𝘀𝘀𝘂𝗿𝗲
While the CrossLab Group (Services) continued to grow ( 6% core), its profitability took a hit. Operating margin dropped to 32.5% from 33.8% a year ago. Given that this is typically Agilent's highest-margin and most recurring segment, investors will want to understand if this is due to mix, tariff costs, or investments.
⚪ 𝗜𝗴𝗻𝗶𝘁𝗲 𝗢𝗽𝗲𝗿𝗮𝘁𝗶𝗻𝗴 𝗦𝘆𝘀𝘁𝗲𝗺
Management continues to cite the "Ignite" strategy as a key enabler of efficiency and commercial execution. In Q3, this was credited with generating savings to offset tariffs. In Q4, the CEO noted it is "unlocking operating efficiencies," though the segment margin results paint a mixed picture of its immediate impact.
— • — • —
𝗠𝗮𝗶𝗻 𝗙𝗶𝗻𝗮𝗻𝗰𝗶𝗮𝗹𝘀
• 𝗥𝗲𝘃𝗲𝗻𝘂𝗲: $1.86 billion vs. guidance of $1.82–$1.84 billion.
• 𝗚𝗿𝗼𝘄𝘁𝗵: 9.4% reported, 7.2% core. (Q3 core was 6.1%). 🟢
• 𝗡𝗼𝗻-𝗚𝗔𝗔𝗣 𝗘𝗣𝗦: $1.59 vs. guidance of $1.57–$1.60. ( 9% YoY). 🟡
• 𝗟𝗶𝗳𝗲 𝗦𝗰𝗶𝗲𝗻𝗰𝗲𝘀 (𝗟𝗗𝗚): $755M revenue, 11% core growth. 🟢
• 𝗖𝗿𝗼𝘀𝘀𝗟𝗮𝗯 (𝗔𝗖𝗚): $755M revenue, 6% core growth. 🟡
• 𝗔𝗽𝗽𝗹𝗶𝗲𝗱 𝗠𝗮𝗿𝗸𝗲𝘁𝘀 (𝗔𝗠𝗚): $351M revenue, 3% core growth. 🟡
• 𝗢𝗽𝗲𝗿𝗮𝘁𝗶𝗻𝗴 𝗖𝗮𝘀𝗵 𝗙𝗹𝗼𝘄 (𝗙𝗬𝟮𝟱): $1.56 billion (vs $1.75 billion in FY24). 🔴
— • — • —
𝗚𝘂𝗶𝗱𝗮𝗻𝗰𝗲
Management provided its initial outlook for Fiscal Year 2026.
Q1 FY26 Outlook
• 𝗥𝗲𝘃𝗲𝗻𝘂𝗲: $1.79B – $1.82B
• 𝗖𝗼𝗿𝗲 𝗚𝗿𝗼𝘄𝘁𝗵: 4% to 6%
• 𝗜𝗺𝗽𝗹𝗶𝗰𝗮𝘁𝗶𝗼𝗻: This represents a sequential deceleration from Q4's 7.2% pace. This may be due to seasonality or conservatism, but it breaks the trend of quarter-over-quarter acceleration established throughout FY25.
Full Year FY26 Outlook
• 𝗥𝗲𝘃𝗲𝗻𝘂𝗲: $7.3B – $7.4B
• 𝗖𝗼𝗿𝗲 𝗚𝗿𝗼𝘄𝘁𝗵: 4% to 6%
• 𝗡𝗼𝗻-𝗚𝗔𝗔𝗣 𝗘𝗣𝗦: $5.86 – $6.00
• 𝗜𝗺𝗽𝗹𝗶𝗰𝗮𝘁𝗶𝗼𝗻: The EPS growth at the midpoint (~6%) roughly matches the revenue growth rate. This suggests management is not currently guiding for significant operating leverage or margin expansion in FY26, which differs from their long-term target of 100 bps annual margin expansion.
— • — • —
𝗠𝗮𝗶𝗻 𝗤𝘂𝗲𝘀𝘁𝗶𝗼𝗻𝘀 𝗳𝗼𝗿 𝘁𝗵𝗲 𝗘𝗮𝗿𝗻𝗶𝗻𝗴𝘀 𝗖𝗮𝗹𝗹
1. ACG Margin Compression: Why did operating margins in the CrossLab (Services) segment contract by ~130 basis points year-over-year despite 6% core growth? Is this related to tariff costs or mix shift?
2. Sequential Deceleration: Q4 core growth hit 7.2%, but the Q1 guidance implies a step down to 4-6%. Is this purely conservatism, or are you seeing signs of demand plateauing after the year-end flush?
3. Tariff Mitigation Update: In Q3, you expressed confidence in fully mitigating tariff impacts by FY26. Does the FY26 guidance (showing limited margin expansion leverage) reflect higher-than-expected costs to achieve this mitigation?
4. Applied Markets Lag: The AMG segment grew only 3% core, lagging behind the portfolio. What is the outlook for chemical and semiconductor end markets in FY26?
1
2
659

xp boosts replication via crosslab incentives?
2
20

9 Oct 2025
#COアライアンス の分科会、若手CrossLab.を開催いたしました。
全国の5研究所から研究者が集まり、ブレインストーミングの二日間、充実の時間となりました😊
分科会に参加したい、大学との共同研究に興味がある!という方、✉DMにてご連絡いただければ幸いです。
#産学連携
alliance.tagen.tohoku.ac.jp/…
18
313


25 Nov 2024
Agilent Technologies, $A, Q4 FY2024 Results:
🔴 -1% Post-Market ($133.10)
📊 Adj EPS: $1.46 🟢
💰 Revenue: $1.70B 🟢
📈 Net Income: $351M
🔍 Strength in CrossLab segment with 5% revenue growth YoY

1
1
8
377

13 Sep 2024
⭐️ Premio @ieee_antennas 2024 ad una ricerca condotta nei nostri laboratori #crosslab!
Superfici intelligenti per comunicazioni wireless all'interno di una ambiente industriale.
Complimenti a Suvadeep Choudhury! shorturl.at/8zp2Y @unipisa #industria50 #forelab

2
40

💥Resultados Agilent Technologies $A Q3 2024
Ingresos 1,58B vs 1,56B (esperados)
BPA ajustado 1,32$ vs $ (esperados)
BPA GAAP 0,97$ vs 0,38$(2023)
Caen ventas en Life Sciences y Diagnostics (-8%) y suben en Crosslab ( 5%)
Guidance 2024
Ventas 6,45-6,5B
BPA 5,21-5,25$
Sube 2%📈

1
6
73
2,983


2 Jul 2024
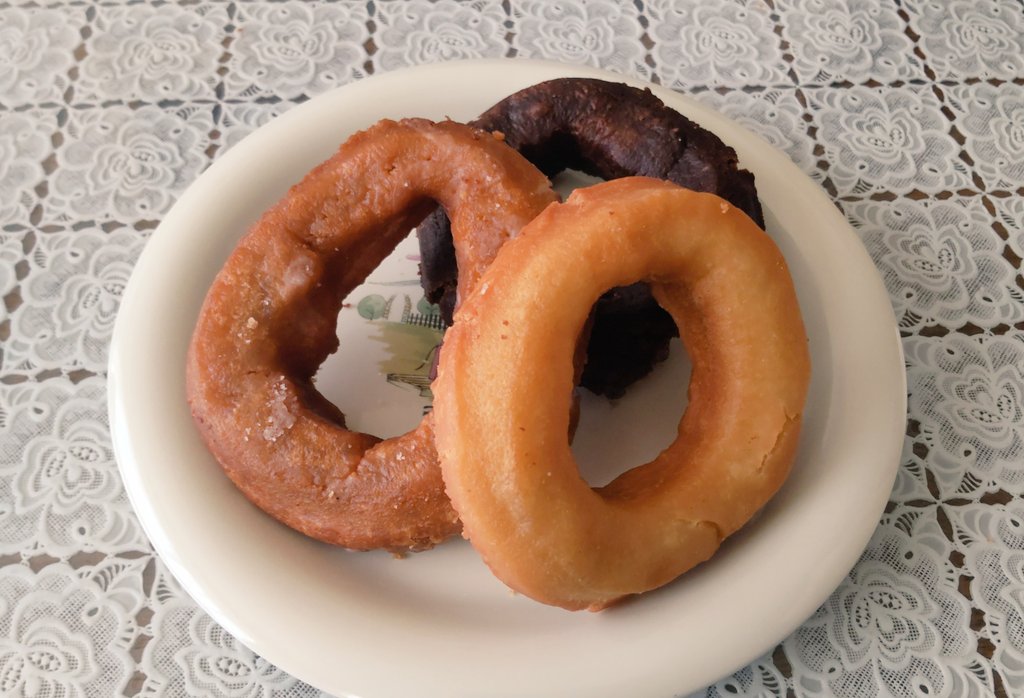
#新十津川町 のドーナッツ屋さん
#CrossLab へ行って来ました✨
ご主人は、パティシエ。
奥様は町議会議員で子育てとお店と両立を頑張っております🙇❣️
ドーナッツは、とっても優しい味で美味しいです❣️
一人1個のつもりで買ったのですが、私一人占めしたいです……🤣
instagram.com/cross_lab.donu…


30
264

27 Jun 2024
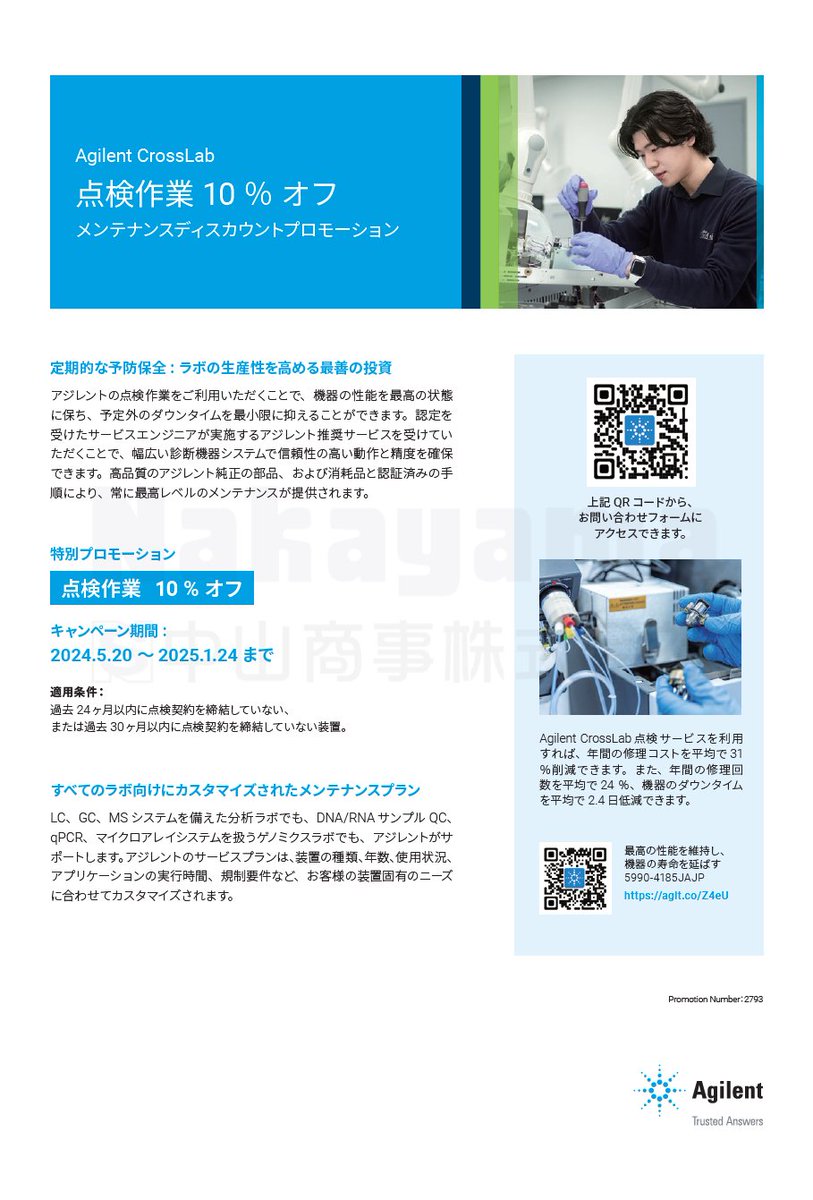
アジレント・テクノロジーさま Agilent CrossLab メンテナンスディスカウントプロモーション
機器の性能を最高の状態に保ち、予定外のダウンタイムを最小限に。只今、点検作業が10%OFFの特別プロモーション実施中。是非ご検討下さい。
products.nakayama-co.jp/camp…
1
2
120