
Agreed. Are DIIs giving a cheap exit to FIIs? What is your opinion?
1
News_updates retweeted

💰Triple Power Buying Spree ‼️
Smart Money Promoters DIIs FIIs Going All-In 🚀 Up to 1.97 %🔥 Promoters | 2.29% 🔥FIIs | 0.33% 🔥DIIs)
Part ~ 2 [ 20/20 ] 📌
A MEGA 🧵 Thread 🧵 👇 👇 👇

1
1
2
16
wazir siwach retweeted

99% revenue made up, went on for 5 years, almost FIIs and DIIs pulled out their investments barring one - LIC. The story of Rajesh Exports as per the SEBI interim report, the larger question - who does the retail investor trust? I explain.

Rajesh Exports: Scam, System Failure or Trust Crisis? | Straight Talk with PC
youtu.be/ZtEas6GG61Q
10
23
93
3,054

In 2021, this was one of the most hyped IPOs in India.
In 2023, investors called it a wealth destroyer.
The stock crashed from ₹1,600 to nearly ₹300.🔻
Then came the surprise.
From the lows, it rallied almost 10x and crossed ₹3,000.🔥
Today, it's still trading ~36% below its all-time high.
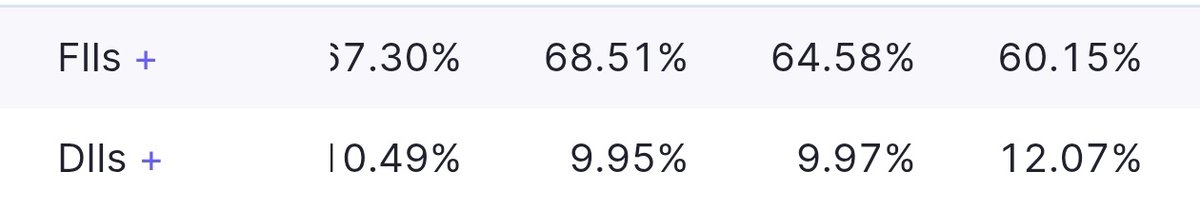
Recently, DIIs have been increasing their stake, while FIIs have been reducing theirs.
Can you guess the stock? 👇
#fII #wealth #investing #DII
1
27

26/ What makes Cera interesting:
Sanitaryware is not just a product business anymore.
Brand distribution dealer network matter massively.
That creates pricing power over time.
#Nifty50 #stockmarketIndia #FIIs #DIIs #cerasanitary
1
42
12/ Ion Exchange operates across:
• Industrial water treatment
• Recycling systems
• Wastewater management
• Zero liquid discharge systems
As manufacturing expands…
water treatment becomes critical infra.
#watertreament #FIIs #stockmarketIndia #IONEXCHANGE #DIIs
1
4
10/ Why businesses like GNA matter:
Auto OEMs rarely switch critical suppliers easily.
Once relationships scale globally…
revenue visibility improves dramatically.
That’s how industrial compounders are built.
#Investing #gnaaxles #GNA #NSE #nifty50 #stockstowatch #FIIs #DIIs
1
22

If it will not crash what should I do to you in Lulu mall?
DIIs will simply sit n see tamasha if crashes???.
Brain dead traders!!

🚨 WARNING: India is heading toward the BIGGEST Stock Market Crash in its history
Possible Targets of Nifty 20,000 & 12,000
I am 200% sure and bearish since last 6 months
All upmove is just pullbacks be cautious
save this tweet!
#Nifty50
2

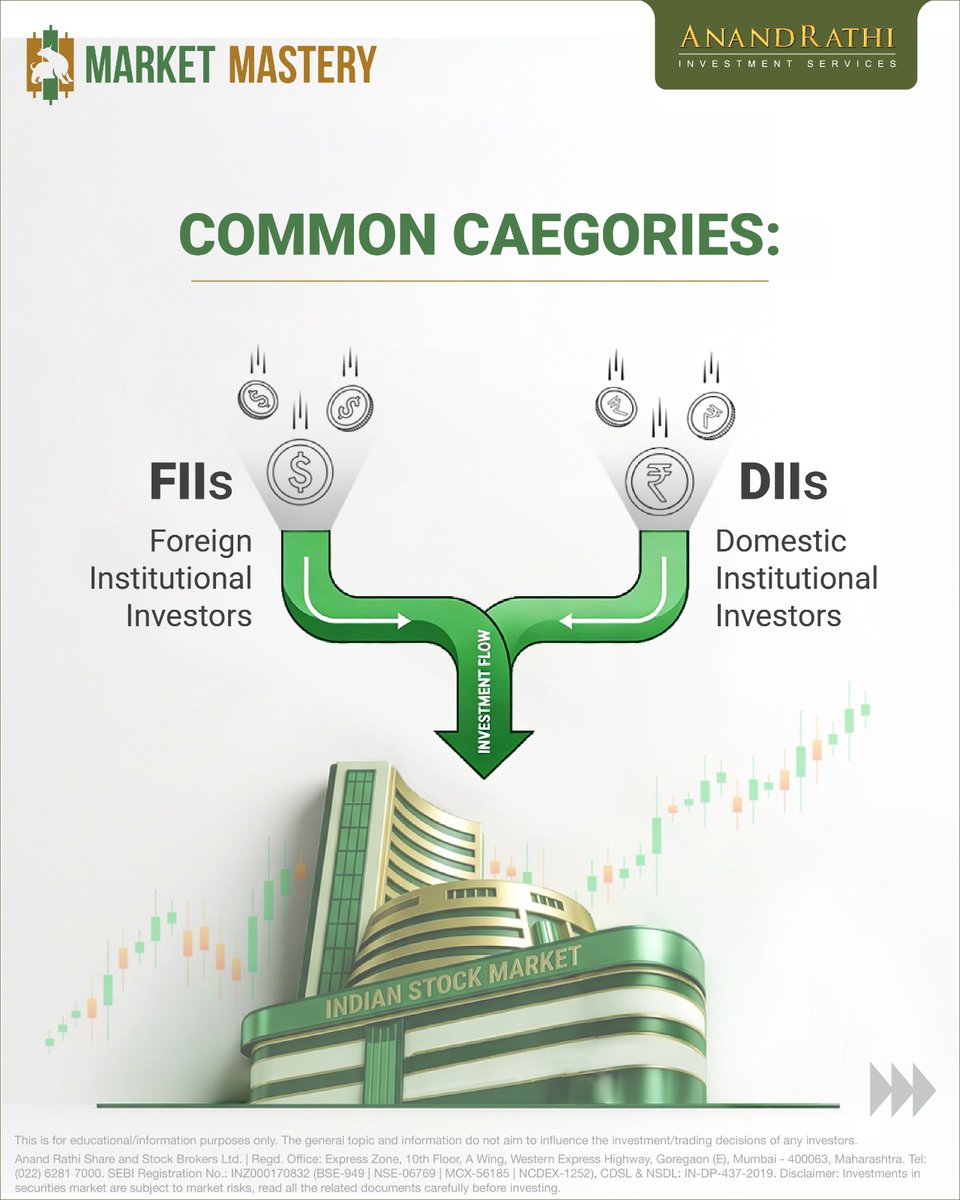
FIIs. DIIs. Institutional participation. 📊
These terms appear in market news almost every day - but what do they actually mean?
#FII #DII #StockMarket #InvestorEducation #FinancialLiteracy


1
82

📚 TRADING LESSON : AEROFLEX INDUSTRIES BREAKOUT ✈️⚙️🚀📊 CHART PATTERN RECOGNITION
✅ IPO Base Breakout
✅ High Tight Flag Formation
✅ Stage-2 Uptrend Expansion
✅ Volatility Contraction Pattern (VCP)
✅ Price Discovery Breakout
✅ Institutional Accumulation StructureThe weekly chart shows Aeroflex Industries completing a textbook High Tight Flag after a powerful advance from its IPO base.Following a prolonged consolidation between ₹160–₹260, the stock absorbed supply through multiple volatility contractions before launching into a strong breakout.The recent move above previous highs suggests institutions are aggressively accumulating, pushing the stock into a fresh price discovery phase.📈 PATTERN IDENTIFIED
• High Tight Flag Formation
• Stage-2 Uptrend Expansion
• Volatility Contraction Pattern (VCP)
• IPO Base Breakout
• Price Discovery Phase
• Institutional Accumulation Setup🎯 TRADE SETUP
• Entry Zone: ₹430 – ₹455
• Target 1: ₹520
• Target 2: ₹620
• Stretch Target: ₹750🛑 Stop Loss: Weekly Close Below ₹380🏆 ALL-TIME HIGH (ATH)
• All-Time High Price: ₹449.40
• Achieved: June 2026
• Status: Fresh ATH Breakout / Price Discovery🏢 SHAREHOLDING SNAPSHOT
• Promoters: 66.98%
• FIIs/FPIs: 7.84%
• DIIs & Mutual Funds: 8.91%
• Public & Others: 16.27%👥 MAIN STOCK HOLDERS
• Sat Industries Ltd. (Promoter Group) — 66.98%
• Yogesh Chhabria (Promoter Group)
• Aeroflex Promoter Entities
• Quant Mutual Fund
• Foreign Portfolio Investors (FPIs) — 7.84%
• Domestic Institutional Investors🏛️ INSTITUTIONAL PRESENCE
• Foreign Institutional Investors (FIIs)
• Domestic Mutual Funds
• High Net Worth Investors (HNIs)
• Professional Market Participants
• Manufacturing & Export-Focused Investors⭐ WHY THE CHART LOOKS INTERESTING
• Fresh lifetime high breakout
• High Tight Flag structure visible
• Strong momentum expansion
• Tight supply zone before breakout
• Increasing institutional participation
• Entering price discovery territory⚠️ For educational purposes only. Follow proper risk management and position sizing.#StockBreakout #PriceAction #AeroflexIndustries #HighTightFlag #PriceDiscoveryBreakout

58
📚 TRADING LESSON : CAPRI GLOBAL CAPITAL BREAKOUT 💰🚀
📊 CHART PATTERN RECOGNITION
✅ Multi-Year Cup & Handle Formation
✅ Stage-2 Uptrend Continuation
✅ Volatility Contraction Pattern (VCP)
✅ Ascending Base Formation
✅ Resistance Breakout Attempt
✅ Institutional Accumulation Structure
The weekly chart shows Capri Global Capital completing a multi-year Cup & Handle structure after a strong advance from 2020 through 2024.
The correction during 2024–2026 appears constructive rather than destructive, with price forming a series of higher lows and tightening volatility.
The recent move back above ₹200 suggests accumulation may be nearing completion and the stock is preparing for a potential expansion phase.
📈 PATTERN IDENTIFIED
• Multi-Year Cup & Handle Formation
• Stage-2 Uptrend Structure
• Volatility Contraction Pattern (VCP)
• Ascending Base Formation
• Higher Highs & Higher Lows
• Institutional Accumulation Setup
🎯 TRADE SETUP
• Entry Zone: ₹200 – ₹212
• Target 1: ₹240
• Target 2: ₹280
• Stretch Target: ₹350
🛑 Stop Loss: Weekly Close Below ₹180
🏆 ALL-TIME HIGH (ATH)
• All-Time High Price: ~₹290
• Achieved: 2024
• Status: ~28% Below ATH — Recovery Phase
🏢 SHAREHOLDING SNAPSHOT
• Promoters: 73.40%
• FIIs/FPIs: 7.20%
• DIIs & Mutual Funds: 8.10%
• Public & Others: 11.30%
👥 MAIN STOCK HOLDERS
• Capri Global Holdings Pvt. Ltd. — Promoter Group
• Rajesh Sharma (Promoter)
• Promoter Group Entities
• Foreign Portfolio Investors (FPIs)
• Mutual Funds & Institutional Investors
🏛️ INSTITUTIONAL PRESENCE
• Foreign Institutional Investors (FIIs)
• Domestic Mutual Funds
• Insurance Companies
• High Net Worth Investors (HNIs)
• Professional Market Participants
⭐ WHY THE CHART LOOKS INTERESTING
• Strong long-term uptrend remains intact
• High promoter ownership
• VCP-style tightening after correction
• Recovery from multi-quarter consolidation
• Financial sector relative strength improving
• Potential re-test of lifetime highs if breakout sustains
⚠️ For educational purposes only. Follow proper risk management and position sizing.
#StockBreakout #PriceAction #CapriGlobalCapital #FinancialStocks #CupAndHandleBreakout

31

on n'est d'accord pour REMERCIER DE LEUR #INKULTES 🇺🇸on va RESERVER #HAMBOURGER ET UNE 🏺DE #PIQUE à 3 balles ET LES AUTRES INVITES QUE DE #CHEVAL BLANC je dis kome cà mais je n'ai rien diis
8
📚 TRADING LESSON : GOLDIAM INTERNATIONAL BREAKOUT 💎🚀
📊 CHART PATTERN RECOGNITION
✅ Multi-Year Cup & Handle Breakout
✅ Stage-2 Uptrend Structure
✅ Volatility Contraction Pattern (VCP)
✅ All-Time High Re-Test
✅ Institutional Accumulation Structure
✅ Price Discovery Setup
The weekly chart shows Goldiam International completing a large multi-year Cup & Handle formation after a prolonged consolidation between 2024 and 2026.
The recent advance has pushed the stock back toward its lifetime high zone, while multiple volatility contractions indicate that supply has gradually been absorbed.
This type of structure is frequently observed before major expansion moves in leading mid-cap growth stocks.
📈 PATTERN IDENTIFIED
• Multi-Year Cup & Handle Formation
• Stage-2 Uptrend Continuation
• Volatility Contraction Pattern (VCP)
• Higher Highs & Higher Lows
• All-Time High Re-Test
• Institutional Accumulation Setup
🎯 TRADE SETUP
• Entry Zone: ₹460 – ₹485
• Target 1: ₹550
• Target 2: ₹650
• Stretch Target: ₹800
🛑 Stop Loss: Weekly Close Below ₹400
🏆 ALL-TIME HIGH (ATH)
• All-Time High Price: ~₹560
• Achieved: 2025
• Status: Retesting ATH Zone
🏢 SHAREHOLDING SNAPSHOT
• Promoters: 62.48%
• FIIs/FPIs: 6.84%
• DIIs & Mutual Funds: 2.31%
• Public & Others: 28.37%
👥 MAIN STOCK HOLDERS
• Promoter Group Entities — 62.48%
• Dilip Shah
• Pankaj Shah
• Goldiam Jewellery Ltd. Promoter Group
• Foreign Portfolio Investors (FPIs) — 6.84%
• Institutional Investors
🏛️ INSTITUTIONAL PRESENCE
• Foreign Institutional Investors (FIIs)
• Domestic Institutional Investors (DIIs)
• High Net Worth Investors (HNIs)
• Professional Market Participants
• Export-Oriented Manufacturing Investors
⚠️ For educational purposes only. Follow proper risk management and position sizing.
#StockBreakout #PriceAction #GoldiamInternational #JewelleryStocks #CupAndHandleBreakout

42
📚 TRADING LESSON : BAJAJ CONSUMER CARE BREAKOUT 🧴🚀
@wealth_verse
📊 CHART PATTERN RECOGNITION
✅ 11-Year Cup & Handle Breakout
✅ Multi-Year Stage-1 Accumulation Base
✅ All-Time High Breakout
✅ Price Discovery Phase
✅ Momentum Expansion Structure
✅ Institutional Accumulation Trend
The weekly chart displays one of the strongest long-term bullish formations in technical analysis.
After spending more than a decade building a broad accumulation structure, the stock has completed a massive Cup & Handle pattern and broken into fresh all-time highs.
The breakout is supported by strong momentum expansion and price discovery, indicating that long-term supply has largely been absorbed.
📈 PATTERN IDENTIFIED
• Cup & Handle Breakout (11-Year Formation)
• Stage-1 Base Completion
• Multi-Year Resistance Breakout
• All-Time High Expansion
• Price Discovery Phase
• Long-Term Institutional Accumulation
🎯 Trade Setup:
• Entry Zone: ₹570 – ₹600
• Target 1: ₹650
• Target 2: ₹750
• Stretch Target: ₹900
🛑 Stop Loss: Weekly Close Below ₹520
🏆 ALL-TIME HIGH (ATH)
• ATH Price: ₹595.80
• Achieved: June 2026
• Status: Fresh ATH Breakout
🏢 SHAREHOLDING SNAPSHOT
• Promoters: 51.63%
• FIIs/FPIs: 14.75%
• DIIs & Mutual Funds: 11.23%
• Public & Others: 22.39%
👥 MAIN STOCK HOLDERS
• Bajaj Holdings & Investment Ltd. — 51.63%
• SBI Mutual Fund — 2.82%
• ICICI Prudential Mutual Fund — 1.74%
• HDFC Mutual Fund — 1.38%
• Kotak Mutual Fund — 1.03%
• Foreign Portfolio Investors — 14.75%
🏛️ INSTITUTIONAL PRESENCE
• Foreign Institutional Investors (FIIs)
• Domestic Mutual Funds
• Insurance Companies
• High Net Worth Investors (HNIs)
• Professional Market Participants
⚠️ For educational purposes only. Follow proper risk management and position sizing.
#StockBreakout #PriceAction #BajajConsumerCare

45

Genus Power has built deep expertise in metering technology. The company now operates across the entire smart metering value chain.
It manufactures smart meters. It installs them. It provides communication networks. It provides Head End Systems (HES). It provides Meter Data Management Systems (MDMS). It manages software platforms. It maintains projects for years after installation. Unlike many competitors, Genus owns the entire technology stack. This integration provides a major competitive advantage.
The future is services, software and energy data.
India has roughly 31-32 crore electricity consumers. Around 15 crore meters have already been tendered. Only around 7 crore have been installed. Smart metering cycle is still in its early stages.
The company claims over 30% market share in smart metering. AMISP market share is around 22-23%.
Its meters measure over 20% of India's electricity consumption.
The company reaches roughly 1 out of every 5 households in India.
More than 105 million meters have already been installed globally.
Annual manufacturing capacity exceeds 18 million meters.
The company has invested heavily in technology. Over 250 professionals work in device R&D. Over 225 professionals work in software development. Management views smart meters as a technology business rather than a hardware business.
FY27 installation guidance is more than 1 crore meters.
Management says investors should not view this like a normal EPC order book. The projects run for 8-10 years. A large part of future revenue comes after installation. The business is gradually shifting toward an annuity model. Once meters are installed, the company earns operation and maintenance revenue.
Singapore sovereign wealth fund GIC partnered with Genus. A dedicated smart metering platform was created. Ownership is structured as 74% GIC and 26% Genus. The platform funds smart metering projects.
Beyond electricity meters management sees additional opportunities. Gas meters represent a major future market. Water metering is another emerging opportunity.
Management is intentionally repositioning the business.
First phase was meter manufacturing. Second phase is AMISP execution and large scale deployments. Third phase is recurring O&M revenue. Fourth phase is software platforms and energy data services.
Leveraging energy data. Expanding into software. Entering gas metering. Entering water metering. And ultimately evolving from a manufacturing company into a smart energy infrastructure and technology platform.
My main concerns with Genus Power are its rising debt levels and the very low institutional participation from domestic mutual funds and other DIIs.
Another factor I keep comparing is Adani Energy Solutions. AESL has a similar smart metering presence and installation scale but operates with a significantly stronger balance sheet, much larger capital base, diversified cash flows and easier access to funding.
Genus is a more focused smart metering play with potentially higher growth, but AESL appears financially stronger and better positioned to absorb execution risks.

1
116

Nifty PE at 20.02 😐
10 year average is 23.43.
We are 14.6% BELOW that average right now.
✅️ PE: attractive
✅️ P/B: 3.07 — below avg
✅️ PAT growth intact across large caps
❌ FII selling ₹1,20,000 Cr in 2026
FIIs selling. DIIs absorbing. Crowd scared.
Complete dislocation. Tuut pado 💚
Not SEBI registered. DYOR.
#Nifty #ValueInvesting
43