
JewelsRefined2 retweeted

I would think the inflow of western capital to rebuild infrastructure would come with cultural strings along with renewed travel and relationships. Trump has always bragged about how much foreign investment he brings. He’s too slow to understand how cultural change can win wars.

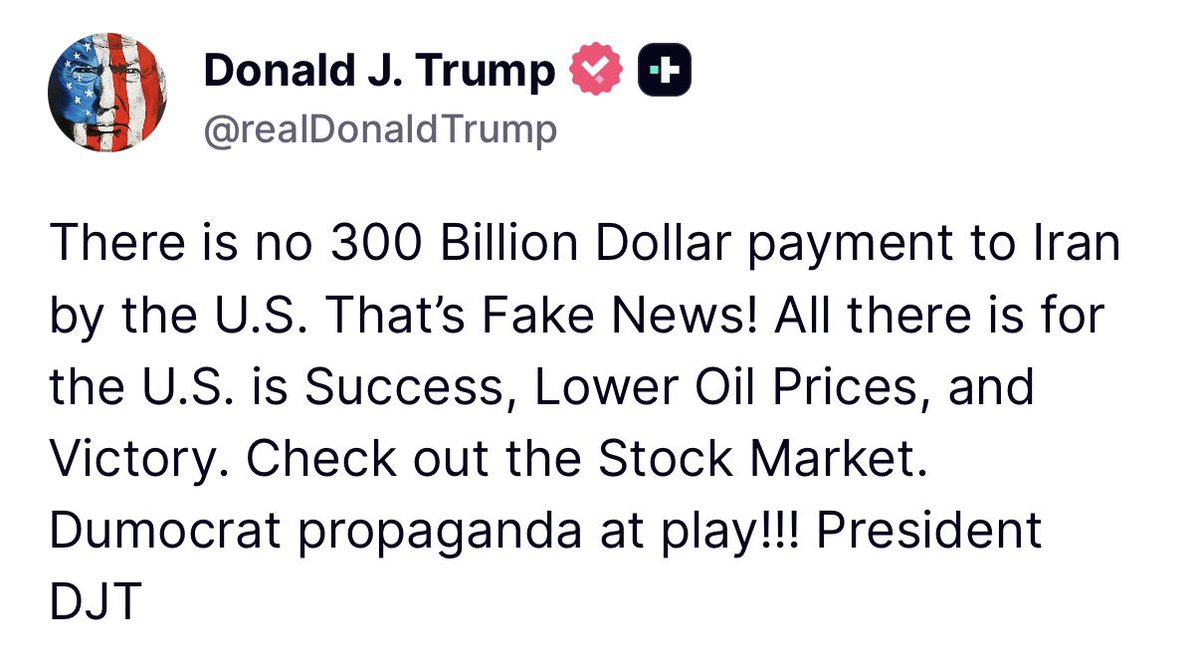
“There is no 300 Billion Dollar payment to Iran by the U.S. That’s Fake News! All there is for the U.S. is Success, Lower Oil Prices, and Victory. Check out the Stock Market. Dumocrat propaganda at play!!!” - President Donald J. Trump
5
16
581
Austin Slay retweeted

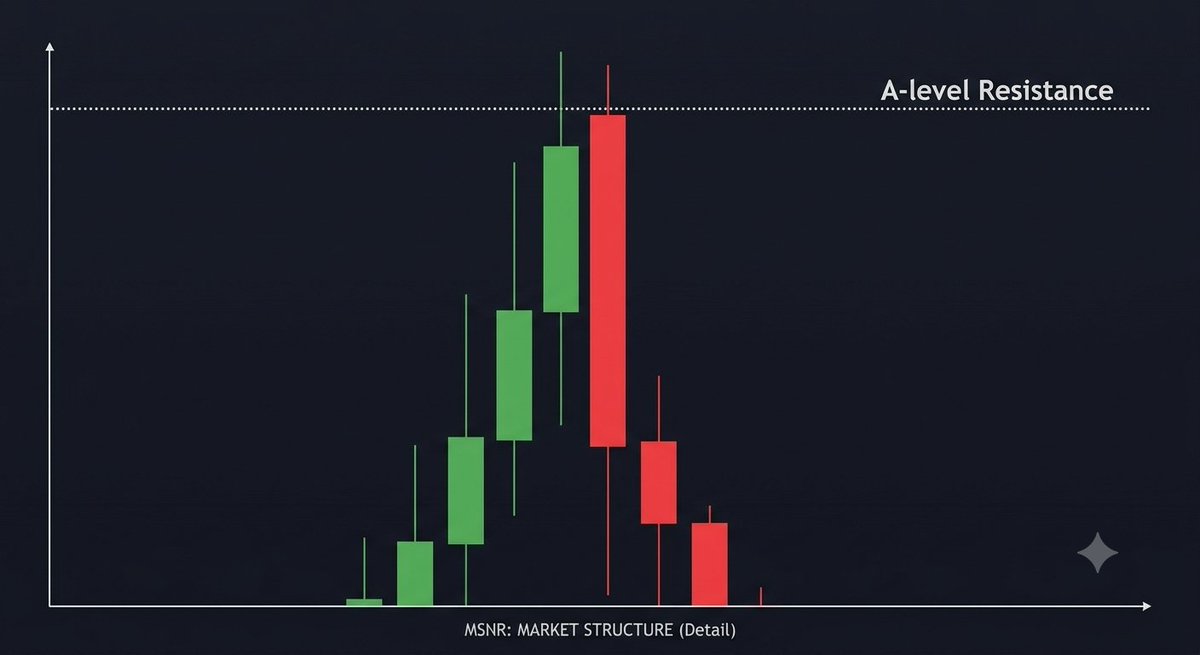
Institutional whales and market inflow.
Market inflow implications
How whales move the trading 💹 market
Thread 👇 👀 ☠️ 💹
22
8
12
83


John Hudson retweeted

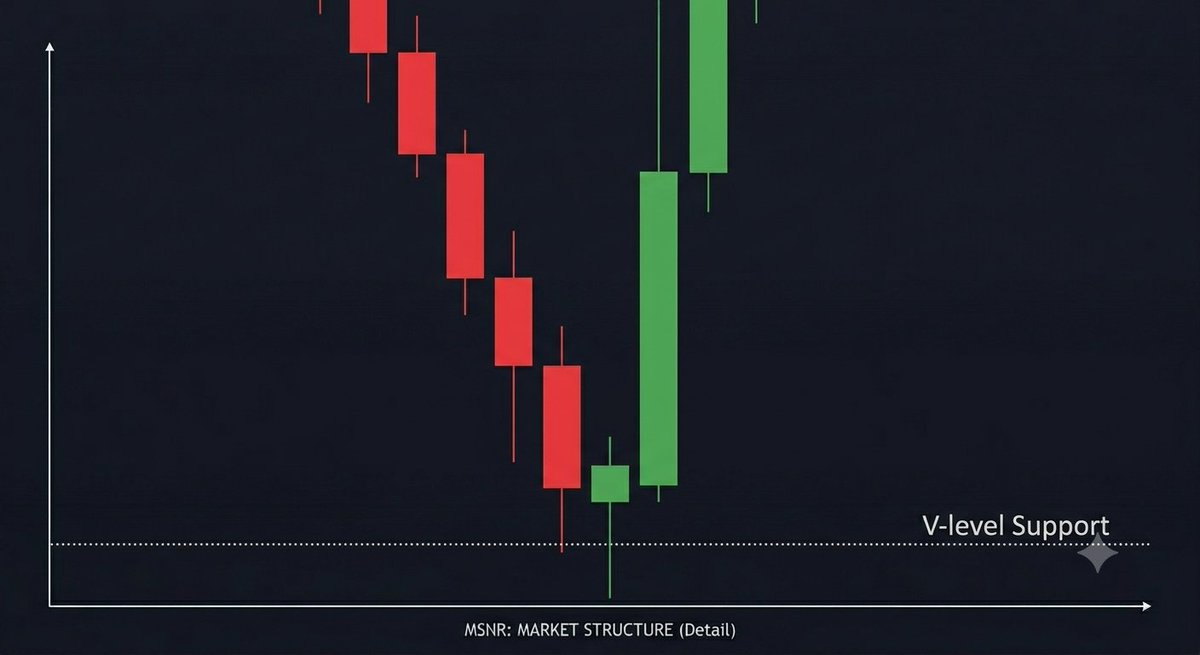
Incredible perspective here. Look at the double inflow band structure


1
4
38
1,608

1997 (Blair’s first year): Net inflow around 47,000.
• By 2004: Rose to around 223,000.
• Average annual net migration under Labour (1997–2010): Roughly 200,000 — about five times higher than the previous Conservative period (1990–1996). channel4.com
The foreign-born population grew substantially, reaching about 8.3% of the UK population by the mid-2000s
Fact.
6


🟠 Daily Bitcoin Report June 18, 2026
📊 PRICE ACTION
Open: $64,446 | High: $64,752 | Low: $62,159
Current: ~$63,046 | Change: -2.17% (candle still open)
Post-FOMC pressure continues. Second consecutive red day following Warsh’s hawkish dot plot. Market still digesting the Fed eliminating forward guidance entirely.
📈 TECHNICAL READ
Trend Exhaustion: 61.96 — holding neutral despite price drop
Lower BB: $57,714 — price is $5,332 above it
SMA: $72,403 — major resistance overhead
Channel lower rail: $67–68K — still unreclaimed
Key support: $62,000 — holding so far
Notable: exhaustion at 62 while price dropped 2.17% sellers losing momentum. The $59,073 low is now 14 days old and unthreatened.
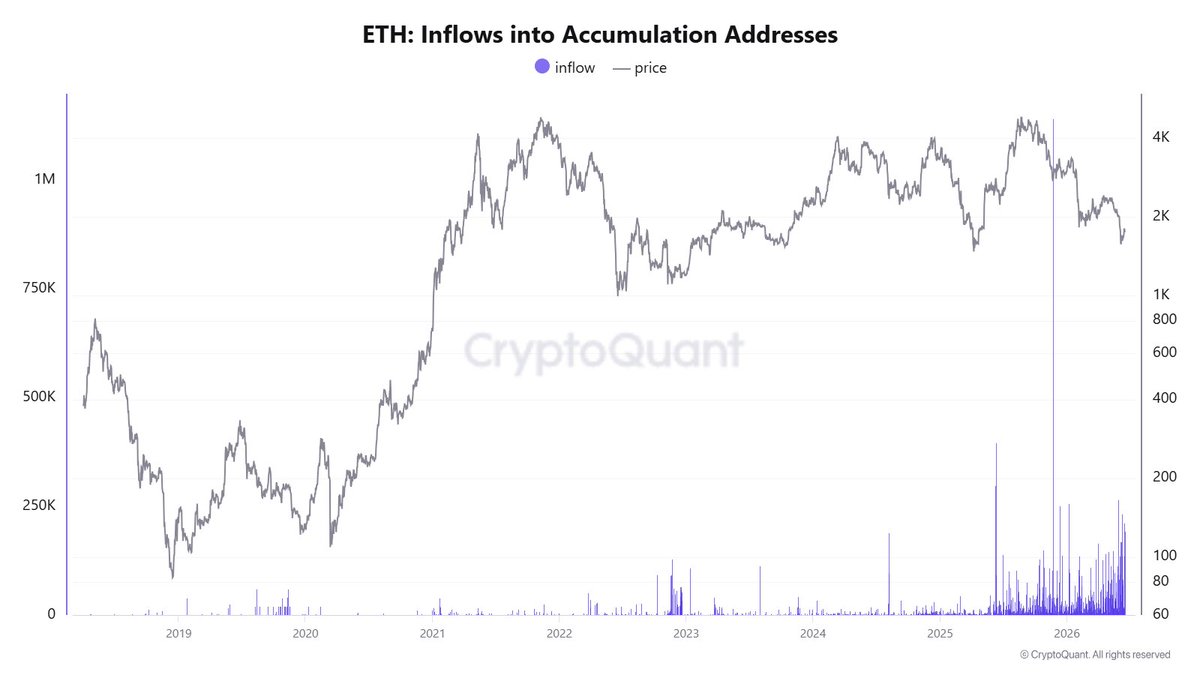
🔍 ON-CHAIN (Latest Data)
→ LTH absorbed 125,000 BTC in June, one of the largest monthly accumulation events this cycle
→ Whale wallets 1,000 BTC now control 35.82% of total supply multi-month high
→ 11,000 BTC left exchanges in 24hrs on June 16 cold storage accumulation
→ BlackRock now world’s 3rd largest Bitcoin entity 764,000 BTC per Arkham
→ Strategy holds 846,842 BTC after adding 1,587 BTC last week
→ Monthly volume: 201,810 BTC largest in Bitcoin history. 12 days still remaining.
Retail is selling. Institutions and whales are loading. Classic bottom behavior.
📰 TODAY’S NEWS
→ FOMC delivered hawkish shock — 9 of 18 Fed members now project 2026 rate hike
→ Warsh eliminated forward guidance entirely, unprecedented move
→ ETF outflows: $82.2M on June 17 — Fidelity FBTC bucked trend with $14M inflow
→ Fear & Greed Index: 15, Extreme Fear. Lowest since the June 5 cycle low.
→ US-Iran peace deal officially signed today in Switzerland, oil declining
→ Wyoming launched first state-backed stablecoin FRNT token
→ $1.1B in liquidations triggered over 24 hours post-FOMC
⚖️ WHERE WE STAND
Cautious short term. Hawkish FOMC extended the recovery timeline 60–90 days.
But here’s what matters long term:
The most sophisticated money in the world whales, LTHs, BlackRock, Strategy is buying everything retail sells at $62–63K.
Monthly volume of 201,810 BTC is the largest in Bitcoin history.
That is the great transfer. Weak hands to strong hands.
The recovery path:
Oil decline post-Iran deal → July CPI cools → September FOMC less hawkish → recovery accelerates.
Key level to hold: $62,000
Next major catalyst: CLARITY Act July 4 target 🟠

4
8
201


@zenpundit
Throwing infinite amounts of taxpayer funded money at government institutions is all that the government knows how to do. In the case of schools, the student never sees the benefit of all the extra inflow. It's all just lottery money to make the administration more top-heavy and even more useless than it was before.
It's been like that, at the very least, since the '80s.
Even when they throw that money at physical infrastructure, it's always in vain.
One of the most sickening emblems of that spending culture is Central High School in Kansas, dubbed the Taj Mahal.
$80,000,000 (today's dollars) spent on a facility in a so-called "underserved community", to build a high school with an Olympic pool and many more accoutrements. Destroyed/dilapidated (just like all of public housing) in no time at all. No uptick in academic achievement/performance was ever recorded. Constructed to accommodate 1800 students; but has less than 500 now.
5

Unfortunately it's because the AI companies are getting massive money inflow that they use to steal executives of SaaS companies, which in turn boost their valuations further. This is short-term though. You can't buy your way out of fundamentals.
42

47m
Debe ser de sus peores trades. De todas formas se termina cuando cierra la posición. Pero teniendo tantos nombres en el mundo de la IA con valuaciones exorbitantes no se entiende xq shorteo al que tiene el mayor MOAT en el sector con mayor inflow del mundo.
26

U.S. NET OVERALL CAPITAL INFLOWS SLOWED SHARPLY TO $26.1 BILLION IN APRIL FROM $149.3 BILLION IN MARCH, DRIVEN BY A SWING IN PRIVATE-SECTOR FLOWS TO A $23.1 BILLION OUTFLOW FROM A $160.6 BILLION INFLOW THE PREVIOUS MONTH. ...
69

U.S. NET OVERALL CAPITAL INFLOWS SLOWED SHARPLY TO $26.1 BILLION IN APRIL FROM $149.3 BILLION IN MARCH, DRIVEN BY A SWING IN PRIVATE-SECTOR FLOWS TO A $23.1 BILLION OUTFLOW FROM A $160.6 BILLION INFLOW THE PREVIOUS MONTH.
1
1
10
7,548
JCoop retweeted

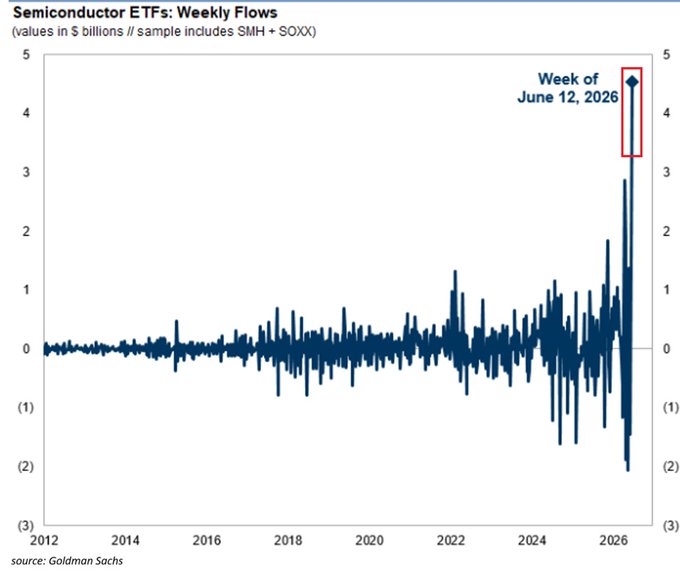
INSIGHTS:
Semiconductor ETFs just attracted $4,700,000,000 in a single week.
The largest combined weekly inflow ever recorded.
62% above the previous record.
Half of the most traded ETFs in early June were semiconductor related.
The SOX index up 90% year to date.
The data is real. The momentum is real.
But so is this.
Semiconductors now make up 14% of the entire U.S. stock market.
Double the Dot Com peak of 7% in 2000.
Shiller PE at all-time highs.
Valuations more stretched than 96.8% of all readings in history.
$4,700,000,000 flowing into one sector in one week.
At these concentration levels.
Is either the beginning of something historic.
Or the final stage of something that ends badly.
The 2000 comparison is worth understanding before you chase.
5
3
59
5,817

U.S. NET OVERALL CAPITAL INFLOWS SLOWED SHARPLY TO $26.1 BILLION IN APRIL FROM $149.3 BILLION IN MARCH, DRIVEN BY A SWING IN PRIVATE-
SECTOR FLOWS TO A $23.1 BILLION OUTFLOW FROM A $160.6 BILLION INFLOW THE PREVIOUS MONTH.
347