
7 Nov 2025
⚽ New in JSSM: Weekly acceleration & deceleration loads significantly impact neuromuscular performance in soccer players. Session-to-session analysis offers key insights for load management & recovery youtube.com/watch?v=U8oX-Y4B…
#SportsScience #Soccer #LoadMonitoring #JSSM
3
547

31 Oct 2025
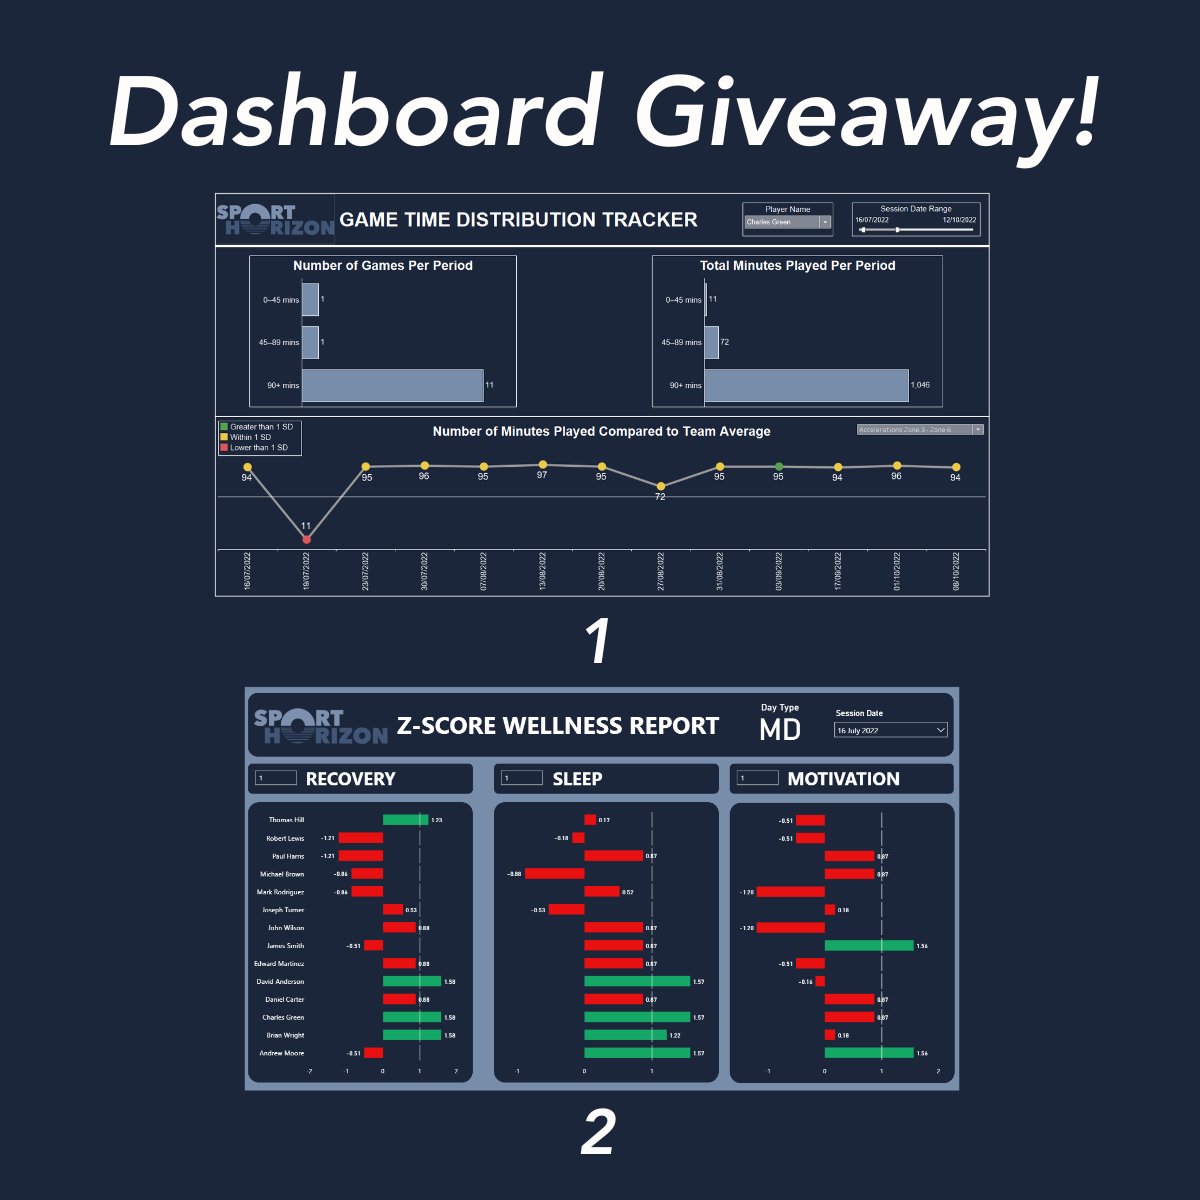
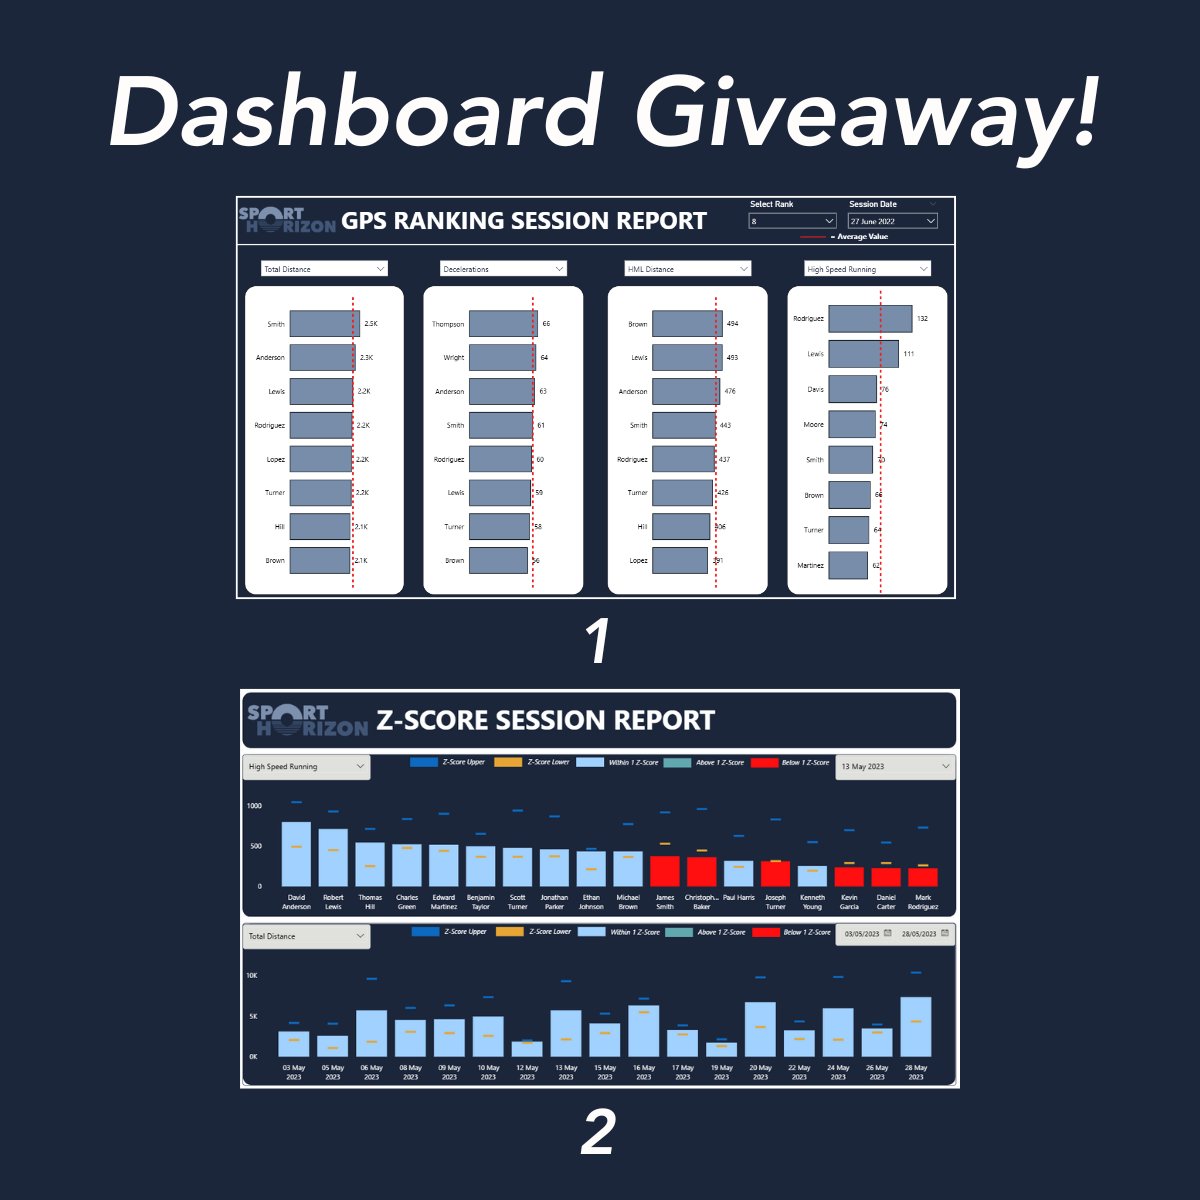
🎉 Dashboard Giveaway!
This month’s most popular dashboard was #2, and as promised, we’re giving it away for free!
Download this Power BI dashboard using the link below.
Link: sporthorizon.co.uk/free-dash…
#PowerBI #Tableau #DataVisualisation #SportsAnalytics #SportHorizon #SportScience #PerformanceAnalysis #DataAnalytics #Football #Soccer #Excel #AthleteMonitoring #LoadMonitoring #DataAnalysis #BespokeInsights

3
182
30 Oct 2025
🎯 How to Use the Top N Feature in Your Visuals in Power BI
In this tutorial, Jay Binning (@jaysbdata) walks you through how to use the Top N filter in Power BI, a powerful feature that allows you to display only the top or bottom performers in your visuals based on any chosen metric.
This tool is especially useful for sport scientists and analysts who want to quickly identify standout performances, compare athletes, or focus on a specific group, such as the top 5 players for total distance, or the bottom 3 for recovery scores.
Jay takes you step by step through:
⚙️ How to build a visual from scratch using the Top N filter
📊 How to link the filter with your visual to make it fully dynamic
🎯 How to easily switch between top and bottom performers
A simple but powerful technique that can make your dashboards more insightful, interactive, and professional.
Click the link in the comments to watch the video!
#PowerBI #Tableau #DataVisualisation #SportsAnalytics #SportHorizon #SportScience #PerformanceAnalysis #DataAnalytics #Football #Soccer #Excel #AthleteMonitoring #LoadMonitoring #DataAnalysis #BespokeInsights

1
1
2
128
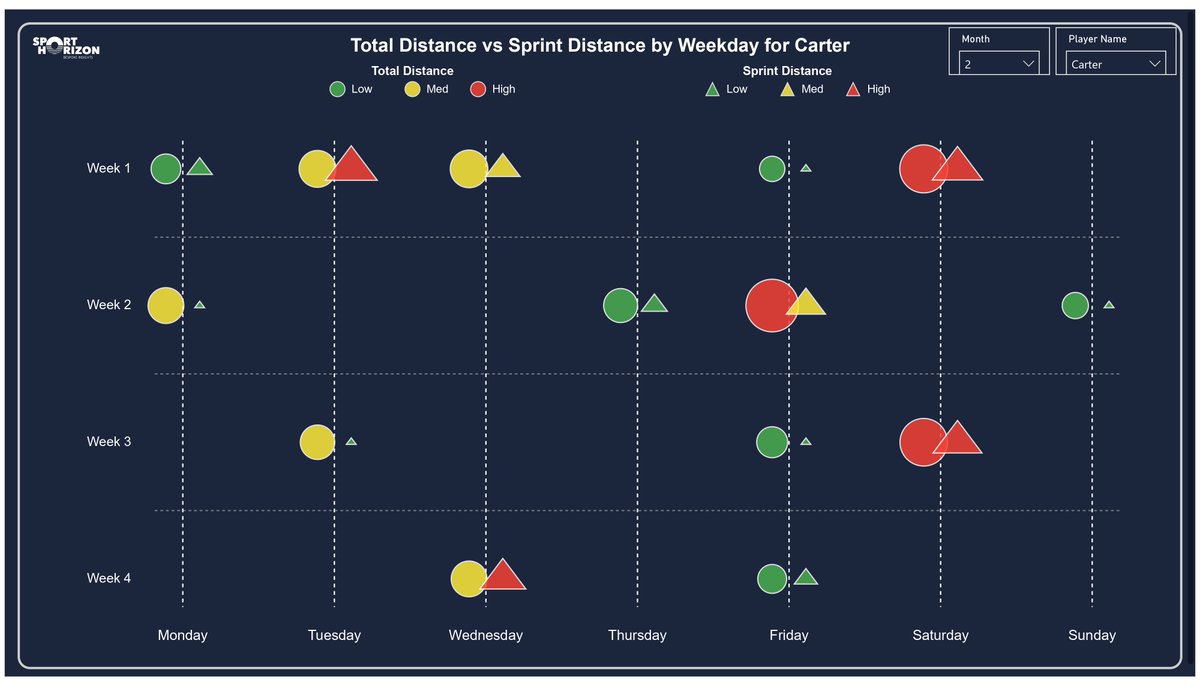
28 Oct 2025
So we've upgraded our categorical scatterplot
Remember the one we shared last time? This is version 2.0 and honestly, it's way more useful.
Now you can actually see Total Distance vs Sprint Distance broken down week by week for each player.
Why this matters: Instead of just looking at overall trends, we can now pinpoint exactly which weeks a player was pushing hard, when they might need recovery, or when their sprint performance dropped off.
It's the kind of detail that helps coaches and analysts make better calls on training loads, rotation, and keeping players healthy.
Sometimes you need the big picture. Sometimes you need to zoom in. This does both.
What kind of sports analytics breakdowns would you like to see next? Drop your thoughts below.
Follow Sport Horizon for more performance insights
#PowerBI #Tableau #DataVisualisation #SportsAnalytics #SportHorizon #SportScience #PerformanceAnalysis #DataAnalytics #Football #Soccer #Excel #AthleteMonitoring #LoadMonitoring #DataAnalysis #BespokeInsights
3
170
27 Oct 2025
🎯 Dashboard Giveaway Alert!
We're showcasing two powerful dashboards! The community’s favourite will be unlocked and given away this week.
👇 Cast your vote in the comments below. The dashboard with the most buzz by week's end will be available for download.
#PowerBI #Tableau #DataVisualisation #SportsAnalytics #SportHorizon #SportScience #PerformanceAnalysis #DataAnalytics #Football #Soccer #Excel #AthleteMonitoring #LoadMonitoring #DataAnalysis #BespokeInsights
4
163
24 Oct 2025
New Blog! Reflections on My First Conference: Training Ground Guru Live 2025⚽📊
In this new blog, Jay Binning (@jaysbdata) shares his reflections from attending his first ever Training Ground Guru Conference at the iconic Old Trafford on the 7 8th October.
Across two days of inspiring talks and discussions, Jay gained greater insight into how innovation, data, and culture are shaping the future of football.
Key takeaways include:
✅ Data is only powerful when it’s shared and understood across the whole organisation.
✅ Technology like Eyeball is transforming how emerging talent is identified and developed.
✅ AI is becoming a game-changer in recruitment, helping clubs make smarter, faster decisions.
✅ Culture remains at the heart of success, as Ryan Giggs reminded us through lessons from Sir Alex Ferguson’s era.
From hearing about Nottingham Forest’s data-driven approach to discovering how London City Lionesses are thriving as an independent women’s club, this blog captures everything Jay took away from this amazing conference!
🔗 Click here to read the full blog: sporthorizon.co.uk/blog/refl…
#PowerBI #Tableau #DataVisualisation #SportsAnalytics #SportHorizon #SportScience #PerformanceAnalysis #DataAnalytics #Football #Soccer #Excel #AthleteMonitoring #LoadMonitoring #DataAnalysis #BespokeInsights

1
4
147
23 Oct 2025
🚀 We’re Live! 'Power BI Session Planner – Level 1' course
Our brand-new mini-course from Sport Horizon is officially available today!
Built by practitioners for practitioners, this course takes you step by step through building your own Session Planner in Power BI — from data prep and modelling, right through to team and drill analysis reports.
Here’s what’s inside:
1️⃣ Drill Overview Report (Team-Level)
2️⃣ Single Drill Analysis (Team-Level)
3️⃣ Session Load Planner
4️⃣ Data Preparation & Modelling
5️⃣ Wrap Up & Implications
💰 £79 – official launch price
📅 Available now
🎓 Learn how to plan, analyse, and report your training sessions more effectively using Power BI.
🔗 Find out more or sign up here:
sporthorizon.co.uk/powerbi-s…
#PowerBI #SportsAnalytics #DataVisualisation #SportHorizon #SportScience #PerformanceAnalysis #DataAnalytics #Football #Soccer #Excel #AthleteMonitoring #LoadMonitoring #BespokeInsights #DataAnalysis

3
118
22 Oct 2025
📰 New Blog Post from Sport Horizon “Performance, Development, and Alignment – Reflections from the Training Ground Guru Conference at Old Trafford”
Sport Horizon’s latest blog post, written by @CiDeely, offers a compelling reflection on Training Ground Guru Live 2025, held at Old Trafford. The second day of the conference focused on Performance, Development, and Alignment — a theme that resonated across every session and speaker, highlighting how football clubs are evolving through strategic clarity and cultural cohesion.
🔹 Sporting Director Round-Table Adam Underwood (Leeds United), Lee Dykes (Brentford FC), and Mladen Sormaz (formerly Barnsley FC) shared diverse insights into leadership and club-wide alignment.
- Adam emphasised the importance of cross-departmental clarity: “Change is the only constant in football.”
- Lee spoke about Brentford’s success through innovation and smart strategy rather than financial muscle.
- Mladen provided a grounded view from the EFL, stressing the value of communication and collaboration.
🔹 Louisa Collis – Birmingham City Academy Louisa’s presentation stood out as one of the most inspiring of the day. She detailed Birmingham’s journey from near academy closure to achieving Category One status in just a year — driven by:
- Unified alignment across departments
- Rigorous processes and attention to detail: “It’s a club audit, not an academy audit.”
- A culture of belief, high standards, and community spirit
🔹 Sarah Batters – London City Lionesses Sarah shared how independence has empowered the Lionesses to build a world-class environment in women’s football. Her message was clear and bold: “Women’s football doesn’t need to imitate the men’s model; it needs to build its own version of excellence.”
💡 Key takeaway from Ciaran’s reflection: Whether in the Premier League, EFL, or WSL, success hinges on alignment. When people, processes, and purpose are in sync, performance naturally follows.
Read the full blog: 👉 sporthorizon.co.uk/blog/perf…
#PowerBI #Tableau #SportsAnalytics #DataVisualisation #SportHorizon #SportScience #PerformanceAnalysis #DataAnalytics #Football #Soccer #Excel #AthleteMonitoring #LoadMonitoring #BespokeInsights #DataAnalysis
2
144
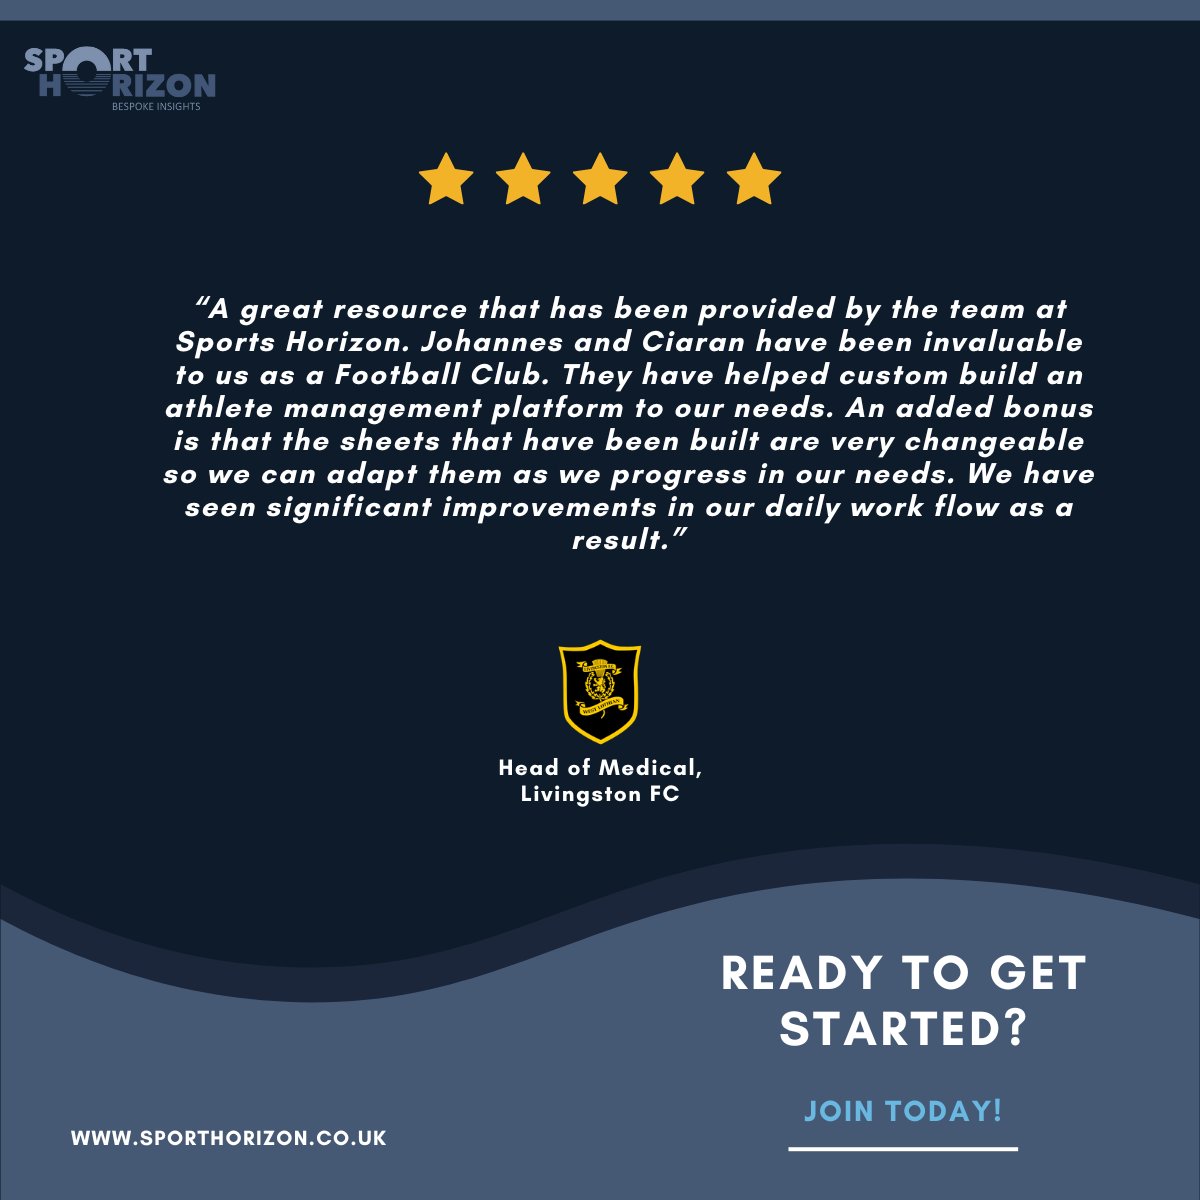
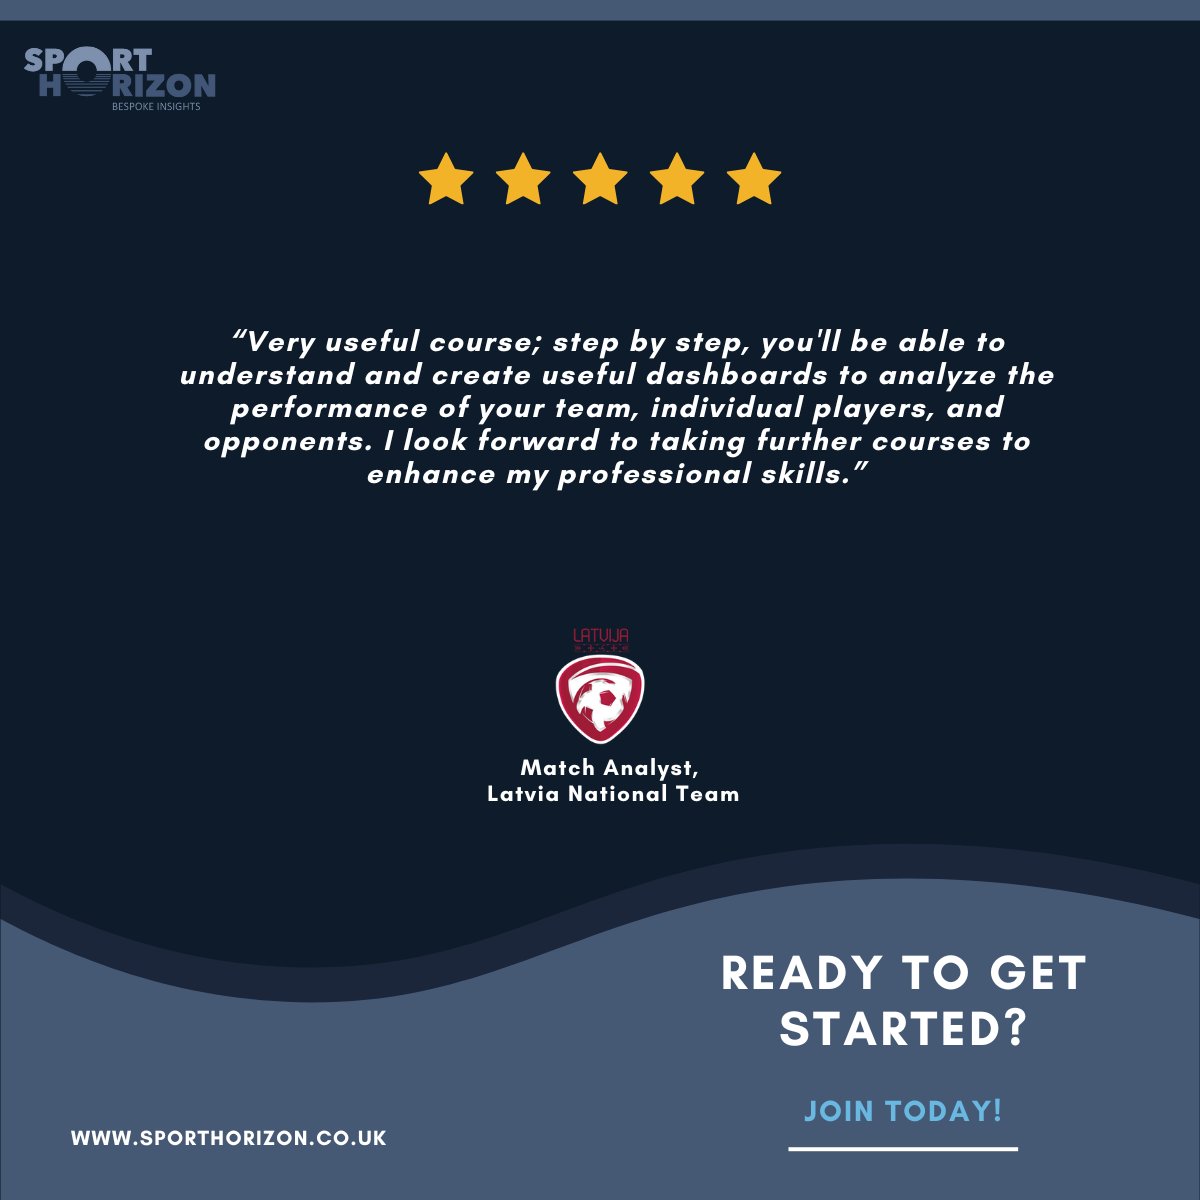
17 Oct 2025
Here are just a few examples of the reviews our customers have shared with us.
If you're looking to elevate your data game and boost your team's performance, explore our services today!
#PowerBI #Tableau #SportsAnalytics #DataVisualisation #SportHorizon #SportScience #PerformanceAnalysis #DataAnalytics #Football #Excel #AthleteMonitoring #LoadMonitoring #BespokeInsights

1
194
16 Oct 2025
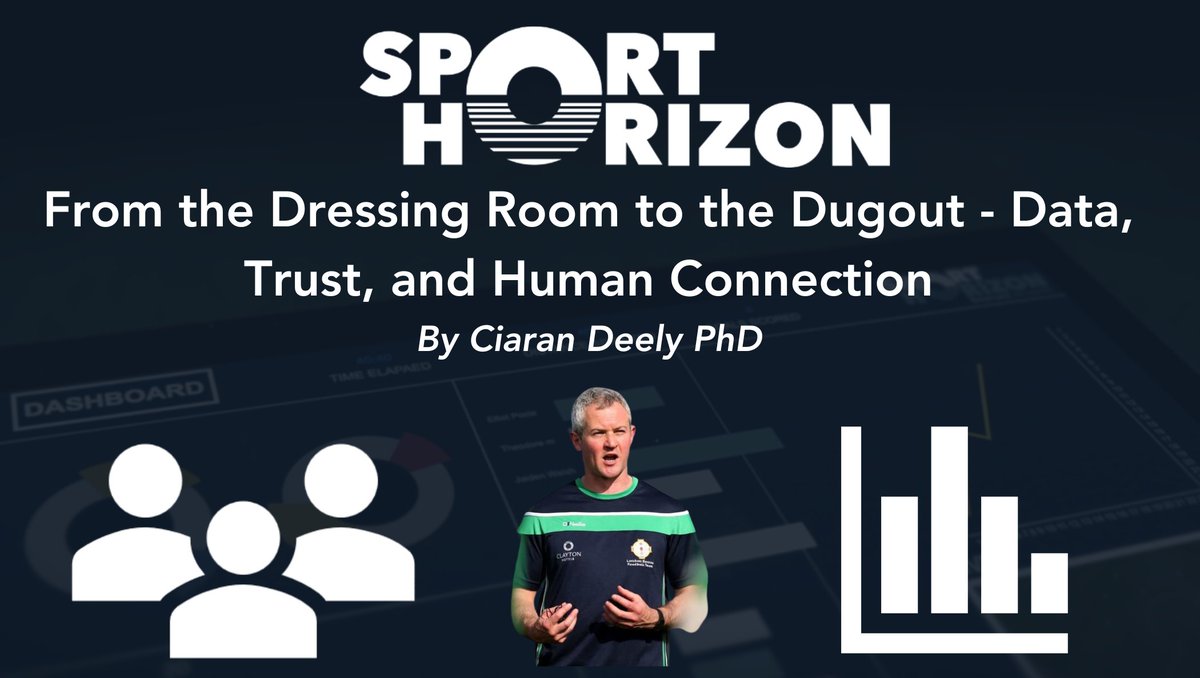
📝 New on the Sport Horizon Blog: “From the Dressing Room to the Dugout: Data, Trust, and Human Connection”
Last week, @CiDeely attended Training Ground Guru Live 2025 at Old Trafford — a brilliant gathering of football minds from boardroom to boot room. One session that particularly resonated was the conversation between Phil Jones (former Manchester United & England defender) and Lee Johnson (Head Coach at Lommel SK, previously of Sunderland, Bristol City & Hibernian).
Their discussion served as a timely reminder of what football can sometimes lose sight of in the age of dashboards and data dumps — that trust, timing, and human connection remain at the heart of performance.
🔹 Phil Jones – A Player’s Perspective Jones spoke openly about how players engage with data — and how it’s not just about what’s said, but when and how. As he put it: “Straight after a 3–0 defeat at Anfield isn’t the time to talk about it.”
🔹 Lee Johnson – A Coach’s Lens Johnson built on that, emphasising that the process must be player-led. Data should support reflection and learning — not feel like surveillance. Emotional intelligence, he argued, is every bit as important as metrics.
💬 Both perspectives converged on a shared truth: data only drives performance when delivered with empathy and purpose.
Ciaran has shared a short reflection on the Sport Horizon blog, exploring what this session means for today’s coaches, analysts, and sport scientists.
👉 Read the full piece: sporthorizon.co.uk/blog/from…
#PowerBI #Tableau #SportsAnalytics #DataVisualisation #SportHorizon #SportScience #PerformanceAnalysis #DataAnalytics #Football #Excel #AthleteMonitoring #LoadMonitoring #BespokeInsights
1
3
3,042
15 Oct 2025
Here’s a sneak peek from our upcoming Power BI Session Planner mini-course!
In this part of the course, we walk you through one of the most important first steps — connecting Power BI to the Sport Horizon Insights API.
This connection unlocks everything that follows: automated data updates, cleaner workflows, and the foundation for all the reports we will create.
📅 Launching 23 October. Purchase with a discount now and access it 20.October.
#PowerBI #Tableau #DataVisualisation #SportsAnalytics #SportHorizon #SportScience #PerformanceAnalysis #DataAnalytics #Football #Soccer #Excel #AthleteMonitoring #LoadMonitoring #DataAnalysis #BespokeInsights
2
105
14 Oct 2025
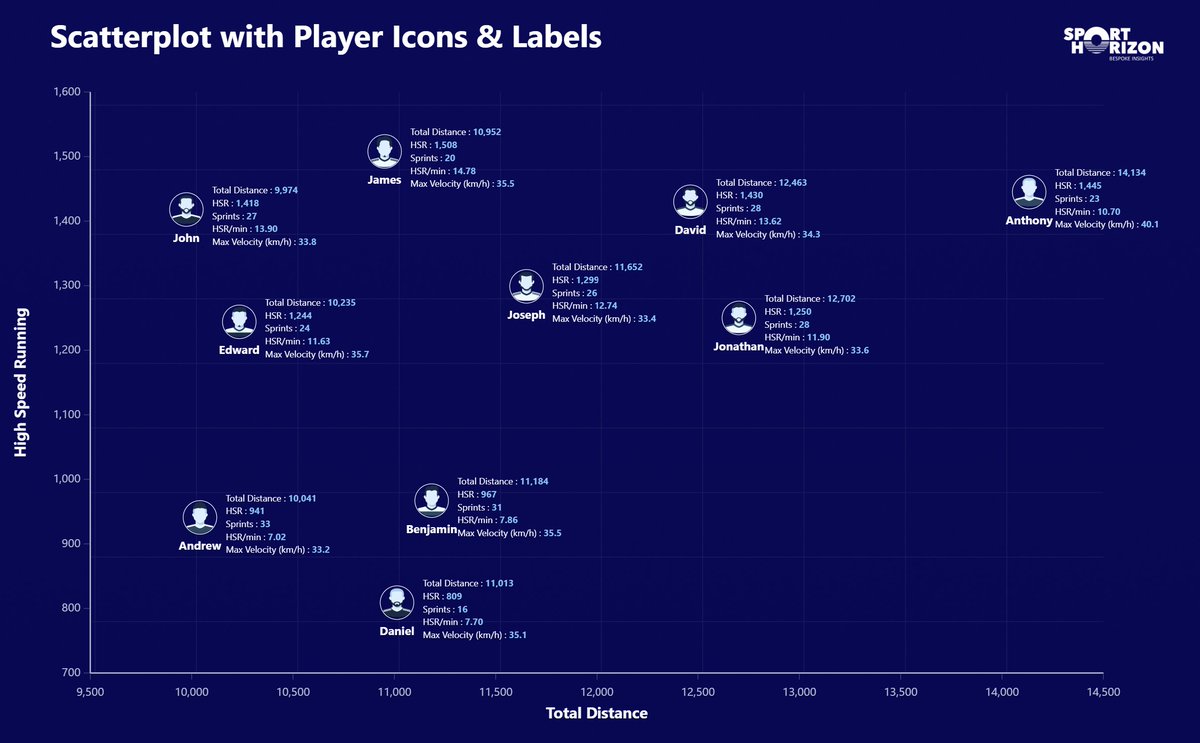
Advanced Scatterplot in Power BI: Visualising Player Performance
Doing the impossible is what we at Sport Horizon strive for.
We’ve already created a scatterplot with player icons — and now we’ve added fully customisable data labels, making it even more powerful and useful.
- Compare players instantly with visual icons and stats.
- Customise data labels to focus on what matters most.
- Highlight key metrics like distance, speed, sprints, and HSR/min.
- Save time by replacing complex tables with a single, intuitive chart.
- Empower coaches, analysts and players to make smarter decisions.
For more cutting‑edge sports analytics and advanced visualisations, follow Sport Horizon.
#PowerBI #Tableau #DataVisualisation #SportsAnalytics #SportHorizon #SportScience #PerformanceAnalysis #DataAnalytics #Football #Soccer #Excel #AthleteMonitoring #LoadMonitoring #DataAnalysis #BespokeInsights
3
366
13 Oct 2025
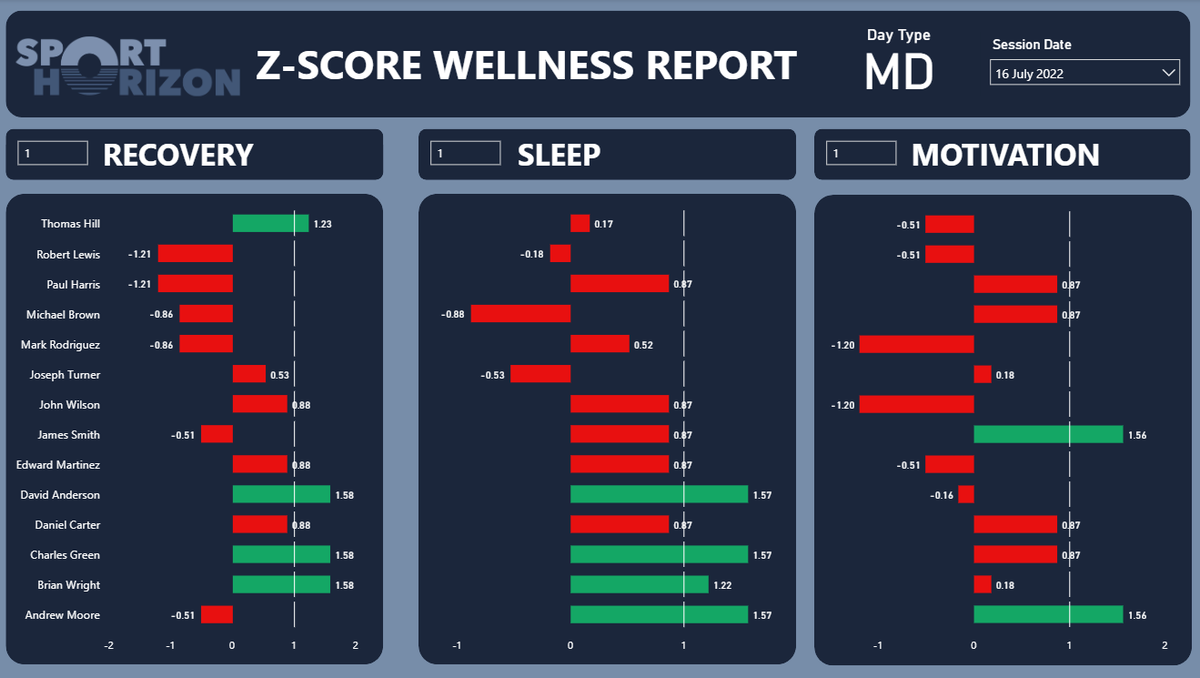
🔍 Z-Score Wellness Report in Power BI
Our data expert Jay Binning (@jaysbdata) has created a truly unique dashboard that brings together two powerful elements: wellbeing data and z-scores.
Tracking wellbeing metrics such as sleep, motivation, and recovery is essential for understanding how players are feeling, helping practitioners better support and prepare them. However, wellbeing dashboards can often be difficult to interpret when they’re just raw values.
That’s where the use of z-scores makes all the difference. By converting wellbeing data into z-scores, this dashboard allows you to easily see which players are performing above or below the daily average, giving a clear visual indicator of who’s feeling good and who may need closer attention.
In addition, this includes customisable targets, where you can input a specific z-score threshold. The bars then automatically colour-code based on values above or below that target, making it effortless to identify players whose wellbeing values stand out.
A simple, insightful, and highly effective dashboard, designed to help sport scientists translate wellbeing data into meaningful action.
#PowerBI #Tableau #DataVisualisation #SportsAnalytics #SportHorizon #SportScience #PerformanceAnalysis #DataAnalytics #Football #Soccer #Excel #AthleteMonitoring #LoadMonitoring #DataAnalysis #BespokeInsights
1
1
3
186
10 Oct 2025
🔍Player Wellbeing Report in Power BI
Tracking athlete wellbeing, across areas like motivation, sleep quality, and recovery, is vital for optimising performance, preventing injury, and supporting long-term development. This Power BI dashboard has been designed specifically for sports practitioners who want to monitor and interpret wellbeing data with clarity and precision.
This dashboard enables you to track key wellbeing metrics, but what truly sets it apart is:
- Clear display of historical team averages.
- Session-specific team averages shown, with indicators denoting whether values are higher or lower than usual, colour coded as normal/high, low, or very low.
- A bar chart visualising individual player values, also colour coded as normal/high, low, or very low, for easy interpretation.
- A date filter to view data across different sessions, with the 'day type' being shown.
- Options to view average, percentile values, and standard deviation for deeper insights.
If you're keen to build dashboards like this, explore our Power BI Level 2 course: 👉 sporthorizon.co.uk/powerbi-c…
#PowerBI #Tableau #DataVisualisation #SportsAnalytics #SportHorizon #SportScience #PerformanceAnalysis #DataAnalytics #Football #Soccer #Excel #AthleteMonitoring #LoadMonitoring #DataAnalysis #BespokeInsights

4
480
9 Oct 2025
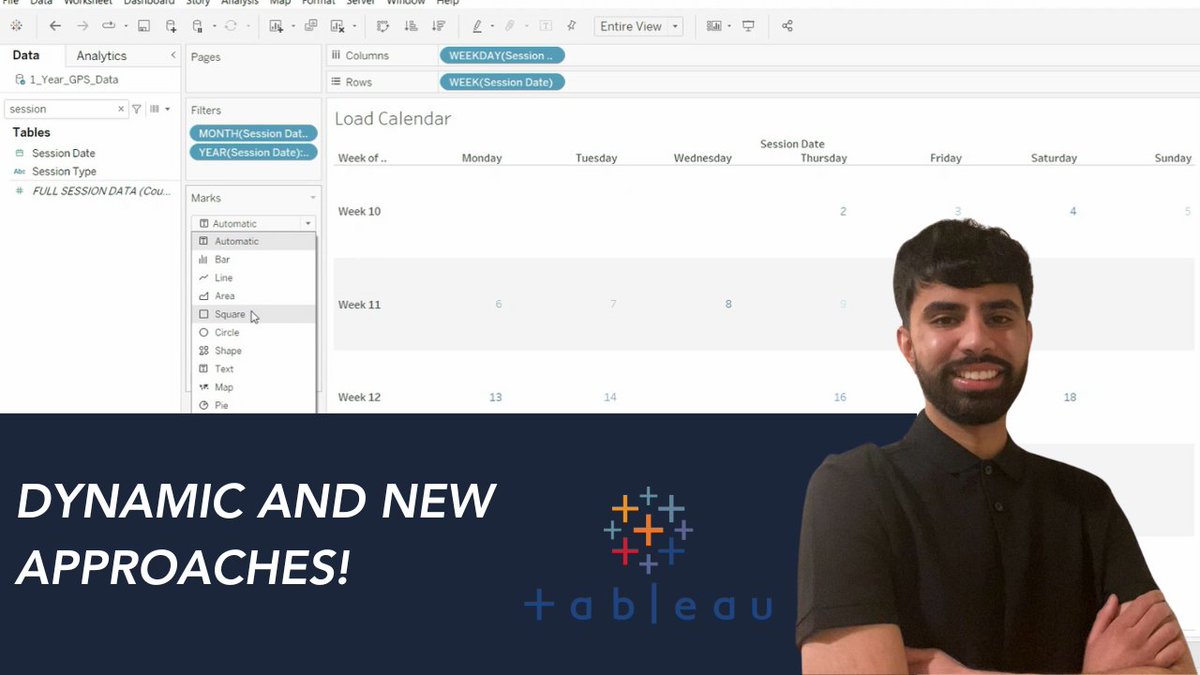
📆 How to Create a Load Calendar in Tableau
When working with athlete monitoring data, it’s often easy to lose sight of how training load fluctuates day to day. Seeing load metrics over time gives sport scientists a clear perspective on training patterns, recovery gaps, and how intensity builds across a week or month.
That’s exactly why our data expert Jay Binning (@jaysbdata) came up with this unique idea, creating a Load Calendar in Tableau. Instead of the usual line or bar charts, Jay designed a visual calendar that displays each day of activity as a coloured box, with the colour intensity reflecting the training load for that day.
In this tutorial, Jay walks you step-by-step through how to:
- Build a functional calendar layout in Tableau.
- Apply colour conditioning to each day based on load values.
- Create an interactive, easy-to-read view of your athletes’ workloads.
💡 Why this is so valuable for sport scientists:
- It provides a clear snapshot of training distribution across an entire month.
- You can instantly identify patterns: heavy training blocks, rest periods, or potential overload.
- The compact visual design makes it ideal for communication with coaches and support staff.
- It bridges the gap between data analysis and practical application, helping guide informed decision-making around athlete management.
📺 Click the link in the comments to watch this tutorial!
#PowerBI #Tableau #DataVisualisation #SportsAnalytics #SportHorizon #SportScience #PerformanceAnalysis #DataAnalytics #Football #Soccer #Excel #AthleteMonitoring #LoadMonitoring #DataAnalysis #BespokeInsights
1
2
3
301
3 Oct 2025
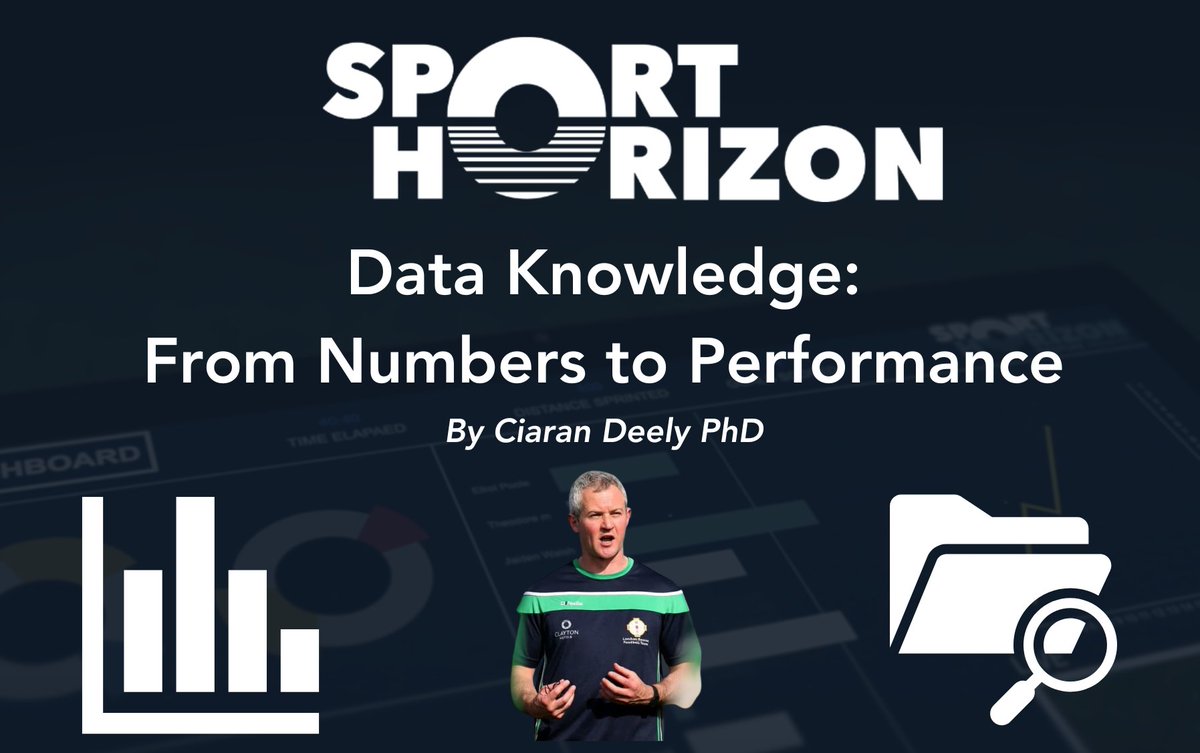
New Blog: Data Knowledge – From Numbers to Performance 📖
In this new blog, @CiDeely shares his journey from numbers to performance.
Drawing on experiences at QPR FC Academy, Kerala Blasters FC, London GAA, Wexford GAA, DSS Coaching, and Sport Horizon, Ciaran reflects on the real value of data in sport:
✅ It only matters if it helps people make better decisions.
✅ Dashboards should simplify complexity, not just look slick.
✅ Context is everything, numbers on their own are empty.
✅ Sport science works best when it supports instinct, not replaces it.
From GPS figures that didn’t stack up against Championship demands, to CMJ scores that only made sense when tracked over time, this blog highlights how translating data into clarity builds trust and drives performance.
🔗 To read the blog, check out the link in the comments!
#PowerBI #Tableau #DataVisualisation #SportsAnalytics #SportHorizon #SportScience #PerformanceAnalysis #DataAnalytics #Football #Soccer #Excel #AthleteMonitoring #LoadMonitoring #DataAnalysis #BespokeInsights
1
1
3
589
2 Oct 2025
How to Create a Dynamic Ranking Filter Using Parameters in Tableau
Parameters in Tableau are a powerful tool, they act like custom controls that let you input values or make selections, which then drive changes across your dashboard.
In this tutorial, data tutor Jay Binning (@jaysbdata) walks you through how to build a dynamic ranking filter using a parameter in Tableau. This feature allows you to set a ranking value (for example, “Top 10”), and instantly display only the players who fall within that ranking based on the chosen metric.
The result? Greater interactivity and more refined analysis. Whether you’re a coach, sport scientist, or performance analyst, this approach gives you a flexible way to focus on the players who matter most in a given context.
📊 A simple but highly effective tool to make your dashboards more powerful and user-friendly.
🎥 Click the link in the comments to watch the tutorial!
#PowerBI #Tableau #DataVisualisation #SportsAnalytics #SportHorizon #SportScience #PerformanceAnalysis #DataAnalytics #Football #Soccer #Excel #AthleteMonitoring #LoadMonitoring #DataAnalysis #BespokeInsights

1
1
3
246
29 Sep 2025
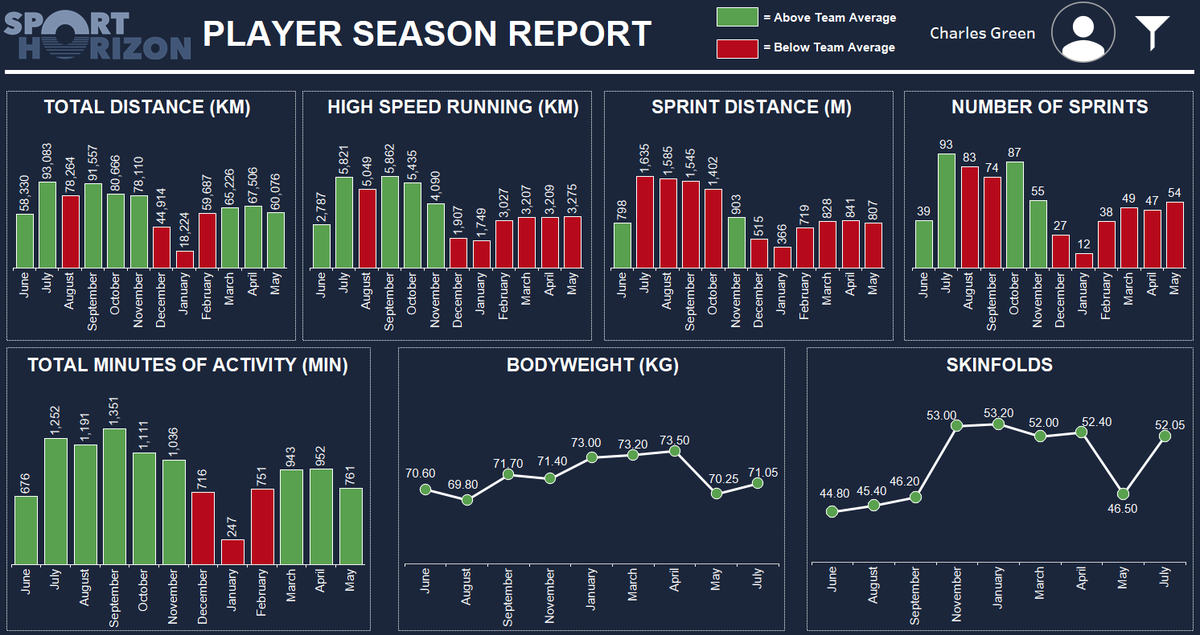
Player Season Report in Tableau
In most dashboards, we tend to look at topics in isolation, for example focusing only on physical data or only on body composition data. While there are clear advantages to this approach, combining both types of information can give a much richer and more valuable perspective.
That’s why our data expert, Jay Binning (@jaysbdata), designed this Player Season Report in Tableau. The dashboard brings together multiple metrics to provide an overall view of each month across the season, helping sport scientists track how a player is progressing over time.
✨ Key features include:
- Data points and bars colour-coded to show whether values are above or below the team average for that month.
- A player filter with photos updating dynamically as each player is selected.
- A date filter to easily focus on specific time periods.
This kind of dashboard gives practitioners a clear, holistic perspective, making performance conversations more insightful and grounded in evidence.
👉 Want to learn how to build dashboards like this? Check out our Tableau for Sport Scientists – Level 1 Course.
🔗 Find out more here: sporthorizon.co.uk/tableau-c…
#PowerBI #SportsAnalytics #DataVisualisation #SportScience #PerformanceAnalysis #SportHorizon #BespokeInsights #DataAnalytics #Football #Soccer #Excel #AthleteMonitoring #LoadMonitoring #DataAnalysis
1
2
339
23 Sep 2025
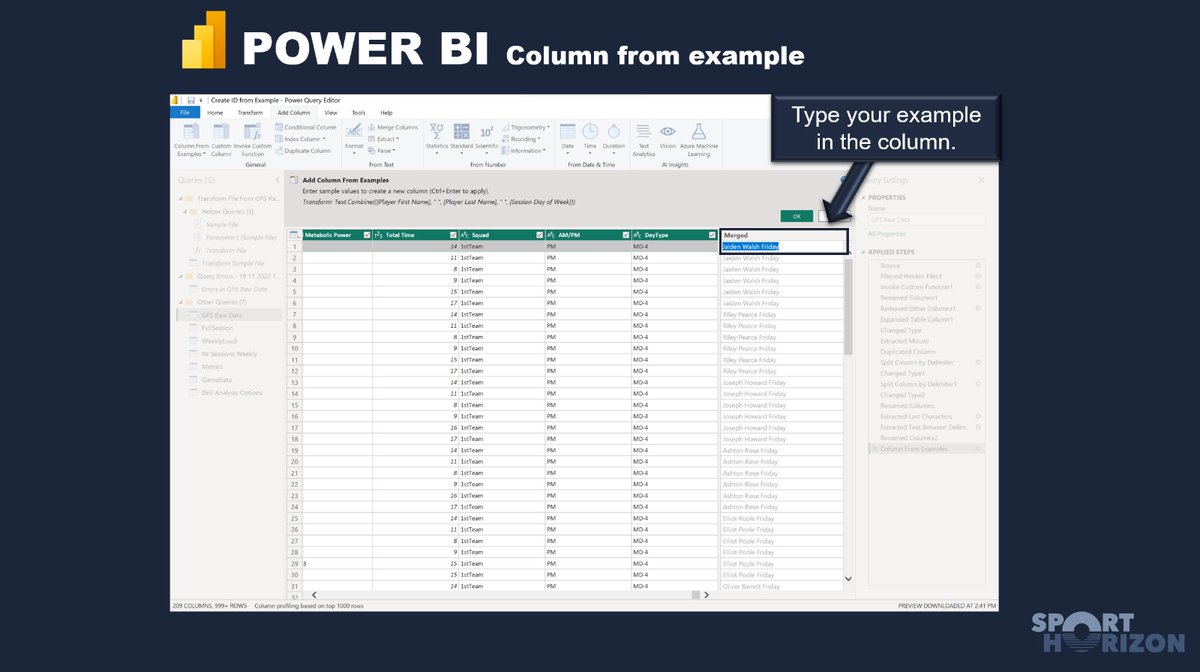
🎯 Power BI Tip: Using ‘Column from Example’ to Save Time
Sometimes the simplest features in Power BI are the most powerful. One that often gets overlooked is Column from Example, a tool that can save you loads of time when cleaning or shaping your data.
You’ll find it in the Power Query Editor:
- Go to the Add Column tab
- Select Column from Example
- Then choose From All Columns or From Selection depending on your dataset.
From there, you just type in what you want the new column to look like, and Power BI works out the logic for you.
For example:
- Want to extract the last name from a “Full Name” column? Just type one example, and Power BI generates the formula.
- Need to create a month name from a date? Type “January” for one row, and it applies it across the column.
- Splitting IDs, formatting text, or pulling out abbreviations? Column from Example has you covered.
When working with GPS metrics, wellness data, or testing results, you often need to clean and reformat raw exports quickly. This feature lets you do that easily, meaning you spend less time fixing data, and more time analysing performance.
#PowerBI #Tableau #DataVisualisation #SportsAnalytics #SportHorizon #SportScience #PerformanceAnalysis #DataAnalytics #Football #Soccer #Excel #AthleteMonitoring #LoadMonitoring #DataAnalysis #BespokeInsights
2
145
22 Sep 2025
🔥 Power BI Showdown: You’re in Control! 🔥
Two Power BI dashboards. The community’s top pick gets unlocked and released FREE to Sport Horizon this week 💥
👇 Cast your vote in the comments! The dashboard with the most hype by week’s end becomes yours to download.
#PowerBI #Tableau #DataVisualisation #SportsAnalytics #SportHorizon #SportScience #PerformanceAnalysis #DataAnalytics #Football #Soccer #Excel #AthleteMonitoring #LoadMonitoring #DataAnalysis #BespokeInsights
2
3
260