
$MSOS Target price for Next Week Get ready to hit it big ➡️stocktradeshouse.com
58

White People are extreme danger in the U.S. There is no safety net, just continious beatings, murder and rapes.
$SPY $QQQ $IWM $DIA $VTI $MDY $DBC $FEZ $OEF $IWF $IWD $PFF $VOO $IJH $IWO $IWN $ACWI $IEMG $AQST $SUPN $DRUG $MJ $OVID $NMTC $PRAX $CCM $NBIX $IGC $MSOS

White female doctor in Georgia strangled, sexually assaulted, and throat slit by a Black career criminal with 40 prior charges.
Zero MSM coverage.
Support executing this monster and jailing the woke judges who freed him?
A. Yes
B. No
226


🇺🇸 Trulieve ($TRLV) is now trading on the NYSE.
It's the first major U.S. cannabis operator to secure a listing on a premier U.S. exchange: a milestone many thought was still years away.
The cannabis industry just took a major step toward the financial mainstream.
Writer: Val
x.com/AdvisorShares/status/2…
1
9
397

2nd Floor Office; Wholesale, Delivery or Lab Potential 420property.com/listing/2nd-…
#420property #cannabis #MSOS
36

Recreational and Medical Dispensary for sale in Colorado Springs 420property.com/listing/recr…
#420property #cannabis #MSOS
40


Make this make sense -
They gave up 10% of their business w the rec s3 hearing scheduled in less than 20 days
Trlv Msos
80

I just can’t wait in 10 years when true regulations hits current legal markets. We’ll see these dumb ass “mom and pop!” cannabis stores closing because they were just selling illegal trash.
Washington doesn’t give a shit as-long as they get their 37% tax money. $MSOS
152

$MSOS Analyst price targets for tomorrow .~ subirstock.blogspot.com
146


Assume Virginia adult use sales do begin 2027, which off-market is next to join med, and which med is next to join adult use? Medical - I'm going with North Carolina, followed closely by South Carolina. Adult use - West Virginia, just to one-up Virginia and Pennsylvania. $MSOS
1
299

Reg shifts hit hemp, Illinois expands possession. Eyes on $MSOS, watch $TLRY — state rules set the next moves.
Read more: stockalpha.ai/sectors/cannab…
#Cannabis #WeedStocks #MSOs

4
952
BA retweeted

Jun 13
Jun 12

The DOJ has been clear about the timeline and I remain optimistic that full rescheduling will be completed.
2
4
56
4,311
Cuzzie’s Dispensary & Delivery – Licensed New Jersey Cannabis Retail Opportunity 420property.com/listing/cuzz…
#420property #cannabis #MSOS
48
Thomas Roy retweeted

11
1
12
1,575

Sector Rotation Context: Cannabis
I wanted to provide some broader context around the cannabis sector after posting about $VFF.
While I firmly believe charts are the most important tool in investing, fundamentals can provide an additional layer of confluence. They help explain why a chart may be behaving the way it is and strengthen the conviction behind a thesis.
If we zoom out, the cannabis sector has largely been in a bear market since its introduction to public markets.
Like many emerging industries, valuations were initially driven by hype rather than operational performance. Capital flooded into a sector that was still in its infancy, while companies faced significant regulatory uncertainty and enormous capital requirements to establish market share.
The result?
Heavy debt issuance, widespread shareholder dilution, and years of underperformance as businesses attempted to build infrastructure ahead of demand.
Yet beneath the surface, the industry has continued to grow.
Sector Growth Estimates
• 2015 Market Size: $20B–$40B (≈23% CAGR)
• 2025 Market Size: $70B–$102B (≈22–26% CAGR)
• 2030 Projection: $210B–$300B (≈20% CAGR)
Regardless of which dataset you use, the conclusion remains the same: cannabis is growing at a sustained double-digit rate.
At the same time, the regulatory environment is becoming increasingly favorable.
Recent developments include:
• December 2025: Executive action directing completion of the Schedule III review process.
• April 2026: Final DOJ order placing FDA-approved cannabis products into Schedule III, while providing immediate relief from Section 280E tax treatment.
• June 29, 2026: DEA administrative hearing scheduled to evaluate broader Schedule III inclusion for recreational cannabis.
The significance of these developments cannot be overstated.
Improved access to banking services, lower effective tax burdens, stronger free cash flow generation, and reduced financing costs could dramatically alter the economics of the industry.
Considering recreational cannabis represents roughly 65% of total market demand versus 35% for medical use, further regulatory progress would likely expand industry growth projections materially.
Add in a U.S. midterm election cycle, where cannabis reform remains broadly popular with voters, and the policy tailwinds become even more apparent.
From a government's perspective, it's difficult to ignore a rapidly growing industry capable of generating substantial tax revenue while maintaining broad public support.
Now let's connect the fundamentals to the charts.
To me, this remains a sector trading in extreme discount territory despite meaningful improvements in both operating performance and regulatory conditions.
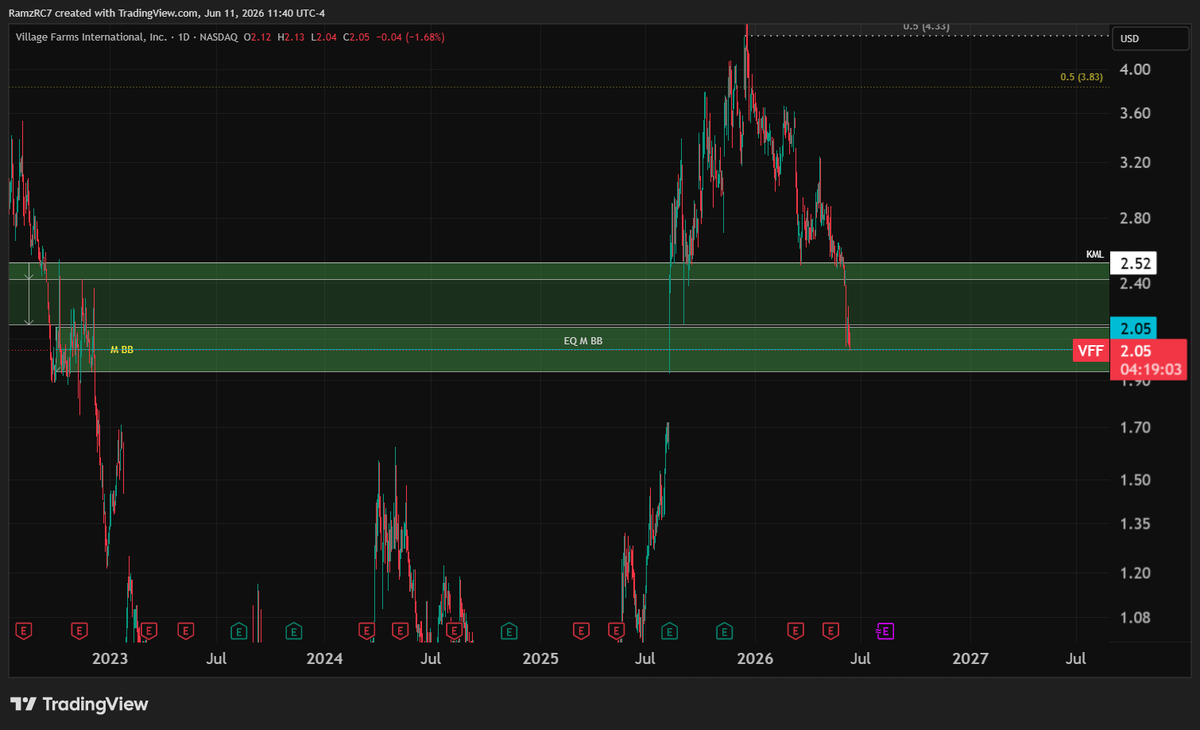
$VFF is a good example.
The company achieved operational profitability in 2025 and has already appreciated more than 800% from its multi-year lows near $0.50.
Yet despite that move, I don't believe the trend has fully matured.
From a higher-timeframe perspective, bullish market structure has already been broken to the upside, suggesting the possibility of a much larger re-rating phase.
Could price revisit the gap near $1.72 on the USD chart?
Absolutely.
A move lower of another 15-20% remains possible.
However, when I compare sector-relative charts, I see stronger evidence supporting a developing reversal than a continuation lower.
For those who follow ratio analysis, take a look at:
• MSOS / XLY
• VFF / VEGI
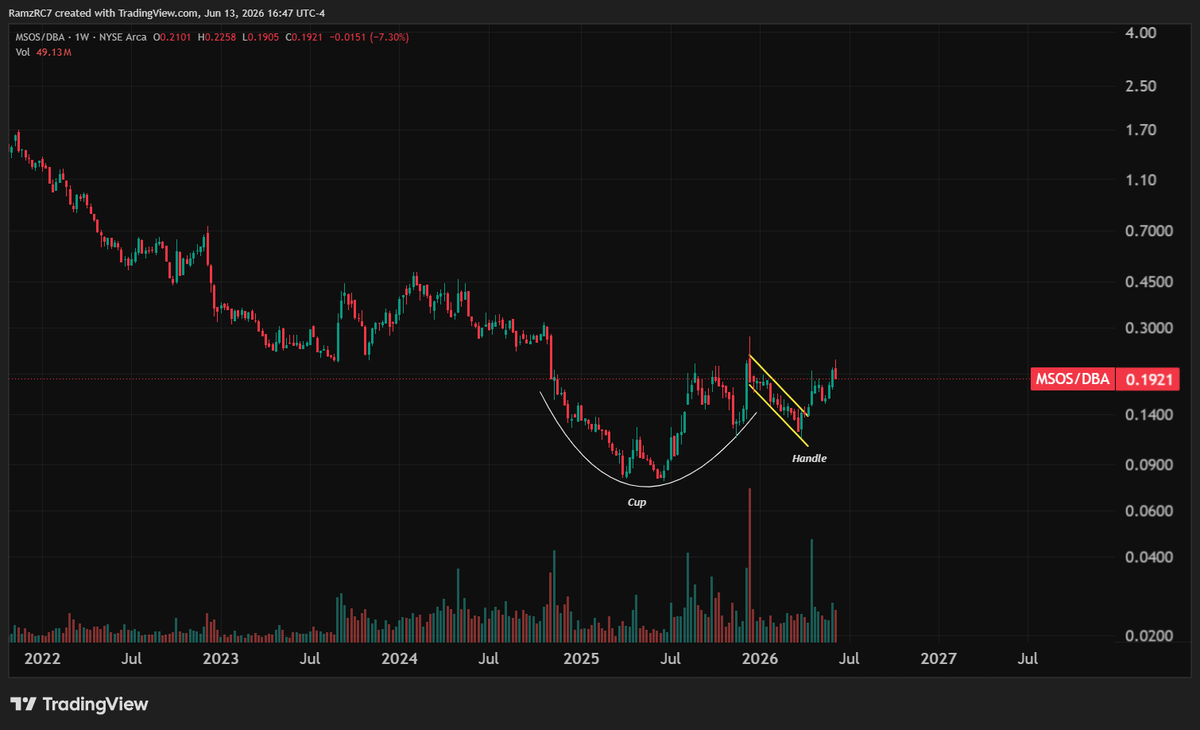
Both are retesting significant break-of-structure levels that, in my view, offer meaningful intermarket confluence. On these charts, we've already filled gaps🤔 I've also attached a chart comparing the Cannabis sector to DBA (primary agriculture index) with a clear breakout structure.
Most investors analyze assets in isolation.
I prefer to analyze them relative to competing sectors, capital flows, and broader market positioning.
That's where the edge often exists.
My Position
NFA, but I've continued scaling into $VFF around current prices within my accumulation zone.
The risk/reward remains attractive in my view.
Ironically, I think the open gap below is creating analysis paralysis for many traders. While waiting for a perfect entry may feel safer psychologically, it can actually increase risk from a trade management perspective.
An entry near $1.72 would likely require a much wider stop below the $1.30 area, creating a less efficient risk profile.
For me, the thesis remains straightforward:
A sector that has spent years correcting excess speculation is now showing improving fundamentals, favorable regulatory momentum, positive operating results, and emerging higher-timeframe technical strength.
That's the type of asymmetry I look for.
One additional point worth mentioning: this is not my first position in VFF.
I accumulated shares near the 2024-2025 lows around $0.55 and exited after the stock appreciated more than 800%.
I mention this not to highlight the outcome, but because it provides a useful reference point. The same framework that identified value when sentiment was overwhelmingly bearish is beginning to identify value again.
The setup is not identical, but the characteristics are familiar: a deeply discounted sector, improving fundamentals, positive regulatory momentum, and technical evidence that capital may be rotating back into the space.

Jun 11

$VFF (Updated):
I made a mistake in highlighting a W level when there is a more significant M level. M BB EQ is at $2.05. Bullish invalidation with a D close below the green box (~$1.94).
p.s. I really like this level for HTF bullish continuation as it has gap filled on other ratio charts for VFF. Let's see how it plays out.
5
238

Makes you wonder if @GlassHouseBR , @kylekazanceo and @grahamfarrar put up with Cohodes because they have to. Are Cohodes and his investor cohort what’s keeping them afloat? GLASF is the 4th largest holding in MSOS but seems oddly disconnected to MSOS volatility. They announce a major shelf offering to issue up to $100m in new stock, a dilutive event that should have hit the share price but it was up on that news alone, trading few shares on the day. Cohodes and his cabal must own a very large share of the float.
6
173