
Jun 8
The 7 JPA Relationship Patterns Every Spring Boot Developer Should Know
Learn when to use OneToOne, OneToMany, ManyToMany, composite keys, and join entities through a production-ready Spring Boot project.
🔗 medium.com/@ivangfr/the-7-jp…
#SpringBoot #JPA #Java #BackendDev #Hibernate

33

Jun 6
Completed the Third Module by Coding Shuttle @sudoanuj which is based on the Relationship mapping between the tables, how JDBC and Spring Data JPA helps to map the POJO with the database. Learned Cascading and many other important concepts like pagination and projection. The homework assignment was heavily focused on the relationship mappings.
The first homework assignment was related to subject, student, department, admission record and professor which is basically a college management system where the ERD diagram was provided by @sudoanuj which made things easier. The tables have different relationships with each other. Some tables have OneToOne relationship and some have ManyToMany.
Let's Understand the annotations with examples:
1. OneToOne: A Student can have only one Admission record. So that's why a OneToOne relationship is established between these two tables.
2. OneToMany: A Professor can teach more than one subject. So there's a OneToMany relationship established between these two tables and vice versa for ManyToOne.
3. ManyToMany: Many students can be taught by many professors.
mappedBy is used to define the non-owning (inverse) side of a bidirectional entity relationship. It is present on the inverse side of the relationship, telling JPA that the other side owns the foreign key.
JsonIgnore is a Jackson library annotation used to prevent specific entity fields or relationships from being serialized into JSON. It is commonly used to hide sensitive data like passwords or to break infinite recursion loops caused by bidirectional database relationships. Heavily used in ManyToMany relationships.
JoinTable with JoinColumn defines the owning side of a ManyToMany relationship in JPA. It explicitly defines the intermediate join table and the foreign key columns used to establish the relationship between two database tables.
The second homework project was an Author and Book management system where we had to map authors and the books they published. There are only two tables in this project with a ManyToMany relationship between authors and books — because one author can write many books and one book can have many authors.
The main challenge was implementing all these APIs:
Create a new book and author
Retrieve a list of all books and authors
Retrieve a single book or author by ID
Update book and author details
Delete a book or author
Find books by title
Find books published after a certain date
Find authors by name
Find all books by a specific author
Some APIs required custom query methods in the Repository layer using Spring Data JPA's method naming conventions.
Definitely a solid project! Learned a lot in this module. Will dive more in-depth into topics like Cascading and N 1 query optimization.
#Java #SpringBoot #SpringDataJPA #BackendDevelopment #LearningInPublic #JavaDeveloper #CodingJourney
1
2
114

Apr 4
Day 6/45 | Post 1/3 | Job Challenge 🎯
today's plan. putting it here so I actually do it.
Hibernate
— what it is project setup
— saving, fetching, updating data
— relationships: OneToOne, OneToMany, ManyToMany
— Eager vs Lazy fetch
— HQL basics
Spring
— IoC and Dependency Injection
— Spring vs Spring Boot
— Autowiring
SQL
— SELECT with WHERE and JOIN
— GROUP BY HAVING
— subqueries
— indexes
— aggregate functions
let's see how much of this actually gets done by tonight.
1
2
94

Apr 3
The best way to map the JPA and Hibernate ManyToMany relationship
vladmihalcea.com/the-best-wa…
2
17
1,276

Mar 12
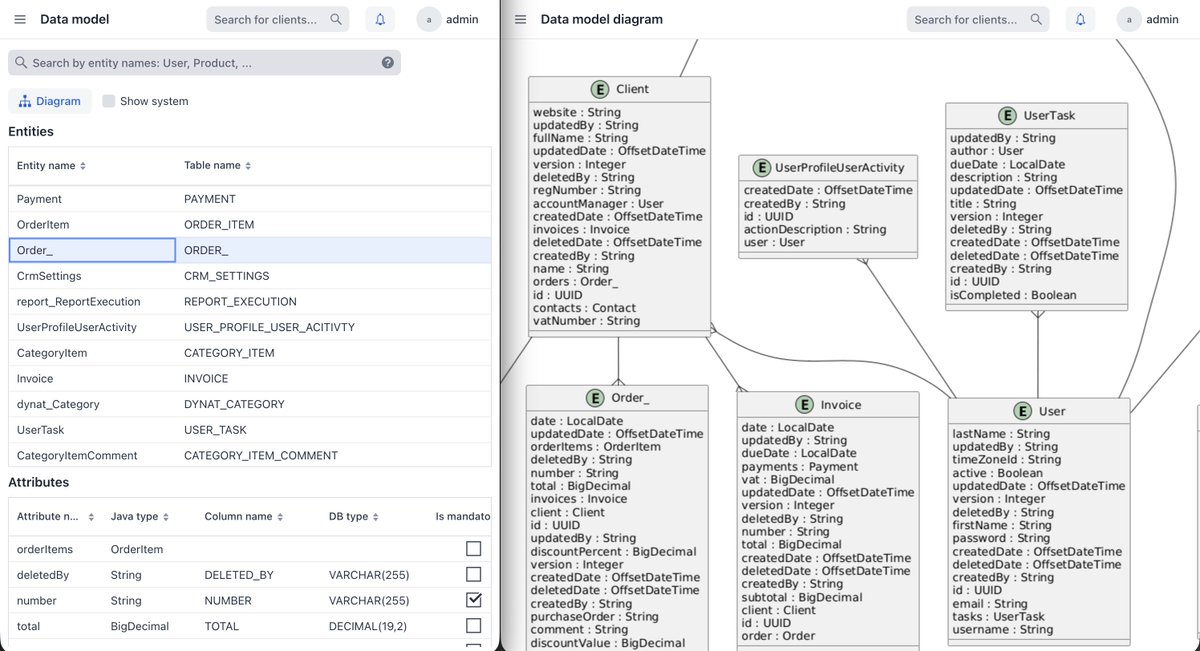
📍Inside Jmix 2.8.
Data Model Visualization
When you’re writing a report and thinking: “Okay… but how exactly are these entities related?”
When working with Reports, you often need to look at the ER model:
📍what relationships exist?
📍where it’s OneToMany?
📍where it suddenly turns out to be ManyToMany?
What do you usually have to do to see the necessary information about the data model?
1) Open pgAdmin or DBeaver (assuming they’re already installed).
2) Run the required queries or search for the information in the UI.
While looking at one thing, you forget about another: you switch back to the application or the code, lose focus, lose context…🔄
Starting with Jmix 2.8, there’s a more convenient way with the DataTools add-on.
Data Model Visualization ✨
The DataTools add-on now makes it possible to see all entities and their attributes on a single screen, as well as generate a detailed ER-diagram.
Just a couple of clicks — and all the information you need is right inside your application.
No unnecessary switching or extra tools 👌🏼
6
131

Feb 27
Yesterday's update :
Day 12 of Learning and improving :
- Solved DSA Problem
- Meditation
- Learnt about OneToOne, ManyToOne, ManyToMany, OneToMany mapping in Spring
- Learnt about Cascading in Spring JPA
4
8
126

1 Dec 2025
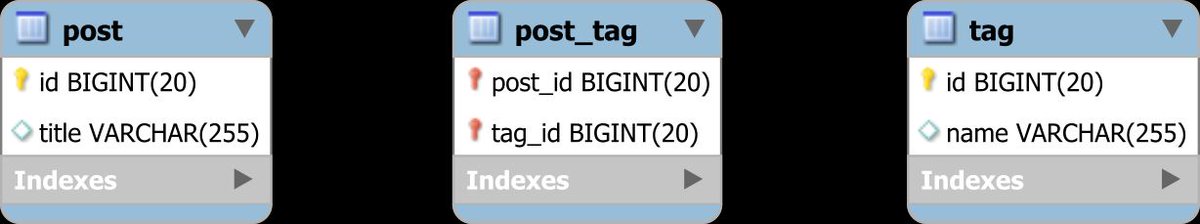
Grouping collections with @ApacheGroovy to reveal many-to-many relationships:
groovy.apache.org/blog/fruit…
#groovylang #manyToMany #eclipseCollections #jdkCollections

ALT grouping jdk and eclipse fruity collections with groovy
1
5
6
369
4 Nov 2025
The best way to map the JPA and Hibernate ManyToMany relationship
vladmihalcea.com/the-best-wa…

22
2,070

20 Oct 2025
Django ORM tip that saved me hours:
Use select_related() for ForeignKey
Use prefetch_related() for ManyToMany
Turned 100 queries into 2. Performance goes brrrrr.
3
87

23 Sep 2025
I solved this problem using EntityGraphs for ManyToOne and OneToOne and set ManyToMany and OneToOne to Fetch(FetchMode.SELECT).
This helped me to solve major performance issues.
3
83

7 Aug 2025
Spring Boot stuff I got better at today-
✅ Finally understood why equals() & hashCode() matter in JPA i.e. helps avoid weird bugs with Sets and Hibernate identity
✅ Got more comfortable with JPA relationships eg: OneToMany
ManyToMany
#LearnInPublic
#SpringBoot #Java
3
94

6 Aug 2025
Today I completed the serializers part in Django REST Framework! 🚀
✅ Nested serializers with ForeignKey & ManyToMany fields
✅ Custom & advanced serializer validations
Learned how to handle complex data structures smoothly 🔥
#Django #BackendDevelopment #DRF

5
188

24 Jul 2025
[Articles] Virtual Tables and Django Foreignkeys
Disabling default database constraints with db_constraint=False on ForeignKey and ManyToMany fields ensures Django unmanaged virtual tables operate correctly in SQLite temp schemas. #djangonews
paultraylor.net/blog/2025/vi…
3
203

21 Jul 2025
How do we join across a ManyToMany relation with that nasty join table in the center? By ignoring it! It’s all properties & objects symfonycasts.com/screencast/…
1
10
630
18 Jul 2025
Even though our ManyToMany is gone, what we have is still basically a many to many from ship to droids. Let’s start to “hide” the join entity “implementation” detail symfonycasts.com/screencast/…
5
549
16 Jul 2025
Our goal: add extra fields to the ManyToMany join table, but since that’s not possible, we’ll replicate the db relation with a join entity & two ManyToOne relations symfonycasts.com/screencast/…
1
10
848

11 Jul 2025
Struggling with slow Django queries? 🚀 Fixing N 1 issues with prefetch_related for ManyToMany/Reverse FKs and annotate for aggregates in one call.
#Django #DjangoTips #pythonlearning

2
1
6
119
10 Jul 2025
Let’s get into rendering a ManyToMany: because Starship holds a collection of Droid objects, it’s delightfully simple we’ll add a “smart” method to Starship symfonycasts.com/screencast/…
1
8
554
8 Jul 2025
Each starship deserves many droids & each droid can serve on many starships. Hey! That’s a ManyToMany relation! Once again, Doctrine let’s us think about *objects* instead of db details. But what it does behind the scenes on the db is crazy-cool! symfonycasts.com/screencast/…
1
6
533

4 Jul 2025
#Day81 of #100DaysOfCode
Today I dived deeper into Django:
🔗 Learned about relationships between models (OneToOne, ManyToOne, ManyToMany)
⚙️ Explored ORM and its benefits
🛠️ Practiced CRUD operations using Django shell
#100DaysOfCode #Django #Python #DevJourney
3
60