
7 Nov 2025
#30DayMapChallenge Day 7: Accessibility
Today's tip: calculate access from a location in one line of code with `mb_isochrone()` in the mapboxapi R package.
Then, visualize creatively with a comparison slider in mapgl.
Learn how: walker-data.com/posts/time-a…
8
65
2,546
3 Sep 2025
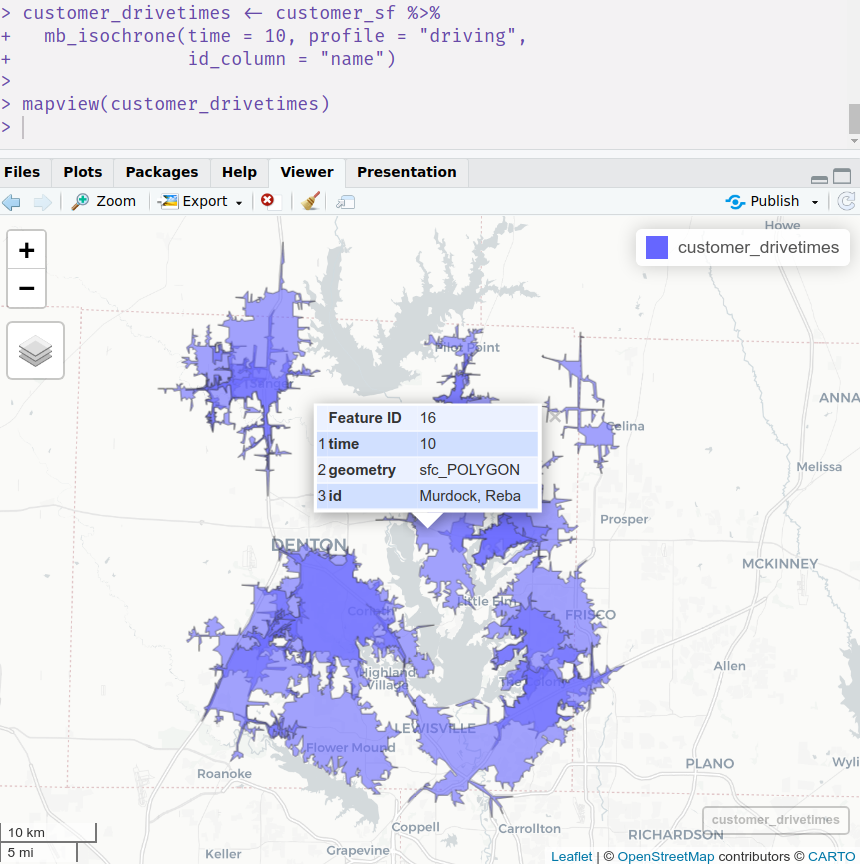
This example shows 5, 10, and 15-minute drive-time areas around UT Southwestern Hospital in Dallas.
To set this up, consider the R {mapboxapi} and {mapgl} packages, which are purpose-built to help you put these analyses together with minimal code.
1
10
1,038
25 Aug 2025
I also released my book online in 2022, which helps explain those spikes.
However, tigris is on track for its second-best year ever, and tidycensus and mapboxapi still look solid.
If R is "in decline" as some have suggested on social media, I'm just not seeing it.
1
5
345

21 Aug 2025
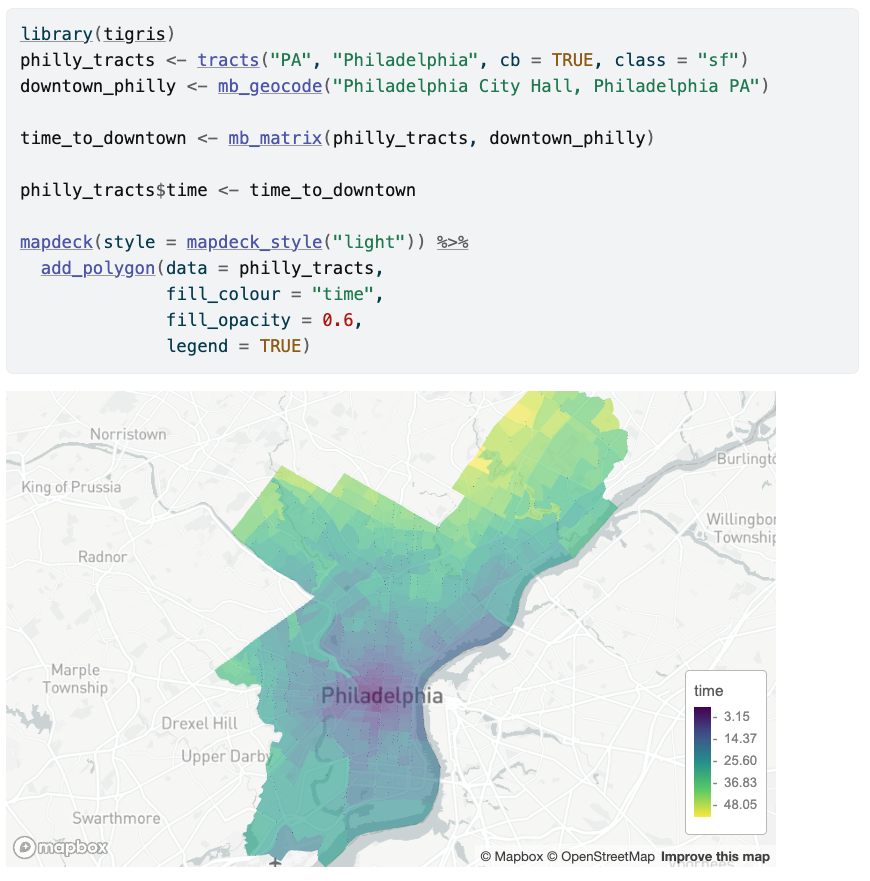
Travel-time matrices are a powerful tool for improving decision-making in areas like emergency response, logistics, and transportation planning. With the mb_matrix() function from the mapboxapi package in R, it’s easier than ever to build these insights quickly and effectively.
Thank you @kyle_e_walker for sharing this valuable resource.
#RStats #DataScience #GIS #Transportation
20 Aug 2025

Travel-time matrices have applications across emergency services, supply chain optimization, site selection, transportation planning, and more.
The `mb_matrix()` function in my mapboxapi #rstats package can get you up and running quickly: walker-data.com/mapboxapi/ar…
15
82
4,691
20 Aug 2025
However, mapboxapi is not the only game in town. I also use:
• The Google Distance API via the googleway package: symbolixau.github.io/googlew…
• The R5 routing engine via the r5r R package: ipeagit.github.io/r5r/articl…
• The Valhalla routing engine: valhalla.github.io/valhalla/…
1
1
3
197
20 Aug 2025
Travel-time matrices have applications across emergency services, supply chain optimization, site selection, transportation planning, and more.
The `mb_matrix()` function in my mapboxapi #rstats package can get you up and running quickly: walker-data.com/mapboxapi/ar…
1
27
189
12,956
19 Aug 2025
I've had a lot of success with `mb_matrix()` in mapboxapi: walker-data.com/mapboxapi/ar…. However if you have a lot of travel-times to calculate, it can get expensive. In that case, a tool like Valhalla may work: github.com/valhalla/valhalla
3
144
19 Aug 2025
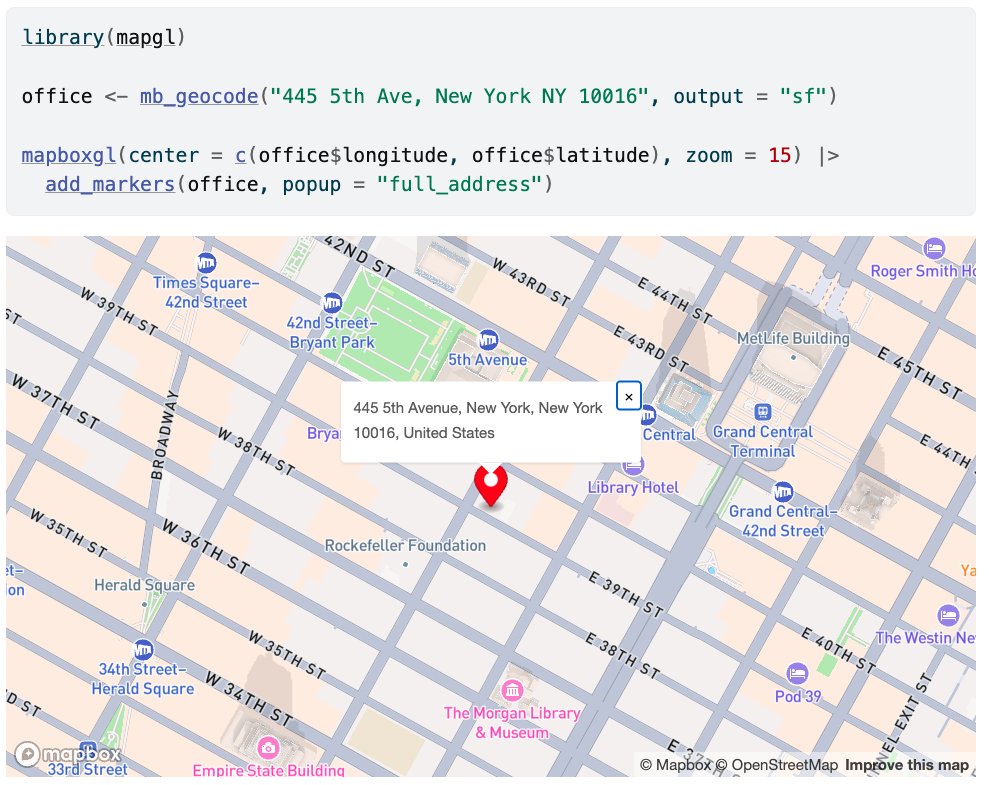
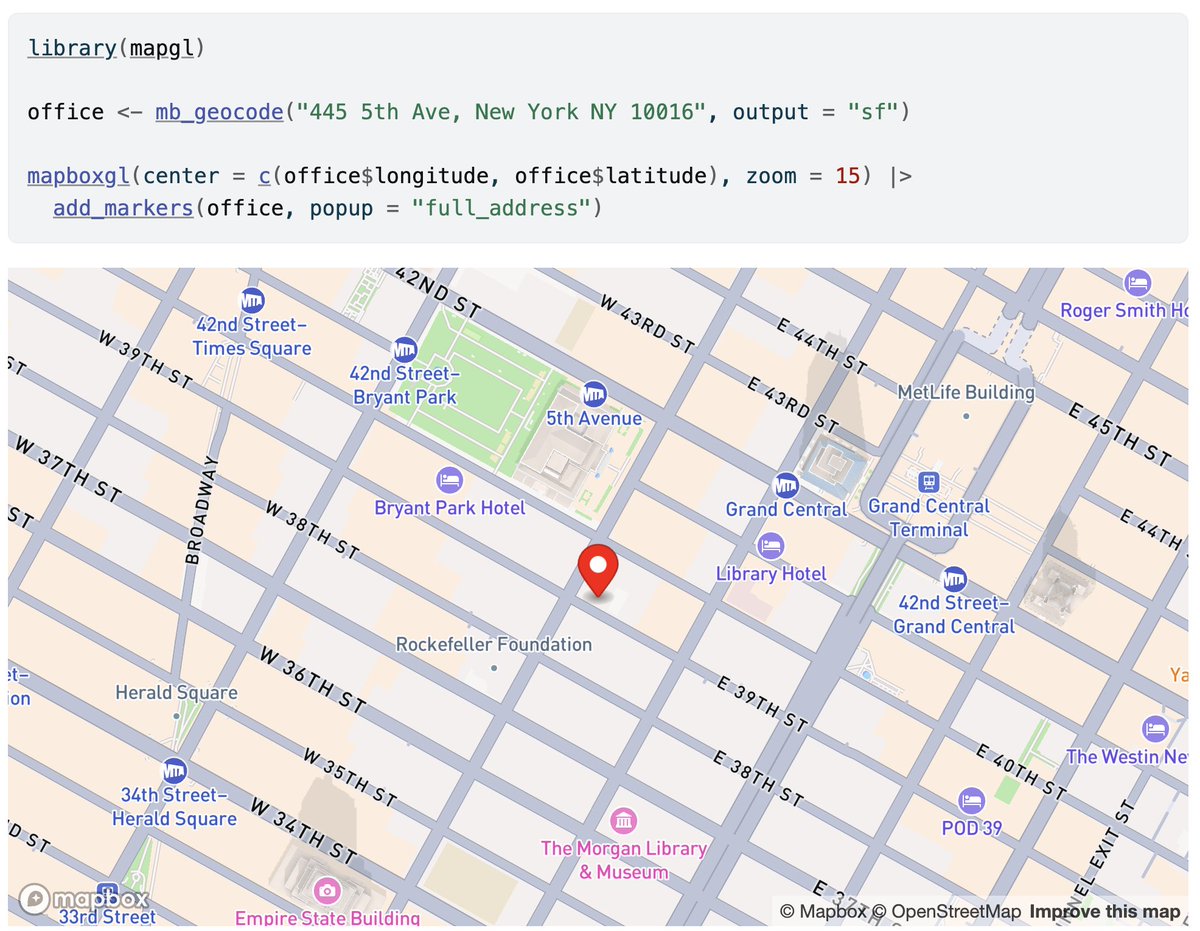
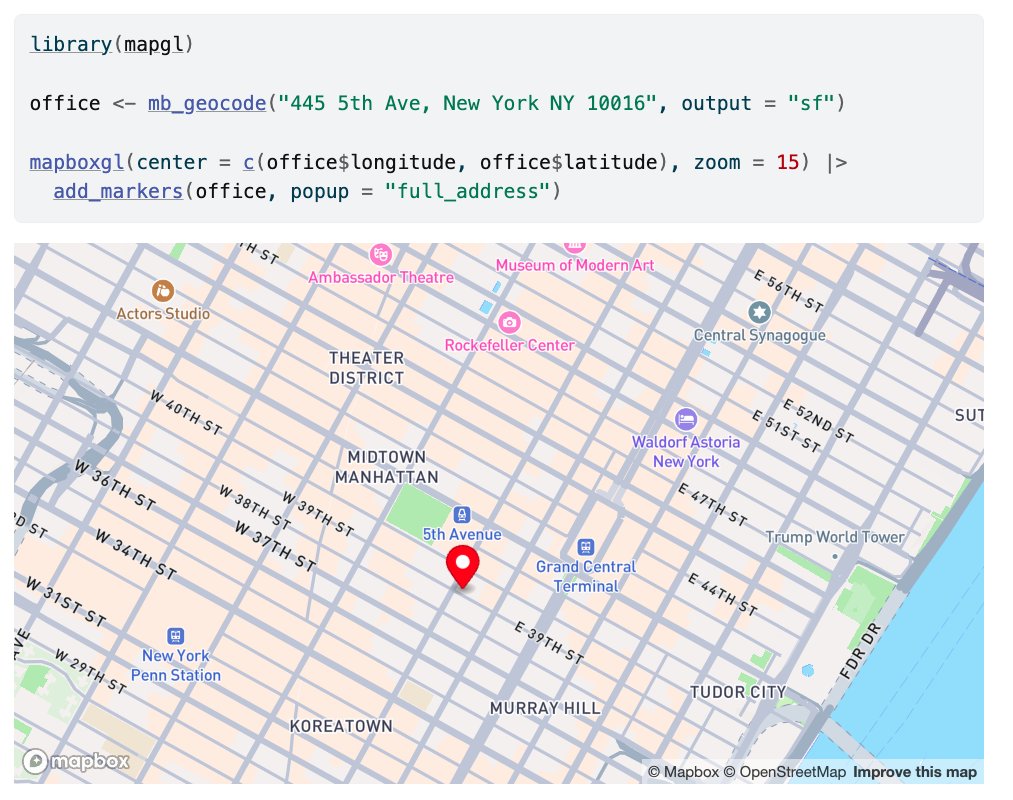
There are a lot of options out there for geocoding.
I'm personally fond of @Mapbox's solution, which gets you 100k free geocodes per month.
So much so that I wrote an #rstats wrapper for it, which you can use in the {mapboxapi} package.
Learn how: walker-data.com/mapboxapi/ar…
16
115
9,358

29 Jul 2025
我不这么看,机会其实一直都是有的。这个市场敏锐度有关系。而搞技术的人往往缺这个,而且搞技术的还经常会说一句,这个别人都做了,我做这个还有什么意义?
我举个例子,有款app功能非常简单就是显示房产在售信息, 付费功能是显示房子周围的高压线信息(公开信息) ,拿mapboxapi做的,一个dev 一个月横竖都能搞定。
技术不难,但是背后的商业逻辑,以及痛点的捕捉是很难的。
还有,非常简单的噪音分贝检测app,功能及其简单,排在前面几个是付费的。你会考虑去做么?
技术从来只是工具,以前是汉阳造,现在是激光枪,但是商业逻辑才是核心。

11
33
275
137,519
9 May 2025
🌎 In the mapboxapi R package, the function `mb_isochrone()` helps you calculate isochrones with some extra features to make your life easier. For example, `mb_isochrone()` is integrated with Mapbox's geocoder so you can create isochrones directly from addresses!
1
2
131
8 May 2025
There are a lot of options out there for geocoding.
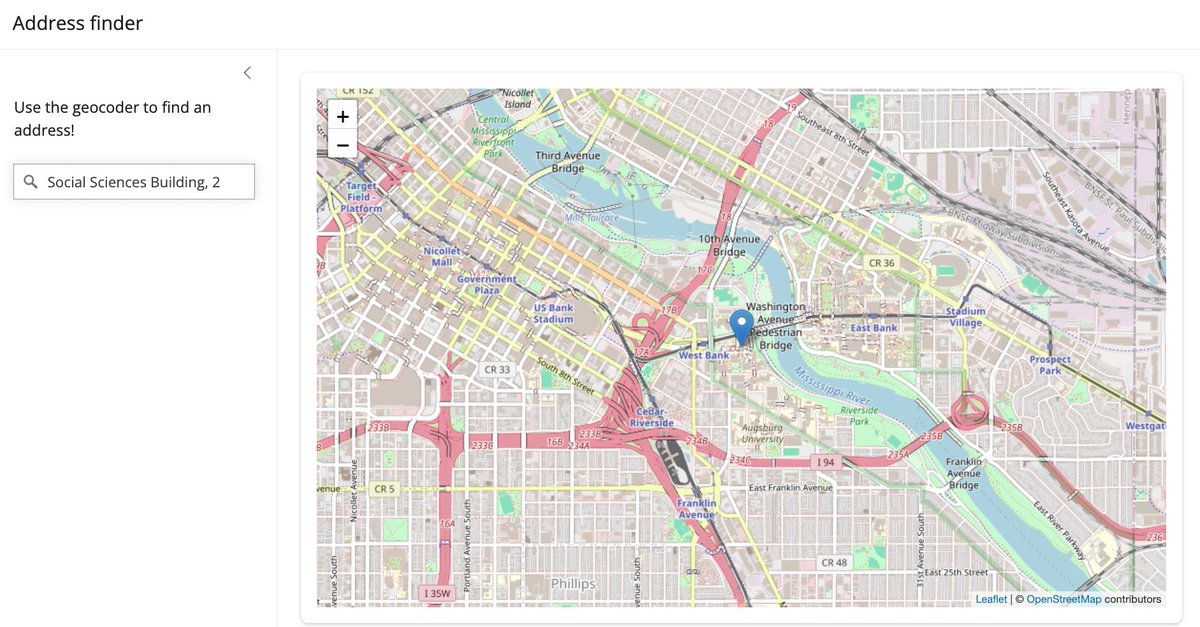
Check out my interface to the Mapbox geocoder in the R {mapboxapi} package. It includes:
🌎 Forward and reverse geocoding;
🌎 Batch geocoding with 100k free queries / month;
🌎 A Shiny input with autocomplete for your apps!
1
6
41
1,911
1 Dec 2024
There are a lot of options out there for geocoding.
I'm personally fond of Mapbox's solution, which gets you 100k free geocodes per month.
So much so that I wrote an #rstats wrapper for it, which you can use in the {mapboxapi} package.
Learn how here: walker-data.com/mapboxapi/ar…

1
12
80
4,622
12 Nov 2024
... or we can get more sophisticated with other packages like mapboxapi, which seamlessly creates travel-time isochrones from your data
1
5
481
14 Oct 2024
There are a lot of resources you can use for geocoding.
But I've been really happy with the interface to the @Mapbox geocoder I built in the {mapboxapi} #rstats pkg.
It supports reverse & batch geocoding along with a Shiny input widget!
Learn more: walker-data.com/mapboxapi/ar…

10
66
2,932
14 Oct 2024
Want to use the @Mapbox Tiling Service with your spatial data pipelines in #rstats?
You can do it with the {mapboxapi} #rstats package .
**A warning**: running this tutorial *may* incur charges to your Mapbox account!
Check out the updated vignette: walker-data.com/mapboxapi/ar…
12
79
4,078

28 Sep 2024
WEBの地図上で動くスゴロク作れた!
昨日から行っているMapboxAPIでスゴロク作れちゃいました。結構面白いです!
観光名所の説明もしてくれる。
地理の勉強とかにもなりそう。
3
3
75
11,070
25 Sep 2024
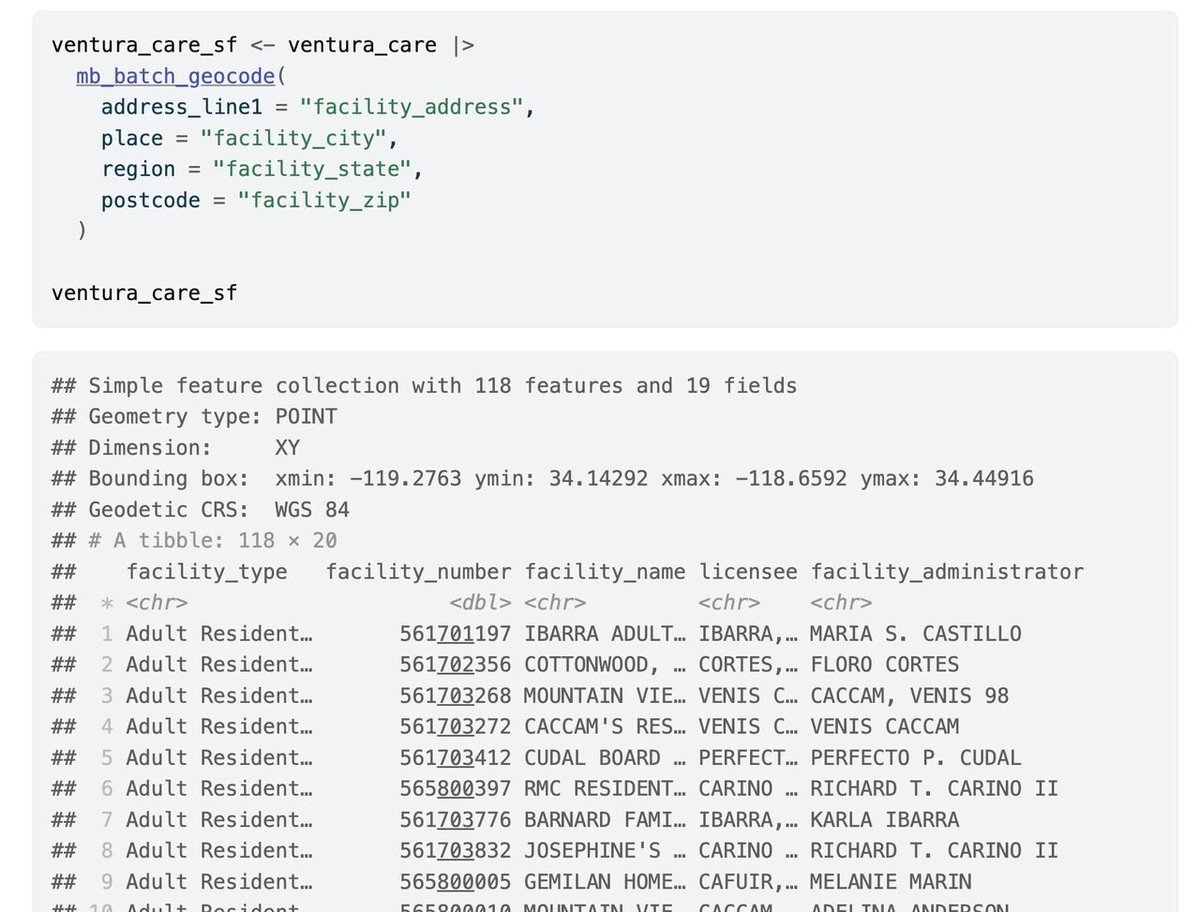
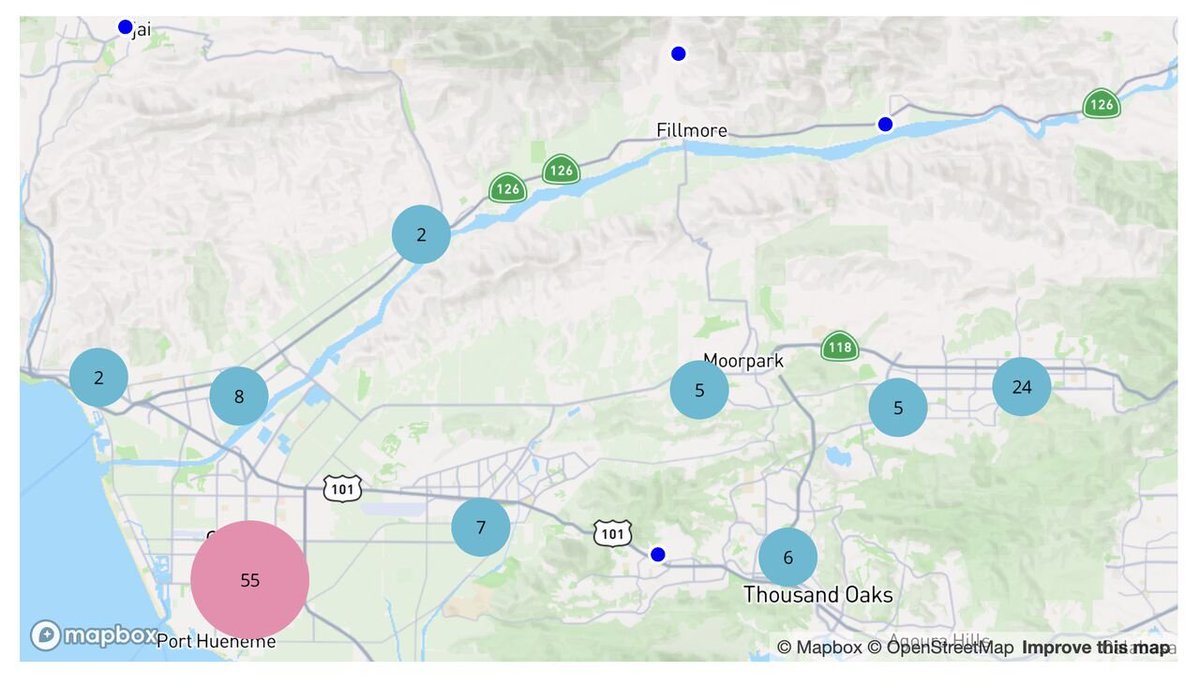
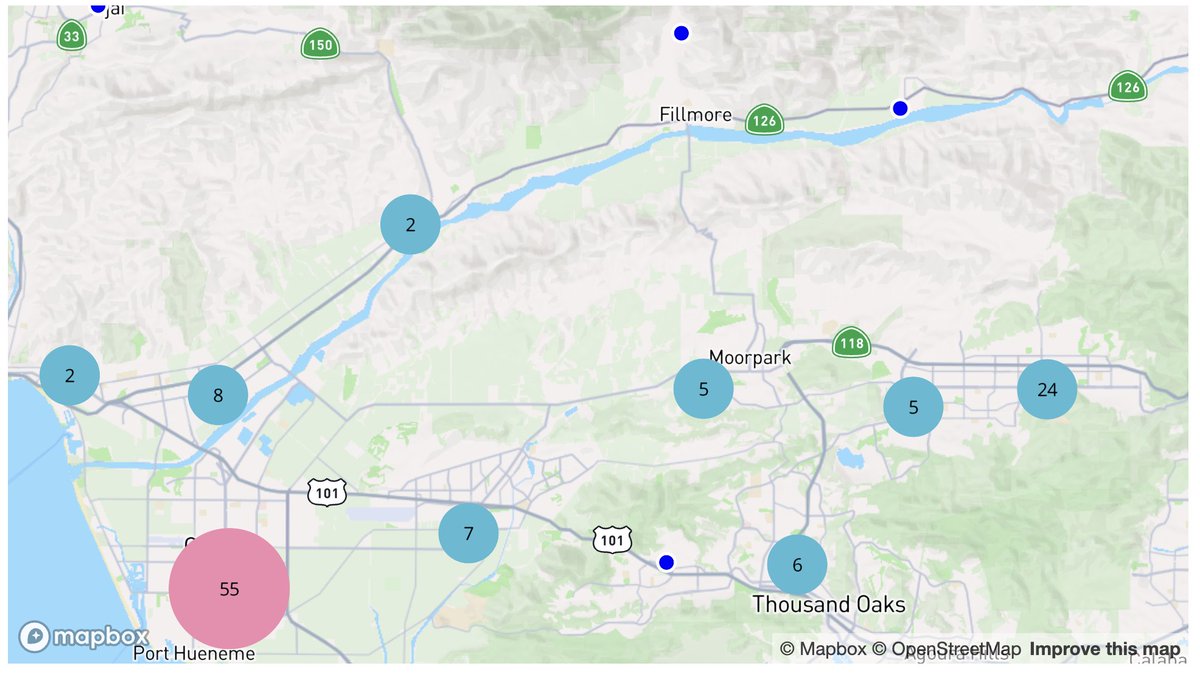
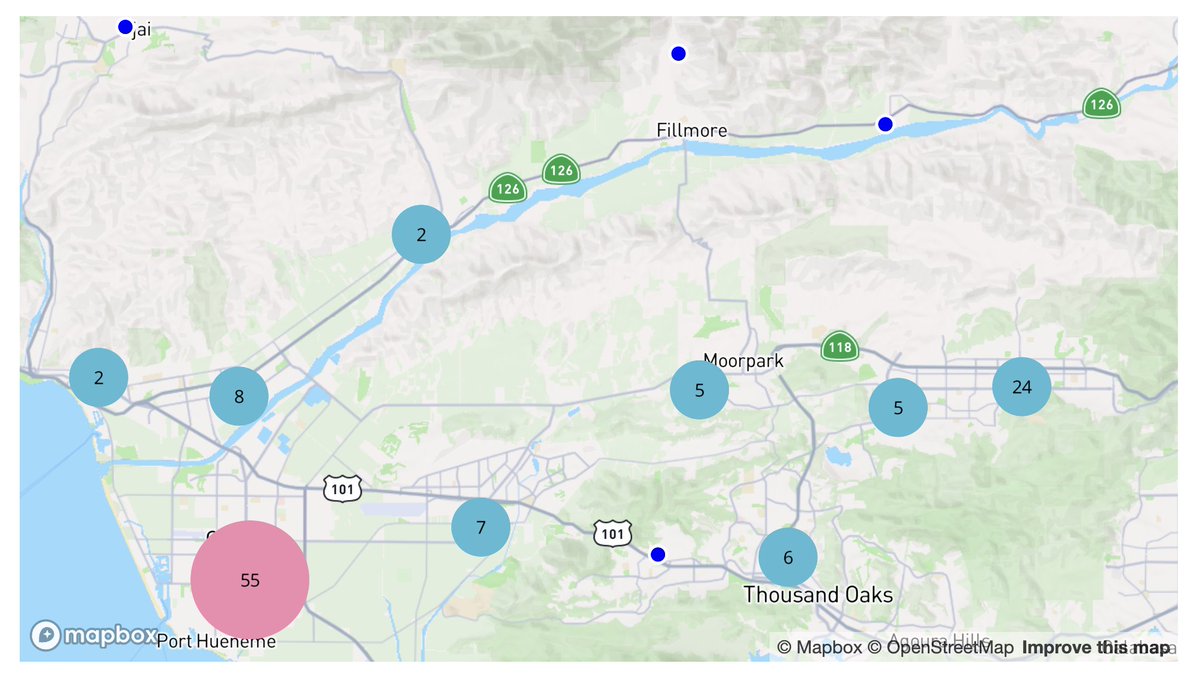
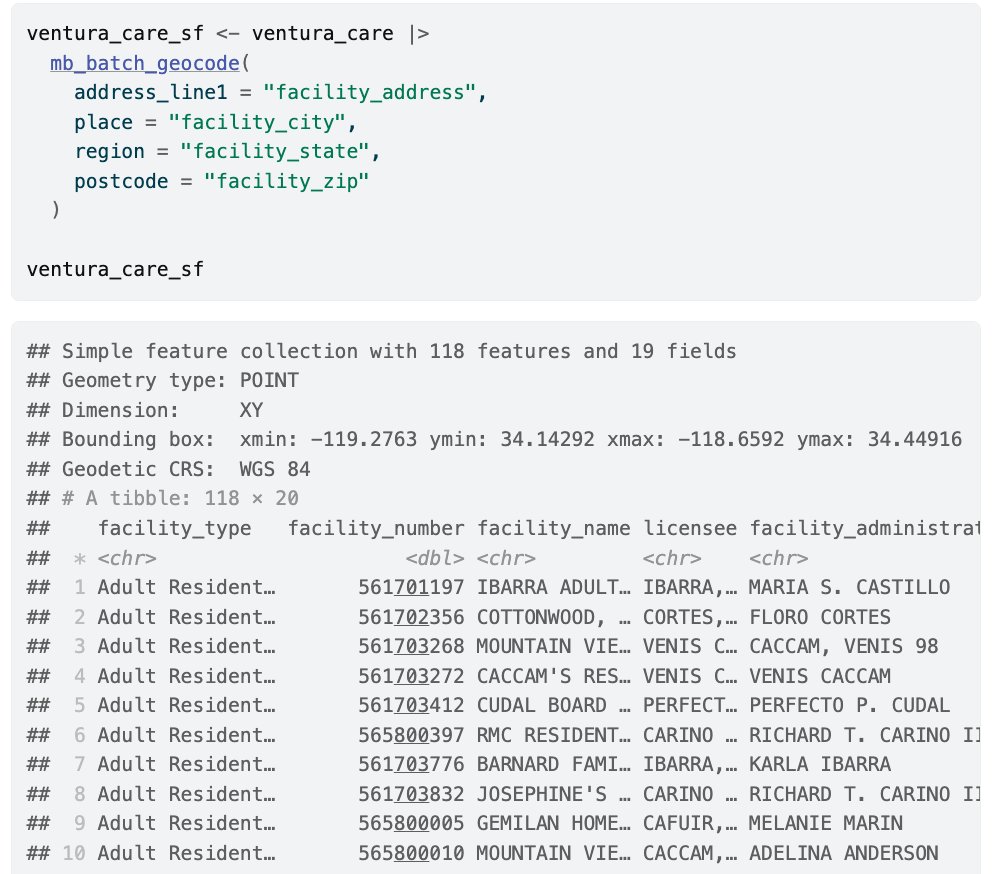
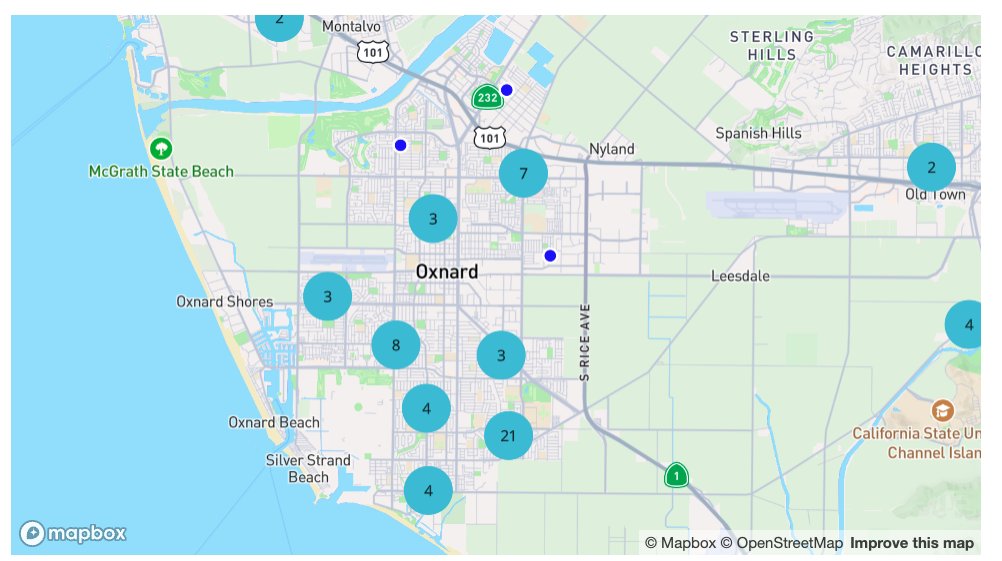
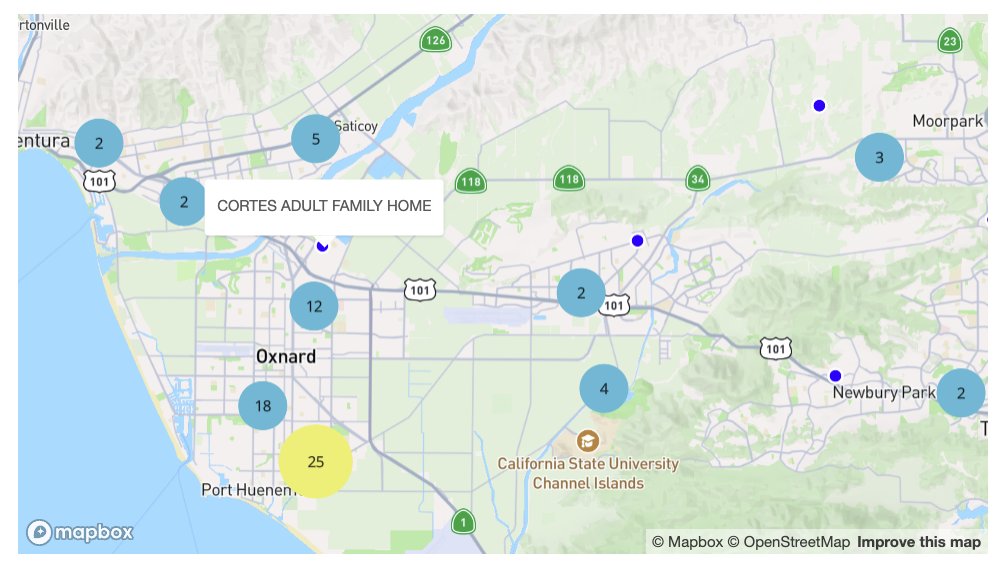
Check out this applied visualization workflow from the {mapboxapi} docs.
Load and clean a CSV with tidyverse tools, batch geocode addresses with the @Mapbox API, then visualize the results with {mapgl} as clustered circles.
All in #rstats.
Learn how: walker-data.com/mapboxapi/ar…
4
35
2,766
25 Sep 2024
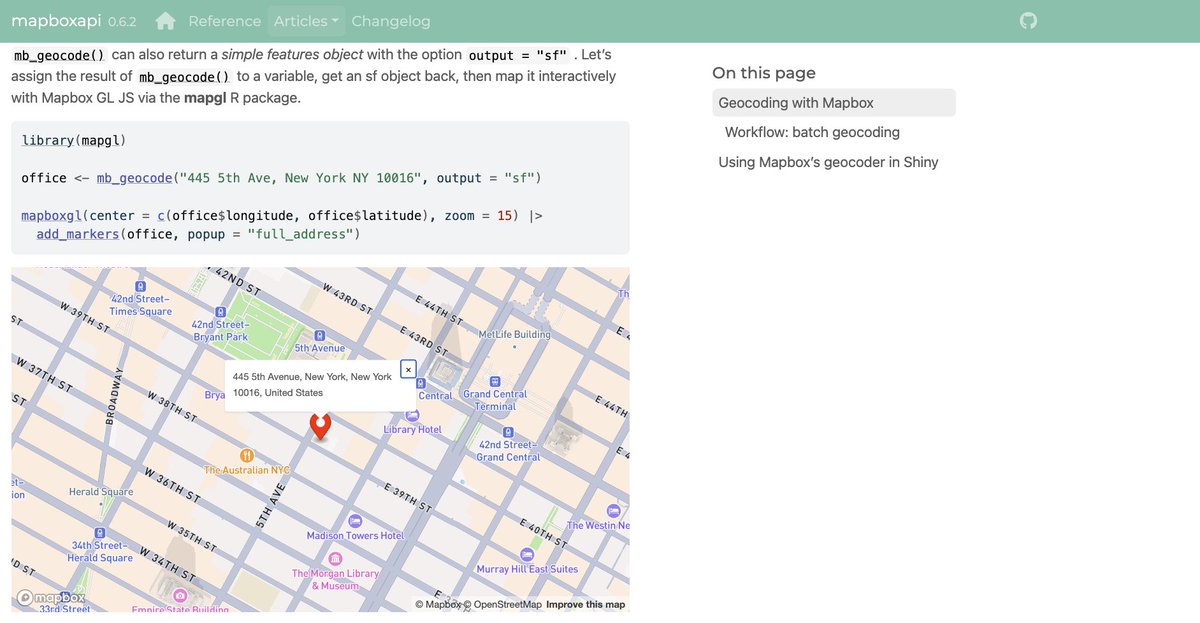
I just published a refreshed version of the documentation for {mapboxapi}, my #rstats package for working with @Mapbox web services APIs.
Check out the new geocoding vignette, which covers topics like batch geocoding and a geocoder as a Shiny input!
walker-data.com/mapboxapi/ar…

14
60
3,218

14 Aug 2024
#rstats #gis friends: has anybody been able to get Mapbox Tilesets created w tippecanoe to load as a layer with @kyle_e_walker's {mapgl}? I can't get add_vector_layer to work. I've noticed the vignette in {mapboxapi} isn't pulling in layers as well (walker-data.com/mapboxapi/ar…)
1
178