
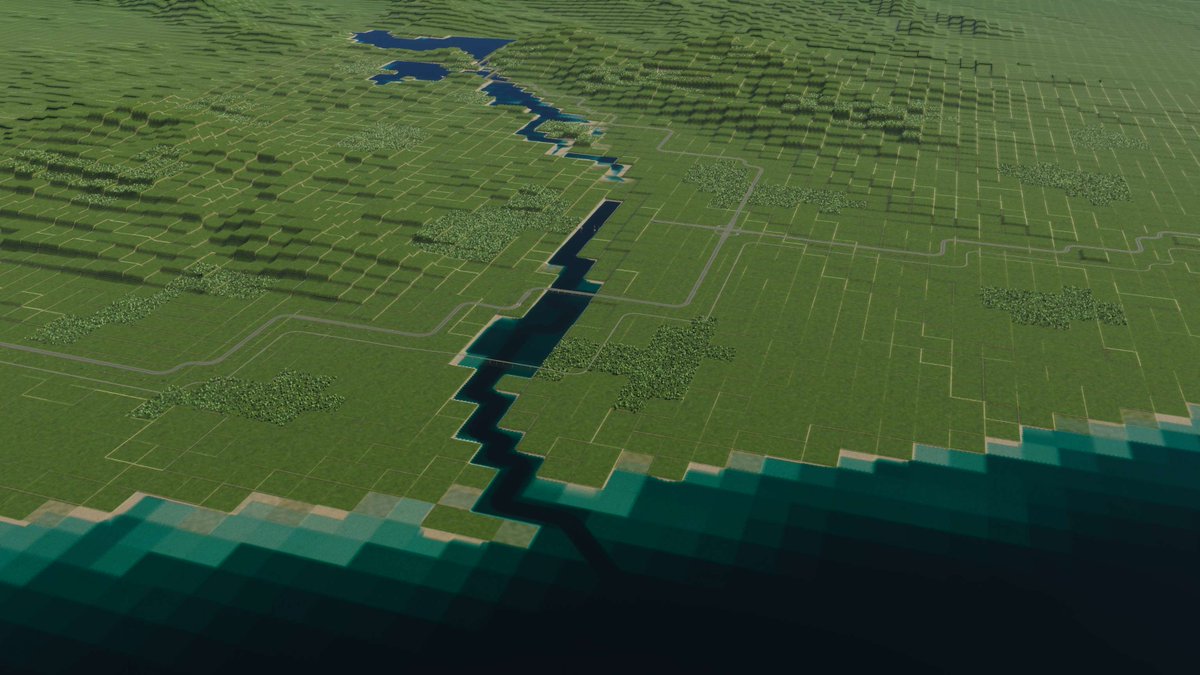
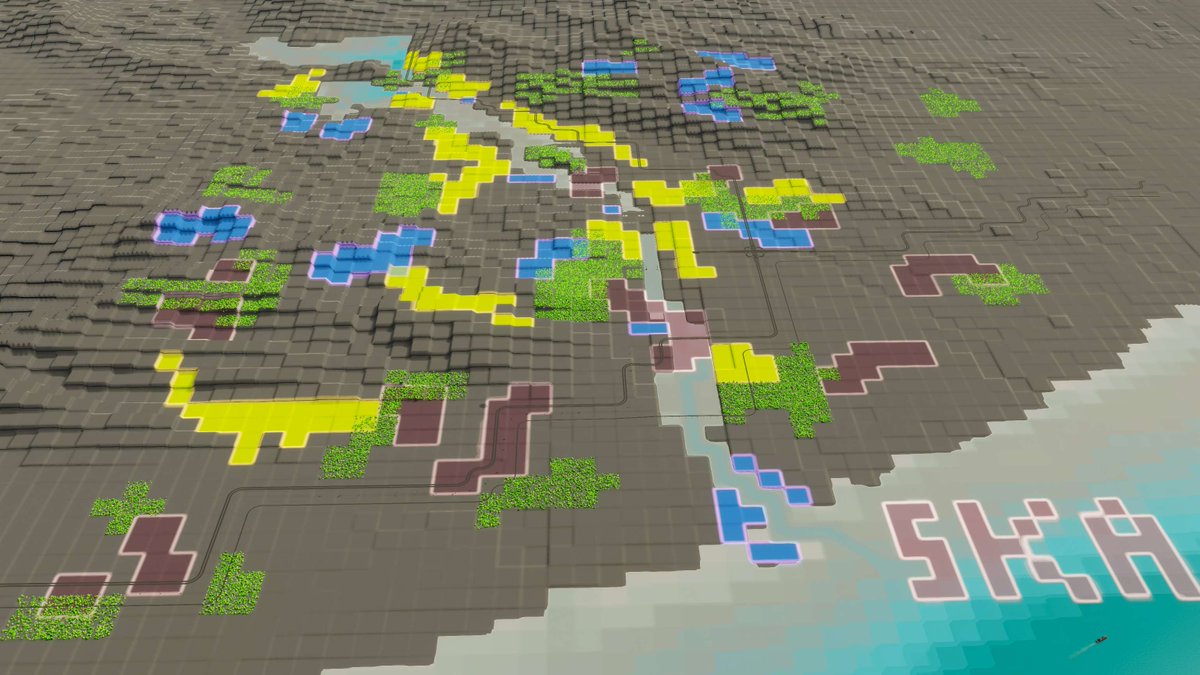
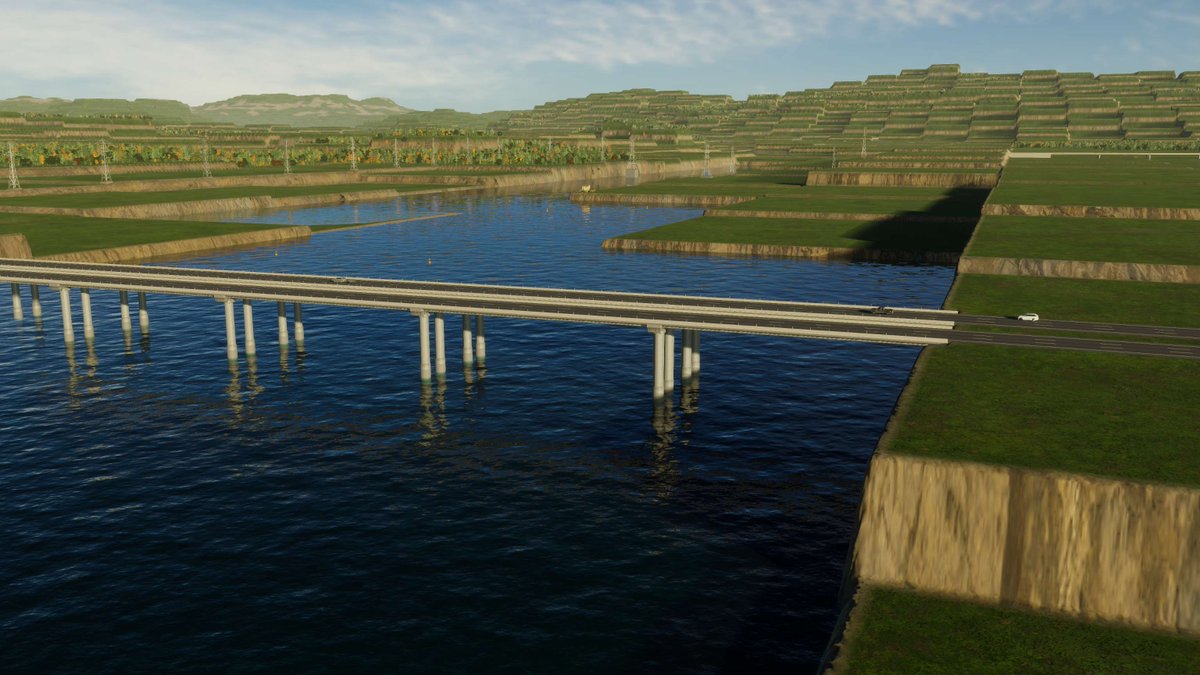
A most angular Map of the Month, discover Gridding an der Kante by FrediVonDue!
#citiesskylines #citiesskylines2 #mapofthemonth

9
6
191
20,840

1 Dec 2025
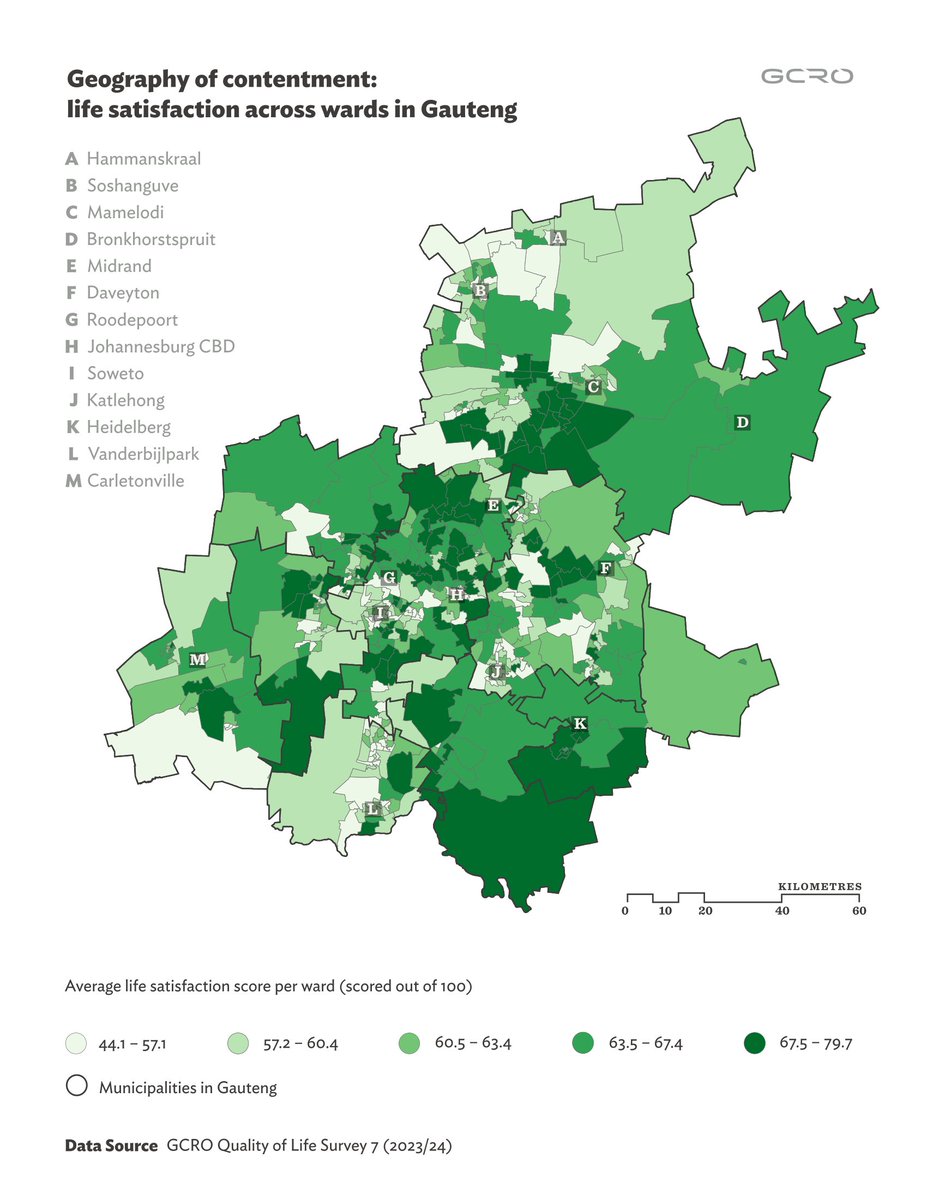
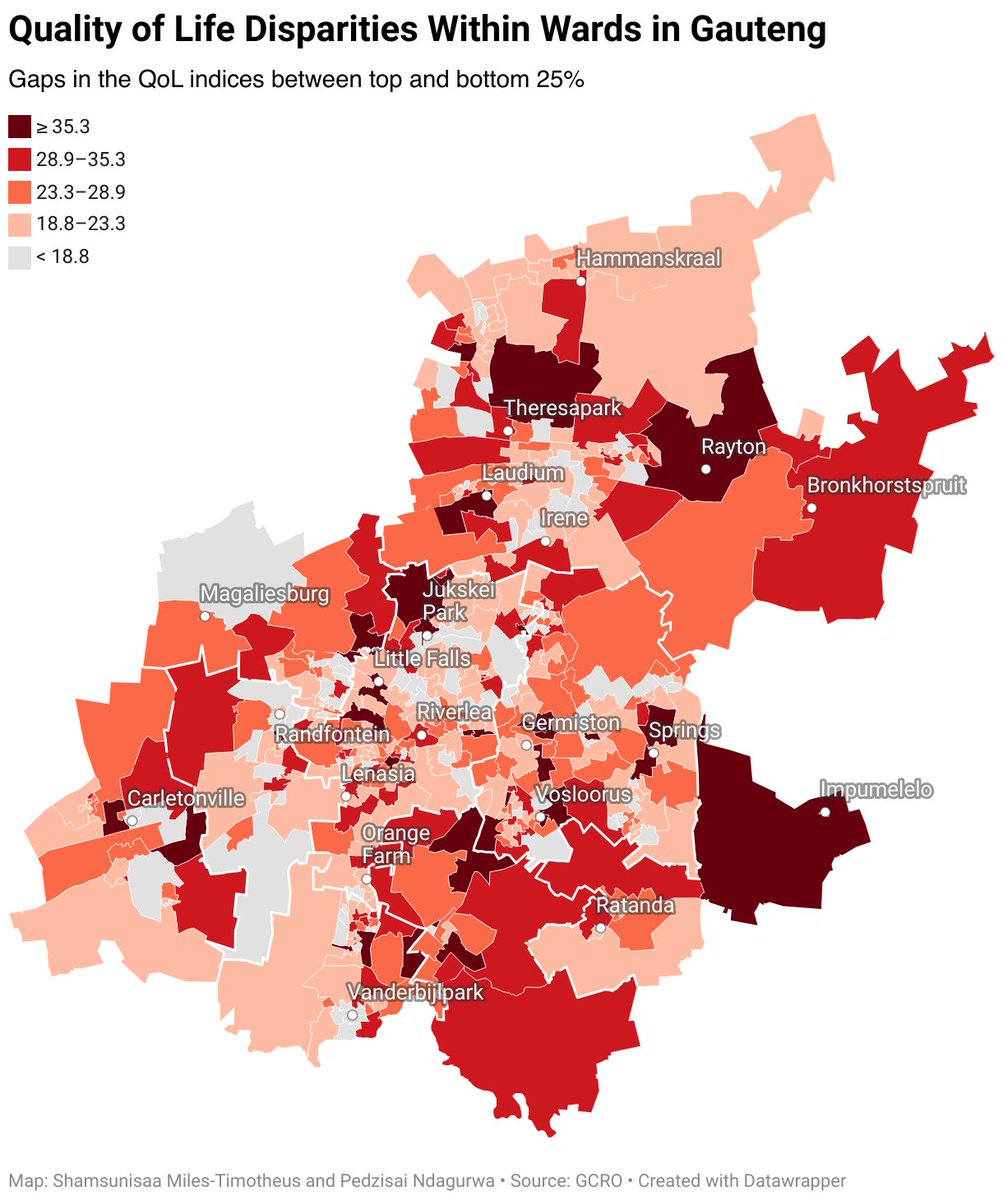
What shapes quality of life?
Our latest #MapoftheMonth shows big differences in life satisfaction across Gauteng:
ℹ️ 214 wards (40%) scored above 63.4 points on the index (out of 100),
ℹ️ Lower scores appear in some townships and low-income settlements. sl1nk.com/zQmZI
1
4
119

26 Nov 2025
CryoCloud Map of the Month: CAK-THZ1
This month’s spotlight is on CDK-activating kinase (CAK), an oncology target bound to the covalent inhibitor THZ1. As a central regulator of transcription and the cell cycle, CAK is a key target for cancer therapeutics and emerging antiviral strategies.
For November’s edition, we reprocessed EMPIAR‑11793 and produced a 2.5 Å map of the ~85 kDa CAK-THZ1 complex using CryoCloud.
🔬 Dataset size: 12,572 movies
🧠 Total compute time: 52 hours
🚀 Final resolution: 2.5 Å
Curious what CryoCloud could do with your data?
📧 hi@cryocloud.io
#CryoEM #StructuralBiology #DrugDiscovery #SBDD #MapOfTheMonth #CryoCloud
5
191
3 Nov 2025
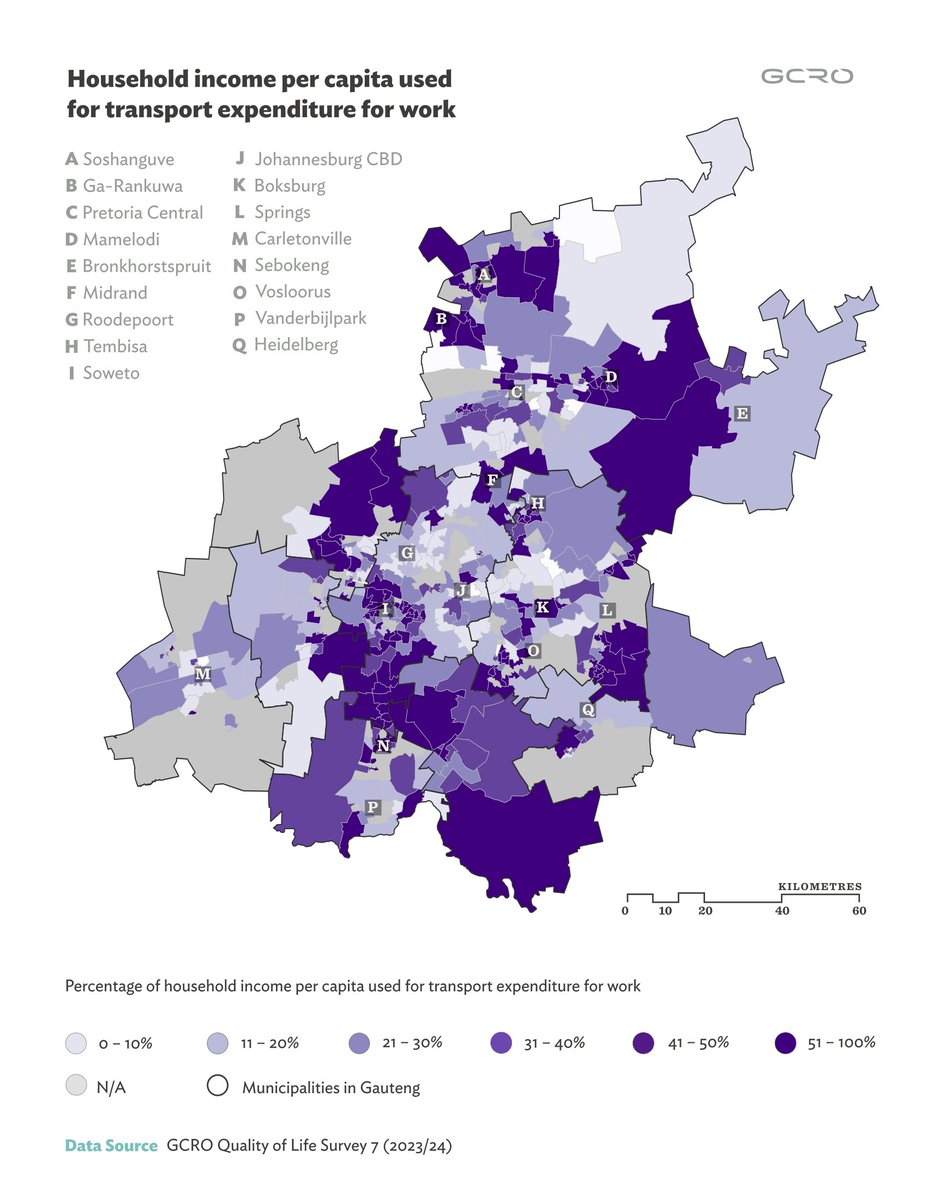
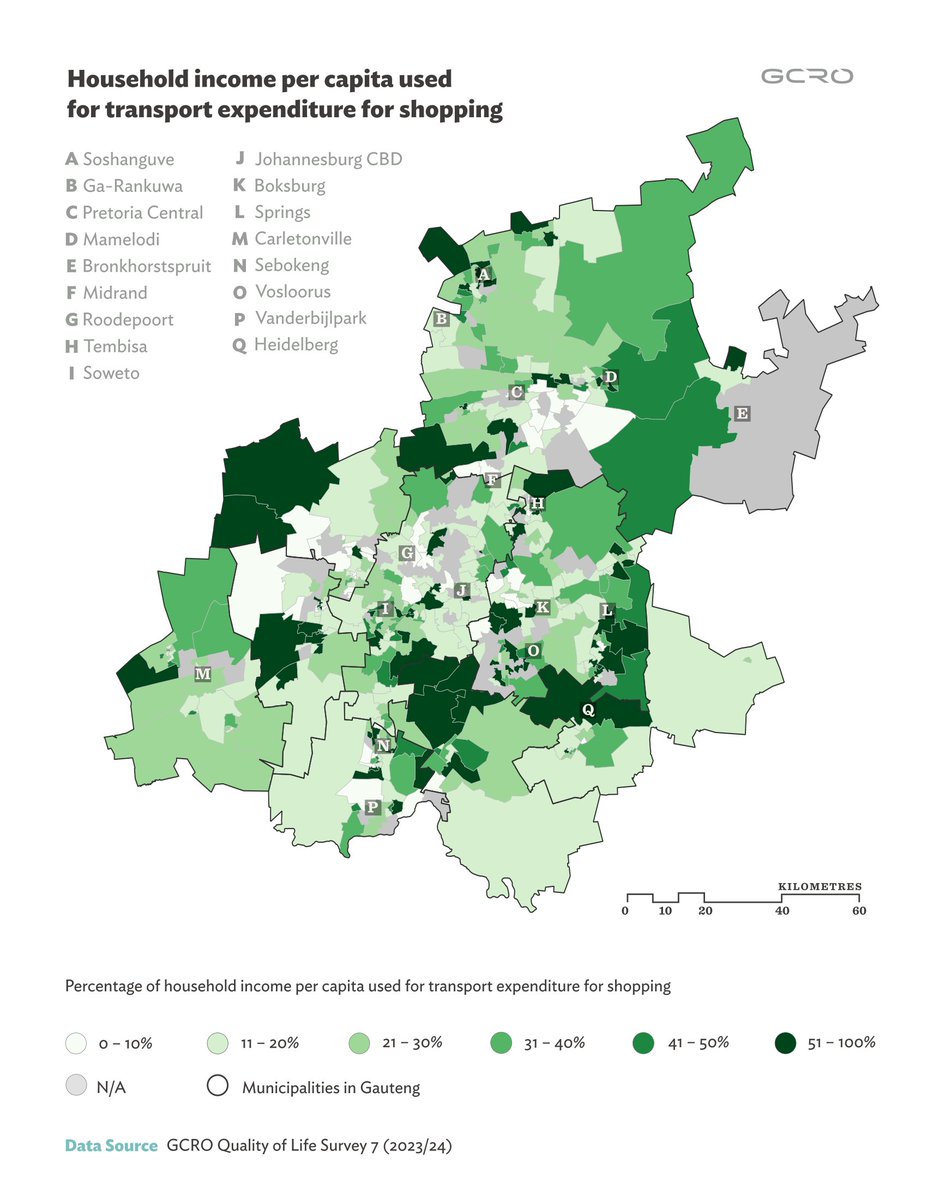
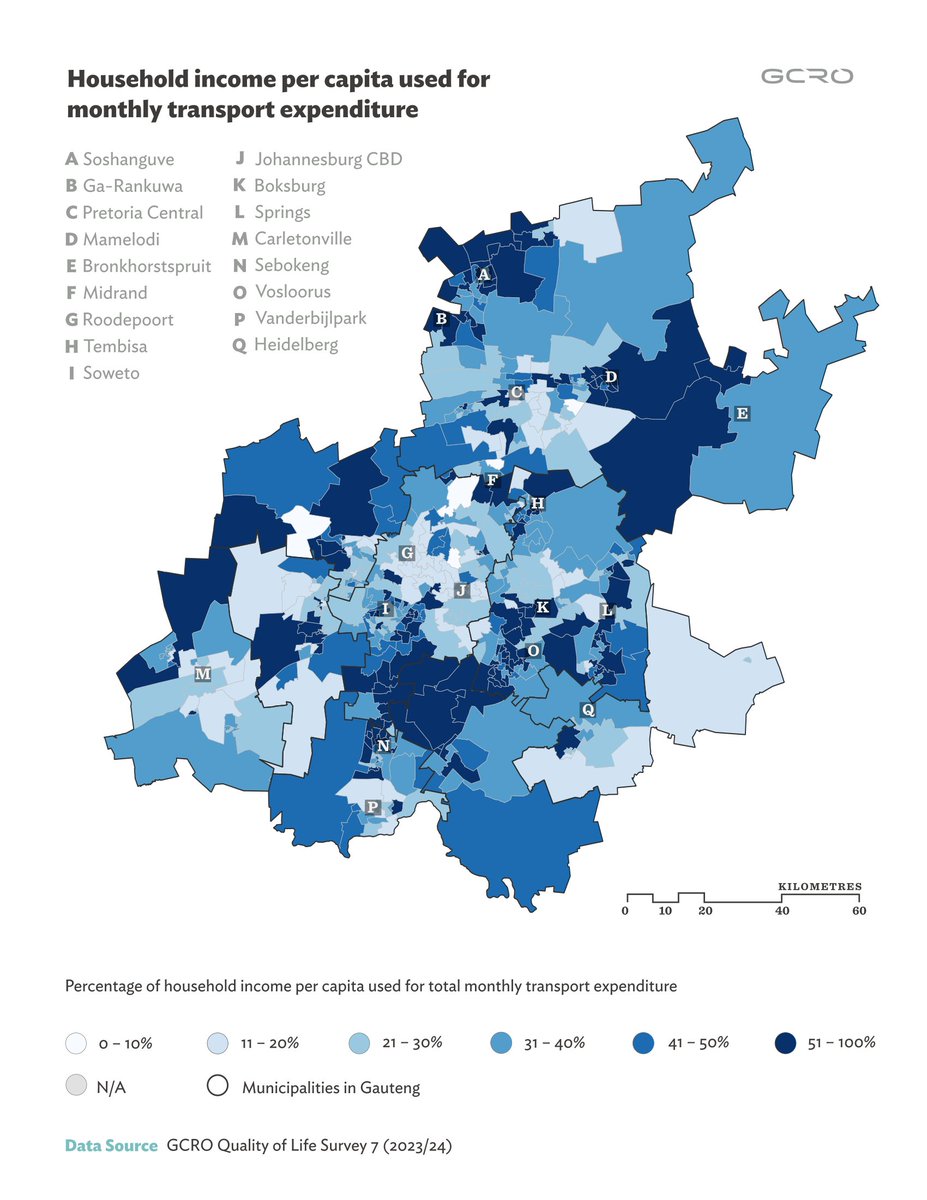
🚍💸 Transport Costs & Spatial Justice in Gauteng
Where you live affects how much you spend to move. This latest #MapoftheMonth shows how transport costs hit hardest in the margins—especially for minibus taxi users. Read more gcro.ac.za/outputs/map-of-th…
#MoTM #GCRO #TransportMonth

2
144
28 Oct 2025
CryoCloud Map of the Month: GLP-1R
Here’s one receptor that needs no introduction – GLP-1R!
With pharma racing to develop next-generation obesity and diabetes drugs, it’s a perfect time to revisit this structural biology favourite.
For October’s edition, we reprocessed EMPIAR-10673, showing the GLP-1 receptor in complex with its natural ligand GLP-1, and generated a 2.7 Å map using CryoCloud.
Curious what CryoCloud could do with your data?
📧 hi@cryocloud.io
#CryoEM #StructuralBiology #DrugDiscovery #GPCR #Obesity #Diabetes #SBDD #MapOfTheMonth #GLP1R #CryoCloud
4
111
24 Sep 2025
Big insights from a tiny dataset ⚡️
CryoCloud Map of the Month: SARS-CoV-2 Spike Protein
For September, we spotlight a vaccine research use case. In antigen design, cryo-EM is used to confirm that engineered proteins fold into the correct conformation and present key neutralising epitopes – both critical checkpoints before immunogenicity testing in the lab.
🔬 From a small Glacios screening dataset, we obtained a 3.2 Å map of the SARS-CoV-2 spike ectodomain, showing that even small datasets can confirm structural integrity and epitope accessibility, accelerating design decisions in vaccine R&D.
🧠 Processing on CryoCloud:
• 233 movies
• 3 h 20 min processing
• 3.2 Å final map
This month’s MOTM shows you don’t always need massive datasets or complex pipelines. With a solid sample, answers can come fast 🚀
Curious what CryoCloud could do with your data? Send us a DM for more info or visit cryocloud.io!
#CryoEM #StructuralBiology #VaccineDesign #AntigenDesign #SBDD #MapOfTheMonth #MOTM #CryoCloud
2
284
21 Aug 2025
CryoCloud Map of the Month: PDCoV RBD in complex with two neutralising Fabs
For August, we reprocessed the receptor-binding domain (RBD) of the porcine deltacoronavirus (PDCoV) spike in complex with two neutralising antibody Fabs fragments.
🔬 Cryo-EM reveals two distinct neutralising epitopes, pointing to pathways for synergistic antibody combinations against a potential pandemic threat.
This study also showcases how multiplexing antibodies delivers more structural insight with less cost and processing time.
🧠 Processing on CryoCloud:
• 4,736 movies
• 35.5 h of cloud compute
• Final map: 2.7 Å from 120,787 particles - representing an improvement of 0.3 Å vs the previously published 3 Å map
Publication from the @UtrechtVirology Lab: nature.com/articles/s41467-0…
Send us a DM for more info or visit cryocloud.io!
#CryoEM #StructuralBiology #AntibodyDiscovery #Virology #EpitopeMapping #SBDD #MapOfTheMonth #MOTM #CryoCloud
3
5
768
4 Aug 2025
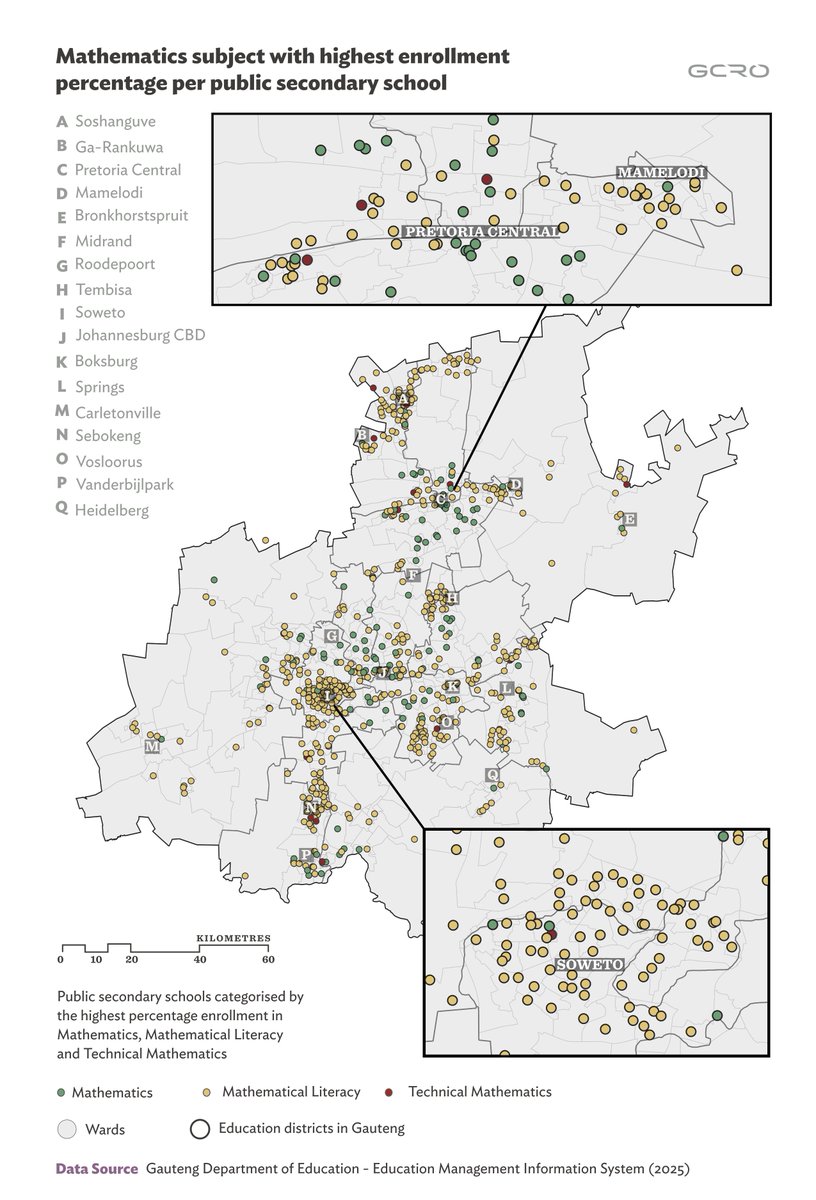
📉Just 3.8% of Gauteng’s poorest schools have most Grade 10s taking Mathematics.
This month’s #MapOfTheMonth by the GCRO & @EducationGP1 reveals troubling trends in maths subject choices — with big implications for skills & the economy.
🔗 Read more: shorturl.at/gJi6C
2
206

16 Jul 2025
Our final instalment of our #MapOfTheMonth series is now online! This time we have a map created by bryophyte recorder Steven Heathcote, showing sphagnum species richness at Askham Bog: neyedc.org.uk/updates-insigh… Steve was accompanied on the survey by Hannah, one of our EDOs 🔎
1
6
93
17 Jun 2025
June's #MapOfTheMonth features a map of records from the main recording area at our recent bioblitz at Kilnsey Park: neyedc.org.uk/updates-insigh…
This is just a small subset of the ~1,000 records of over 600 species recorded at the event 👏
1
6
146
26 Mar 2025
Our #MapOfTheMonth for March is now live on our website. This month we're featuring an Environment Agency map of the current known boundaries of the Ure Crayfish Plague outbreak, along with information about how you can help protected our watercourses: neyedc.org.uk/updates-insigh… 🌊
2
53
4 Mar 2025
This #MapoftheMonth shows clear spatial disparities in perceived safety across Gauteng, with higher income areas feeling safer, reflecting broader socio-economic patterns. Read and download the map on the link below 👇
encr.pw/eEWYM

1
3
210
20 Feb 2025
Our February #MapOfTheMonth shows @Buzz_dont_tweet Important Invertebrate Areas in Yorkshire, one of the additional data sources we provide through our ecological data search service to aid local decision-making & share valuable initiatives in our area: neyedc.org.uk/updates-insigh…
2
76
31 Jan 2025
January's #MapOfTheMonth features map of our bat record density across the NEYEDC region: neyedc.org.uk/updates-insigh… We've recently provided these records for a project creating a Yorkshire-wide bat habitat suitability model, which will help inform conservation & decision-making 🦇
2
70

16 Jan 2025
🗺️New #MapOfTheMonth!
This month's map of the month is the transportation geography of the United States🇺🇸
Map includes:
✈️Airports
🚢Marine ports
🛣️Highways
🛤️Railways
Waterways and Border Crossing points.
bts.gov/geography/geospatial…
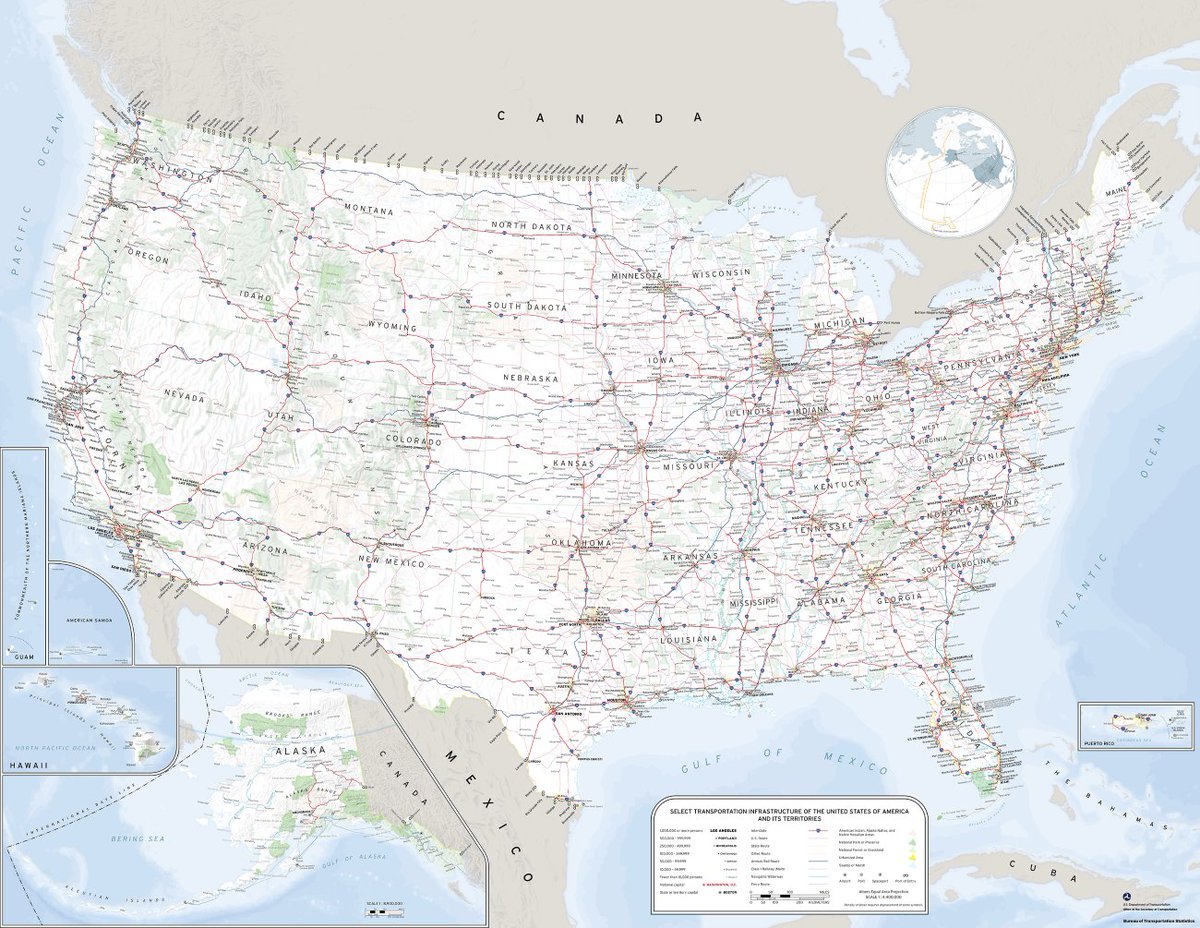
ALT Transportation Geography of the United States 2025.
1
3
470
13 Jan 2025
Disparities in access to services, economic opportunities, and wealth persist across genders, population groups, and urban-rural areas in South Africa. Our latest #MapoftheMonth, featuring GCRO QoL 7 (2023/24) data, highlights these inequalities.
Source: shorturl.at/UJyAT
3
3
212
23 Dec 2024
We've been lucky enough to work on some lovely farmland bird data recently on behalf of one of our brilliant recorders, helping map & analyse records of birds & different crop types associated with them. A perfect topic for December's #MapOfTheMonth: neyedc.org.uk/updates-insigh… 🪶
2
2
286

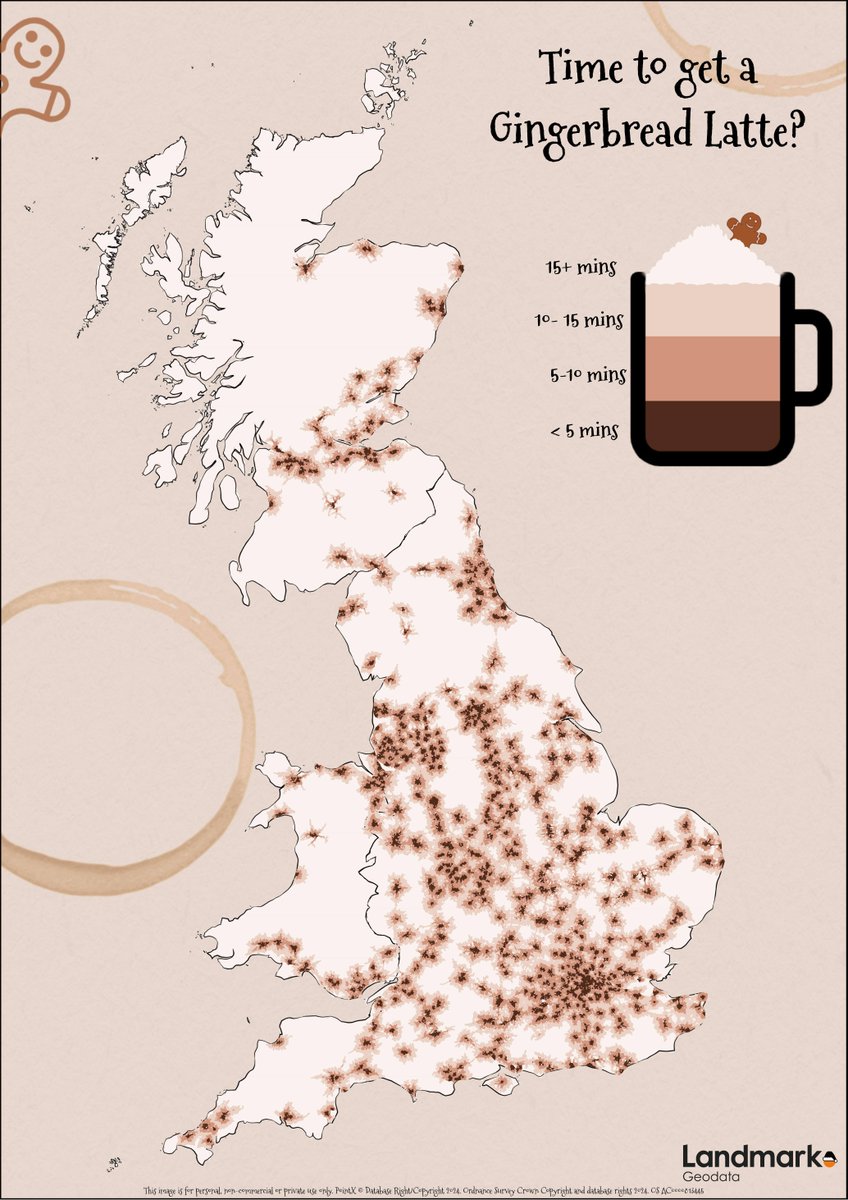
Fancy a Gingerbread Latte? ☕
For a festive #MapOfTheMonth, we've used #PointX data to locate Starbucks locations, and Ordnance Survey's Multi-modal Routing Network to create a handy map for you to check if you can reach one within a 15 minute drive!
hubs.la/Q0309GDv0
2
98
29 Nov 2024
November's #MapOfTheMonth features drone work undertaken by our intern, Rob, investigating the possibilities of using our UAV drone technology to map scrub encroachment on protected grassland sites ⬇️
neyedc.org.uk/updates-insigh…
3
6
269
18 Oct 2024
For October's #MapOfTheMonth we're featuring some of our own data - namely INNS records collected by the NEYEDC team around our old office in central York: neyedc.org.uk/updates-insigh… 📍
1
2
184