
Jun 8
I Audited 40 React Codebases. Every Single One Had a useEffect Memory Leak.
Read the full article here: rgndunes.github.io/Portfolio…
#React #JavaScript #WebDevelopment #FrontendEngineering #Performance #MemoryLeaks #SoftwareEngineering
18

Mar 22
Your Spring Boot app is using 2GB of memory. It was 512MB last week.
No errors. App still responds. Just slower every day.
Then one morning: OutOfMemoryError. App is dead. You restart it. Next week, same thing.
That's a memory leak. And restarting is not a fix.
Something in your code is holding references to objects that should have been garbage collected. Heap keeps growing. GC runs but can't free anything. Eventually no space left.
Common culprits in Spring Boot:
→ JPA Stream<Entity> not closed — EntityManager holds every entity in memory. 100K rows loaded, none released.
→ ThreadLocal not cleared after request — filter stores user context, request ends, ThreadLocal stays. Memory piles up with every request.
→ ConcurrentHashMap as cache without eviction — data goes in, nothing comes out. No TTL. No max size. Grows until heap explodes.
→ Static List or Map that only grows — .add() on every request, never .clear(). Classic leak.
How to find it:
→ Monitor /actuator/metrics/jvm.memory.used — if heap grows and never drops after GC, you have a leak
→ Take heap dump before the crash: jmap -dump:format=b,file=heap.hprof <pid>
→ Open in Eclipse MAT → run Leak Suspects Report → it tells you exactly which object is eating memory
Memory leaks don't crash your app on day one. They crash it on the day your biggest client is using it.
#memoryleaks

5
2
22
6,171

Jan 24
//memoryleaks etc or code clashing together too much id assume (?)
3
19
1,350

22 Dec 2025
🧠 Memory leaks don’t just happen—they follow patterns. Learn how popular Java projects fixed them. #Java #MemoryLeaks
7
1,183

24 Sep 2025
🚨 Si tu app corre bien en tu máquina, pero se derrite en producción... Houston, tenemos una fuga.
👀 Monitorea, haz profiling y prueba con carga antes de que el GC entre en pánico.
#Java #DevTips #MemoryLeaks #Performance
2
57

23 Jun 2025
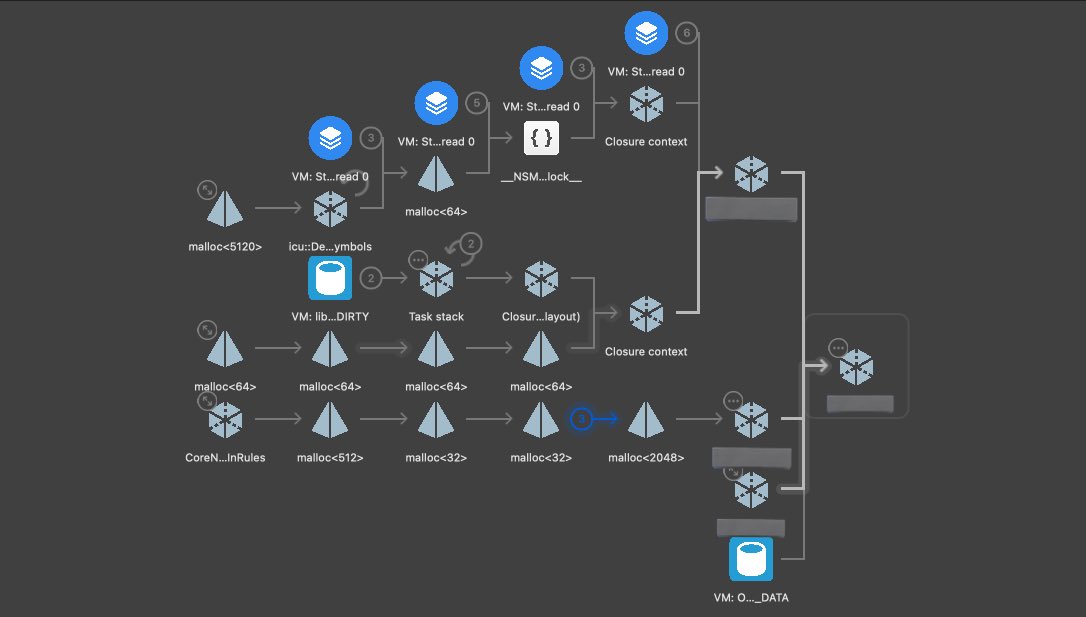
€50 Dev Challenge
Think you can read memory graphs?
What’s happening in this allocation trace?
What tool generated it, what are we looking at, and what’s probably going wrong?
Follow reply with your full breakdown.
I’ll pick a winner when someone gets close enough. Could be tomorrow. Could take a week... it depends but the challenge is only opened for 12hrs
🔁 Reply Tweet (Rules)
✅ Must be following me and @smeanalytica to win
✅ Reply with a serious breakdown (no ChatGPT paste)
✅ Optional: tag a dev friend who’d geek out on this
Winner gets €50 via PayPal/Venmo.
I’ll post their answer shoutout when the challenge ends.
Data names have been scrambled to protect the devs. If you recognize any of these, no you didn’t.
#iosdev #xcode #macdev #swiftlang #devtwitter #memoryleaks #mobiledev
@nnscribble
1
1
3
366

21 Jun 2025
the newest update broke pvp once again, the games just unplayable with too much framedrops and memoryleaks
1
2
63

3 Apr 2025
2️⃣ Common Memory Issues in C 🚨
❌ Memory Leak – Forgetting to free allocated memory.
❌ Dangling Pointer – Accessing memory after freeing it.
❌ Double Free Error – Deleting the same memory twice.
Always use delete or free() to avoid these!
#MemoryLeaks #CodingTips
1
2
23


Did I not mention the YouTube channel? 😅 #MemoryLeaks
youtube.com/channel/UCboLVsH…
7
710

1 Nov 2024
🔍 Debug memory leaks with Chrome DevTools.
How-To: Use Chrome DevTools' memory tab to analyze and fix memory leaks in your web applications.
#ChromeDevTools #MemoryLeaks #SmartSnippet #AllDayDSK
1
1
4
248

31 Oct 2024
No post dessa semana, explico tudo sobre vazamentos de memória e como eles acontecem em slices, com exemplos e dicas práticas!
Leia mais: aprendagolang.com.br/memory-…
cc: @eminetto @sseraphini @laislima_dev @badtux_ @mfbmina
#Golang #Go #MemoryLeaks #Desenvolvimento #Programação
1
7
14
515

10 Oct 2024
🚀 Debugging and Fixing Memory Leaks in Next.js Applications
Memory leaks can significantly slow down performance and even cause application crashes if not properly addressed. In this blog, I cover some common causes of memory leaks in Next.js and provide practical ways to fix them.
Here are the key takeaways:
Global Variables: Variables declared globally can grow with each request if not managed properly, leading to memory issues.
Closures: Functions that retain access to variables from their parent scope can cause memory leaks if not cleared after use.
Event Listeners: Failing to detach event listeners when DOM elements are removed can result in memory leaks.
Timers & Intervals: Forgetting to clear setInterval or setTimeout can steadily increase memory usage.
Third-Party Libraries: Some libraries, especially those not designed for server-side rendering, can introduce memory leaks into your application.
🛠️ This blog provides detailed steps to help you identify, debug, and resolve these leaks, ensuring your Next.js applications remain fast and reliable.
🔗 Check out the full blog to learn how to keep your app memory-efficient!
#NextJS #MemoryLeaks #WebPerformance #Optimization #React
linkedin.com/posts/nisalrenu…
5
149

31 Aug 2024
🔍 Debug JavaScript memory leaks with Chrome DevTools.
How-To: Use Chrome DevTools to find and fix memory leaks in your JavaScript applications.
#JavaScript #MemoryLeaks #SmartSnippet
1
40

27 Aug 2024
VALORANT muss langsam mal anfangen die Memoryleaks zu fixxen in derem Clienten, es ist extrem annoying nach 2-3 games das game zu restarten weil sonst der desync und der input-lag richtig reinknallt.
1
3
407

12 Jul 2024
Discover how the React compiler deals with memory leaks induced by closures and why it doesn't protect against them. A must-read for any serious coders. schiener.io/2024-07-07/react… #React #MemoryLeaks #Coding
7
327

22 Jun 2024
Question for programmers:
When/if you ever experience memory leaks in your code, how would you go about fixing it?
#programminghelp #CPP #programming #memoryleaks
1
49
15 Apr 2024
Keep your Java applications running smoothly! 🚀 Our latest post is your ultimate guide to avoiding memory leaks in Java. Learn essential tips and best practices to ensure your applications stay efficient and reliable. #Java #MemoryLeaks 💡 buff.ly/3Tp2lX7
4
21
2,632