
New Bull & Bear Model Books are available for Memorial Day Special Offer!....Limited time!
Packed with:
➡️Data Tables
➡️Market Cycle Data
➡️Annotated Charts
➡️Indicators, Tools I use at Market Tops and Bottoms
➡️Overview Link to the content...coupons inside:
👇
youtu.be/ahbUjjTtLEs
Join us rainkinginsights.com
#stocks $qqq $spy #modelbooks #bull #bear #marketdata

1
2
8
1,562

May 11
📈Building Your Own Stock Modelbook 💡
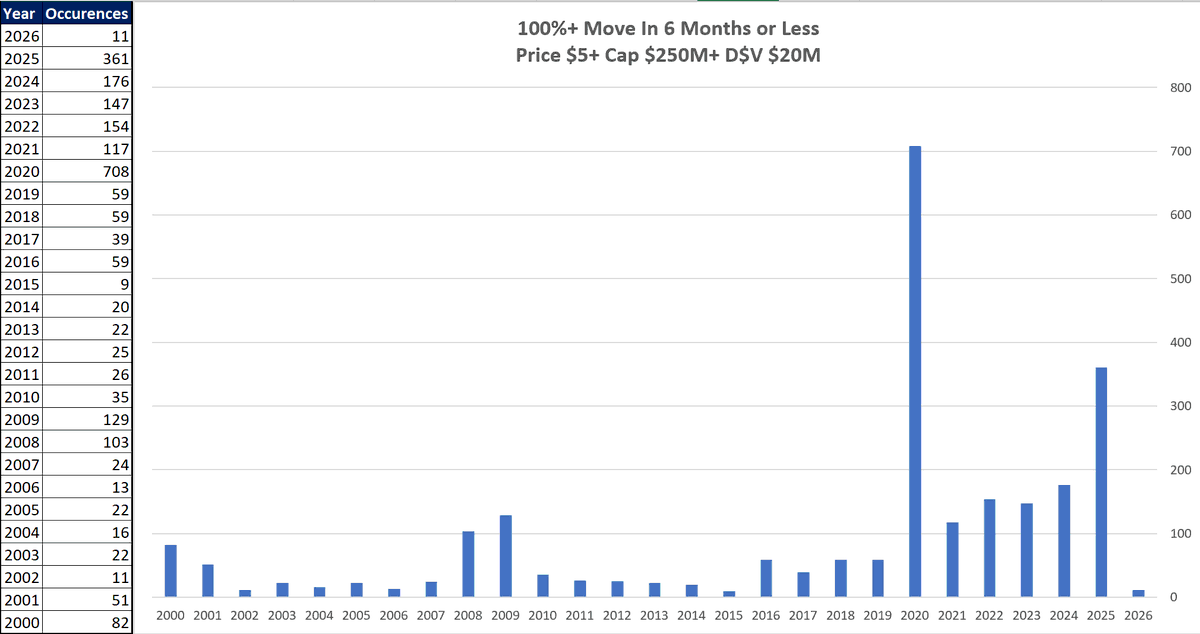
100% move in less than 6-months
"Go back and look at stocks like your life depends on it for the last 10 years of all the big movers at the very least but ideally even further back.
There's no shortcut, you need to develop an eye for what is a good set up and what isn't." - @Qullamaggie
Enclosed is a file identifying all the US stocks that made a move of 100% in 6 months or less from 2000 until mid Apr 2026 - may be useful for anyone looking to study past winners and build their own Modelbooks
docs.google.com/spreadsheets…
3
5
37
6,737

Mar 15
Here's his video explaining: I still love your outlook & description
I joined IBD Founders club for 1 year just so I had access to all 10 of the courses and modelbooks! (think I got the last of the printed modelbooks!). You and Charles did a great job, I've tried to program Market School in el, but i stopped when I made some other proxies
In another reality I'd have had access to your environment, but in this one I chose my own adventure :) (a lot of time, $, & effort),
<3 X for things like this,
(I've only seen the first quarter & listened to the first half, hope to spend more time with it soon)
youtu.be/OlkdV-gaELU
1
2
78
12 Jul 2025
Building Your Own "Trading Workbook"
I think most people who trade would benefit from building their own “Trading Workbook”, however simple or complex, to “automate the repetitive (boring! ) stuff”.
If you like what I share in my posts on X and it gives you some ideas, or you just want to copy it directly, then I encourage and champion you to do so! 🤝
@jfsrevg has some amazing posts on creating dashboards and @Clement_Ang17 has a beautiful "Daily Market Plan" worksheet that he shares in his posts on X.
Hopefully, on your journey, you might come up with some fresh ideas for your "Trading Workbook" and others in turn will be “inspired” to build those ideas into their processes and systems (this includes me).
I will try to write a “How to build a Trading Workbook - 1st Steps” post this week but in the meantime I will try to answer your questions now.
The workbook I use is simply MS Excel. No fancy plug-ins, macros, APIs, just “out-of-the box” Excel using the standard features available.
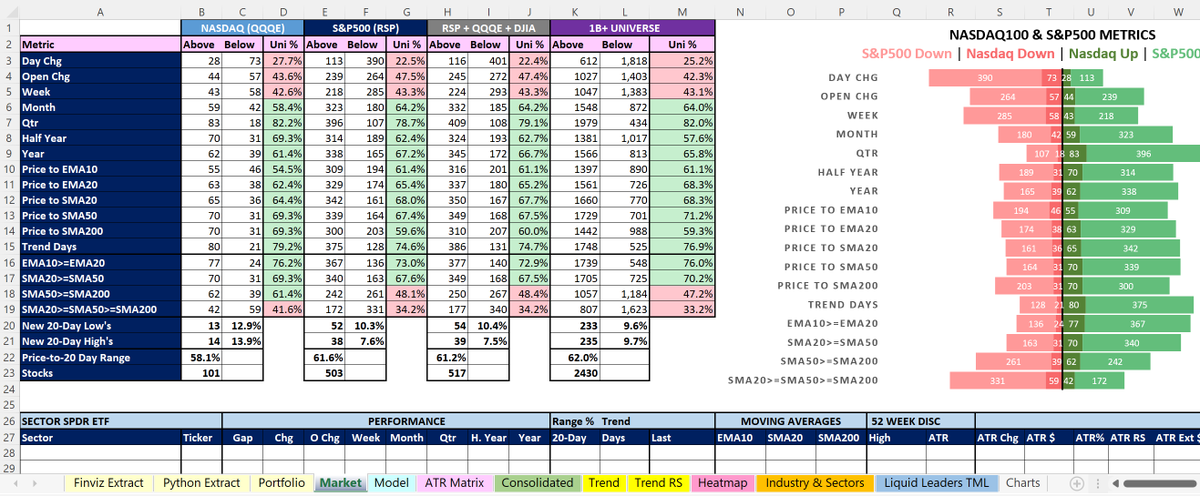
I recommend strongly having your source data separate from your calculated data. This makes it easier to manage and develop. Personally, I have 3 “input” worksheets (see screenshot):
Input Worksheet 1 - Finviz Extract
This worksheet is where I paste (using paste special) the abbreviated data downloaded from @FINVIZ_com .
I use the link below (except with a $1B threshold rather than $2B as you need Elite to use $1B)
finviz.com/screener.ashx?v=1…
During market hours, I download the CSV file multiple times throughout the session from @FINVIZ_com and paste it directly into this worksheet to update the data in (almost) real-time for the $1B stock universe (around 2400 stocks). It takes a few seconds.
Input Worksheet 2 - Python Extract
This worksheet stores the calculated non-intraday data.
I take a full @FINVIZ_com download of all data using this link:
finviz.com/screener.ashx?v=1…
With the extract downloaded, I run the Python code around 6/7am GMT and it takes around 90 minutes, calculating Key Moving Averages, obtaining analyst Revenue/EPS estimates from other websites etc . Basically, generating a data file that doesn't need to be refreshed intraday.
This is why when I post, sometimes I add "(EOD)" because I have not refreshed all the Python data compared to if I post premarket.
Input Worksheet 3 - Portfolio
The current holdings are extracted from the brokerage account(s) and pasted directly into this worksheet.
If I buy or sell, I will re-extract and paste throughout the day.
Having the current portfolio positions helps me know what I want to buy/add/reduce/sell and how much based on reward-risk. For example, if I have $AG as a core position, I will not want to add $PAAS due to overlap. Alternatively, the core positon could be 50% of each as they are the same industry (Silver).
All other analysis and the posts shared on X are derivatives from these three worksheets using “out-of-the-box” Excel. This includes:
- ATR Matrix (including my personal watchlist)
- Scans (O’Neil, Qullamaggie, Minervini)
- Relative Trend Strength Matrix
- Darvas Heatmap
- Stage Analysis
- Industry & Sector Analysis
- Liquid Leaders
Most Importantly - save regularly (as new files) and keep backups!
I recommend creating a new version/copy everyday prefixed with today's date (format YYMMDD). This then becomes a great archive if you want to look back historically at snapshots, perform trade analysis and build "Modelbooks".
Hope this helps!
Best of luck and have a great weekend🍀
12 Jul 2025

Thank you so much, Steve. I appreciate how thorough you are, both in this reply and your posts more generally.
I understand you cannot share the workbook due to the proprietary nature, but if I endeavored to replicate that workbook, what program does it use? That would help tremendously.
I assume you can run the workbook, then extract the results via an export that is formatted for TradingView, and import it as a new watchlist each week?
I would love to create something like this, as the efficiency in the workflow would do wonders for my weekend prep. Thanks again.
8
36
218
34,556

26 Jun 2025
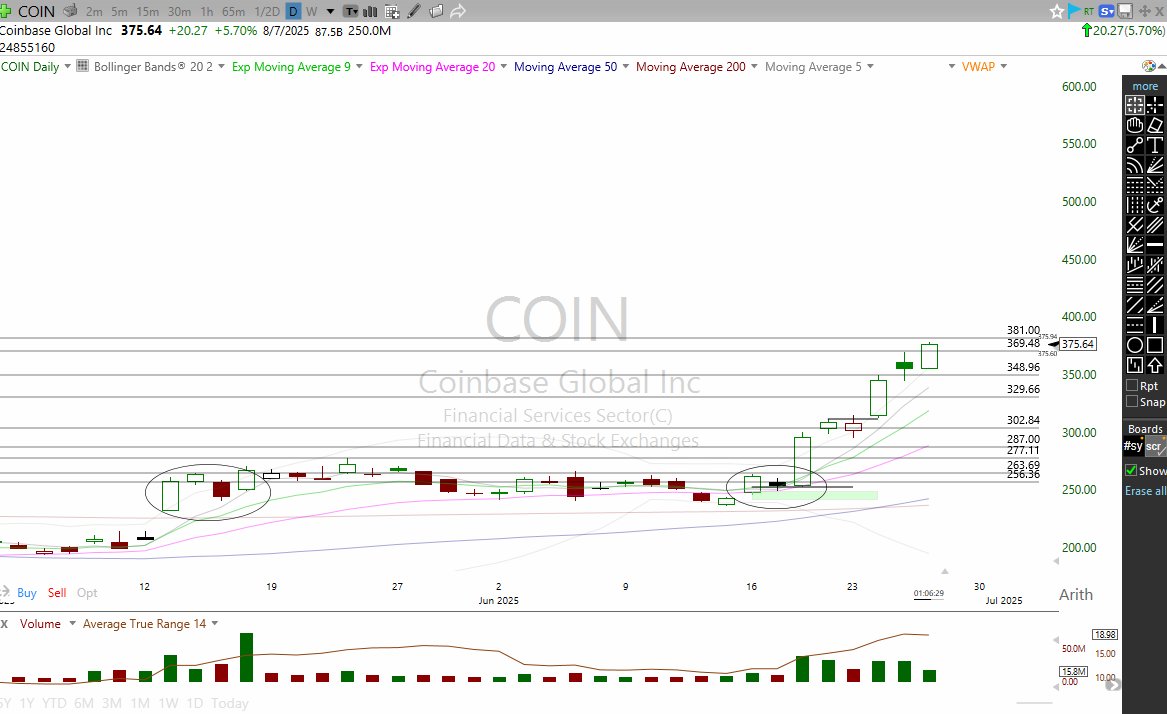
$COIN From the minute it broke out I said it has to be held for a homerun. That is not a move you look to sell that is a move you get as much size as possible. A trade like this you simply cannot own enough shares of.
Now $376 and of course you can lock in a partial here. But still, do not underestimate this move. Do not look to fade it. This will consolidate and get another leg. This setup will be in modelbooks without a doubt.
In play for months.
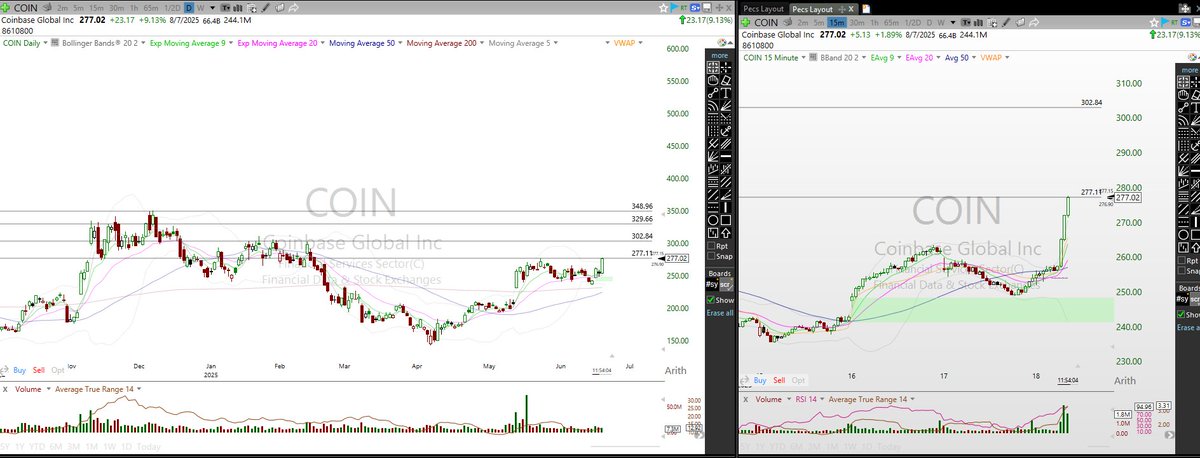
18 Jun 2025

$COIN There is 0 reason to sell this anytime soon. This has $300, $330, $350 all over it.
27
7
131
26,559

4 May 2023
Die Kunden treffen aus den modelbooks die Entscheidung wer zum Casting kommt,na zum Glück sind in dem Book soviel shooting Bilder aus dieser Staffel..🤡🤡🤡 #gntm
1
254

27 Mar 2023
Lately I've been doing a lot of research on cross stitch this book Includes borders, scenes from fairy tales, myths, lords and ladies, the virtues, A few of the designs can be sourced to 16th century modelbooks, but they are not attributed

1
3
102
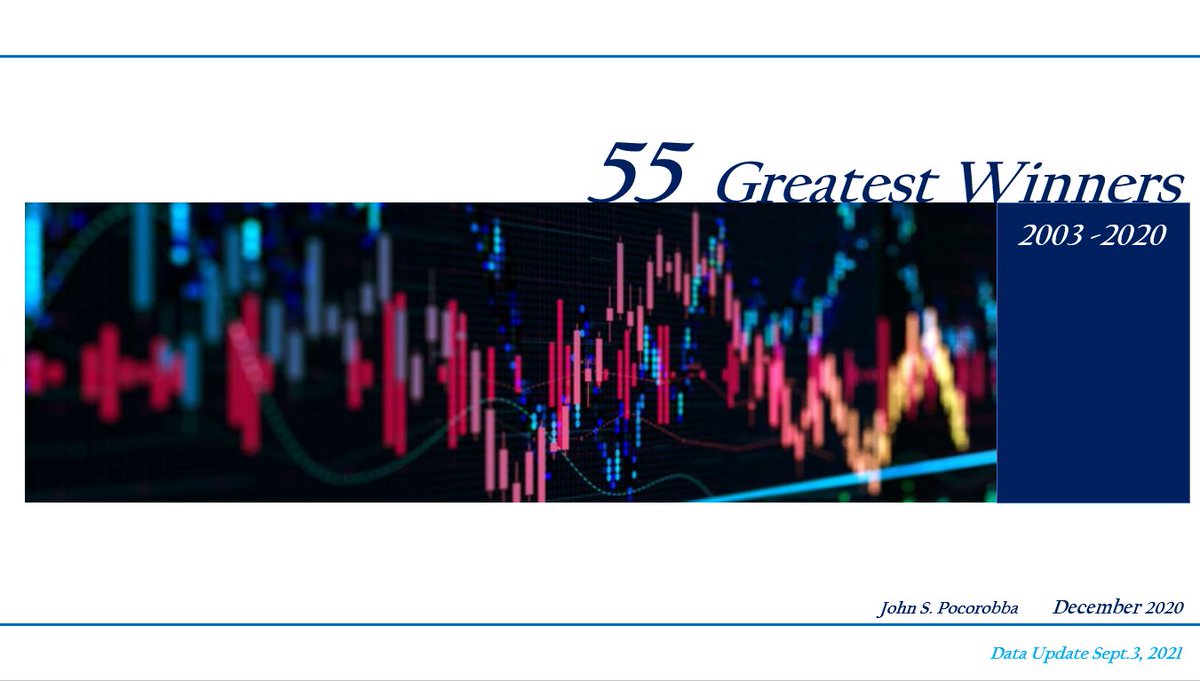
Offering a special rate this week on my 55 Greatest Winners Model Book....100pp Data Tables, Graphics, Summary Insights, Annotated Charts. Email me at 55greatestwinners@gmail.com and/or watch the 10min overview youtu.be/v0-X2DfVCoA #stocks #modelbooks
1
4
29

9 May 2022
Entre ellas "Las Casas que me Habitan" Gracias @ethel_baraona @dpr_barcelona por agrupar, acompañar, ponernos juntas ! #modelbooks
plataformaarquitectura.cl/cl… #modelbooks #llibresmodel2022 en @a_book_fair @parq
2
4

7 May 2022
Més llibres que m'han agradat, els podeu comprar a Llibreria Finestres
@Ll_Finestres
#ModelBooks #LlibresModel #ModelFestBCN

3
7 May 2022
Alguns dels llibres que m'han agradat, els podeu comprar a Llibreria Finestres
@Ll_Finestres #ModelBooks #LlibresModel #ModelFestBCN

2
7 May 2022
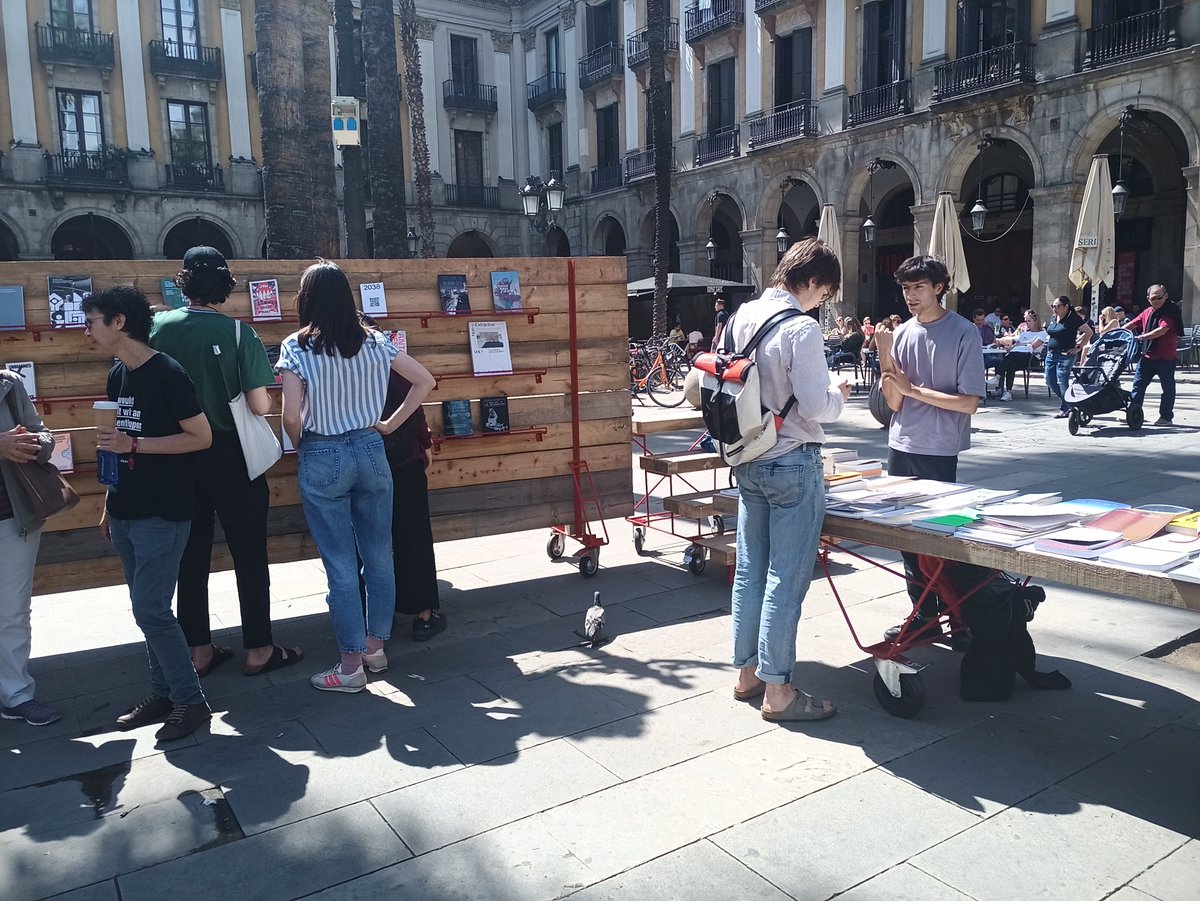
Compartint amb @ethel_baraona de @dpr_barcelona a #LlibresModel Plaça Reial #ModelFestBCN #ModelBooks
1
1

5 May 2022
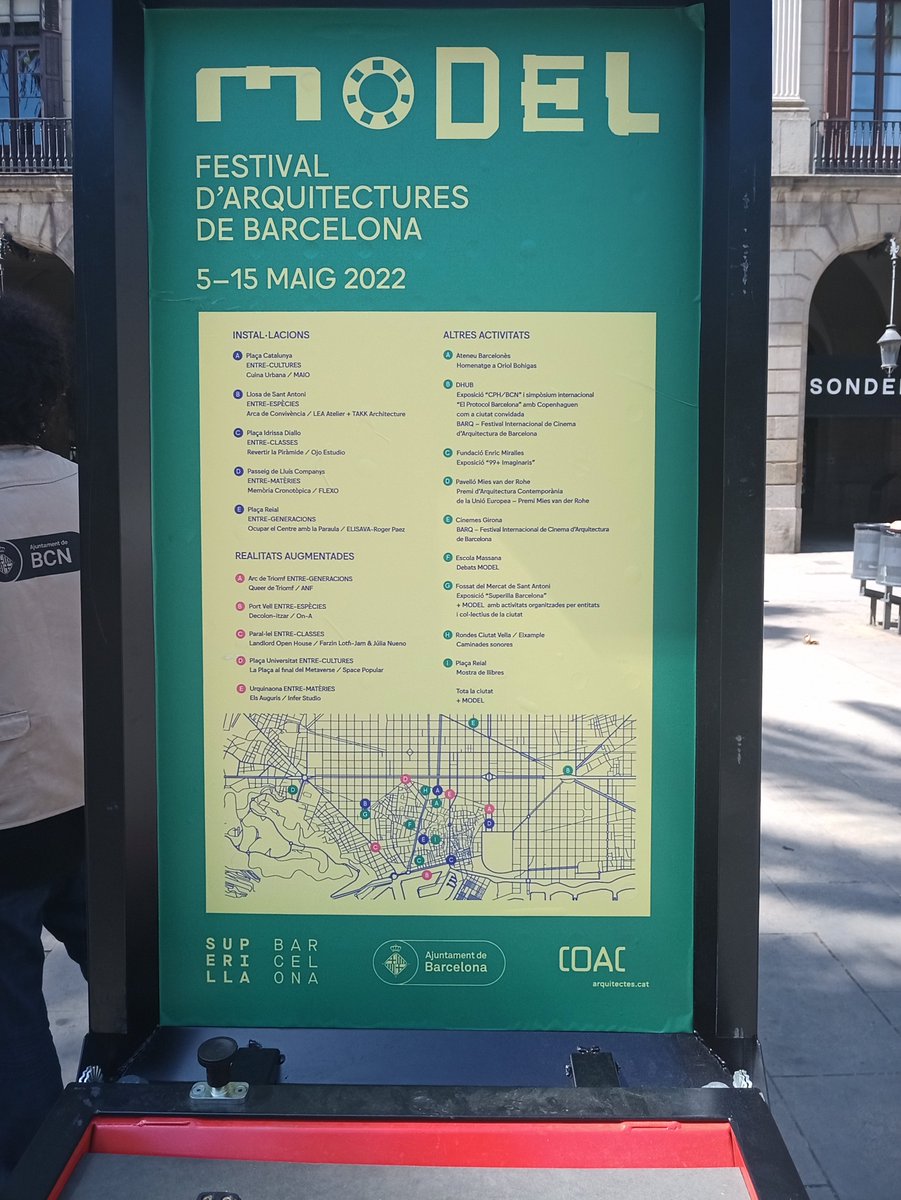
#LlibresModel #ModelBooks kicks off at #ModelFestBCN
Curated by @ethel_baraona on behalf of @dpr_barcelona, it presents a selection of books from different international publishing houses, responding to the festival's main theme: 'Re-growth'
1
5
17
29 Apr 2022
We are happy to introduce @dpr_barcelona, initiators of the #ArchitectureBookFair, currently curating #ModelBooks as part of #ModelFestBCN
They are are @ethel_baraona, @cerreyes and @asdevargas and they love the smell of books!
Come and join us at Plaça Reial May 5th to 15th

1
2
8
29 Apr 2022
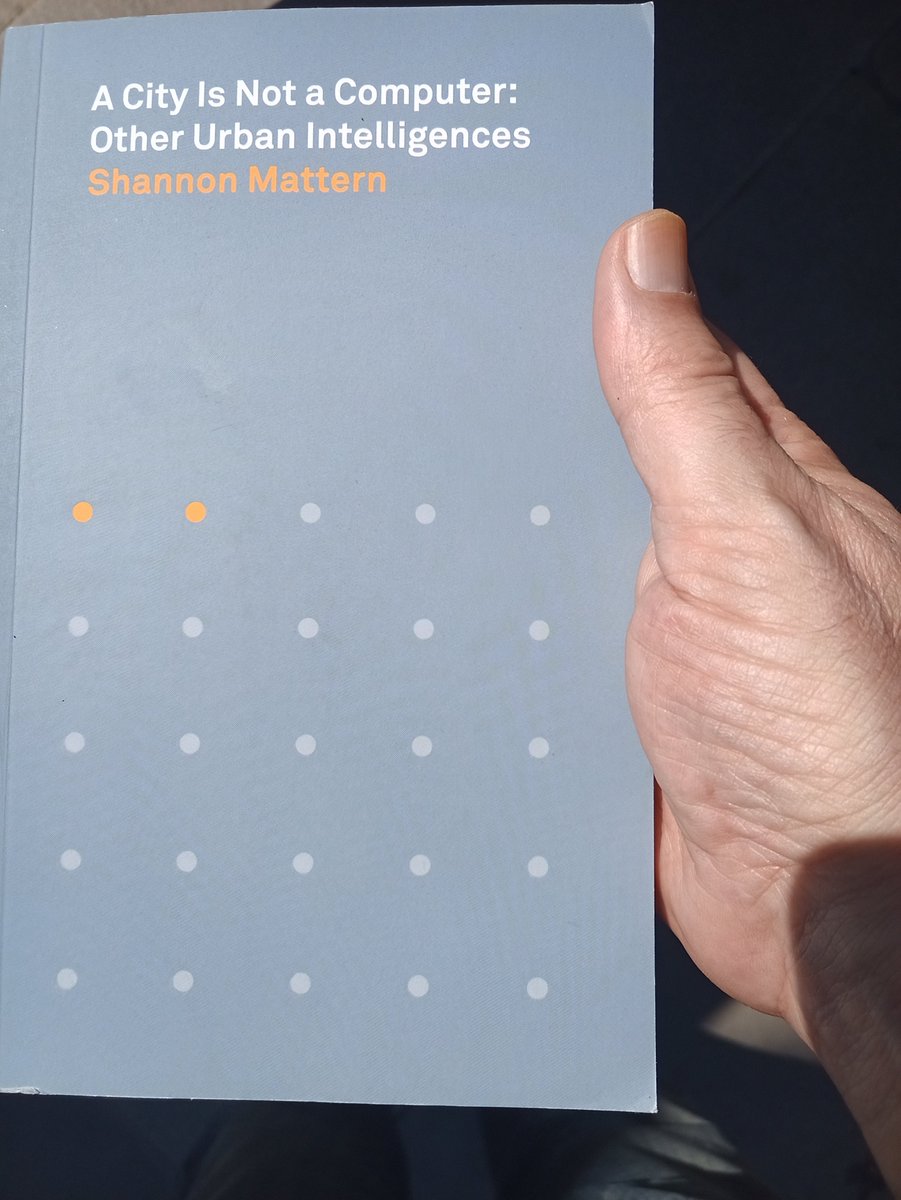
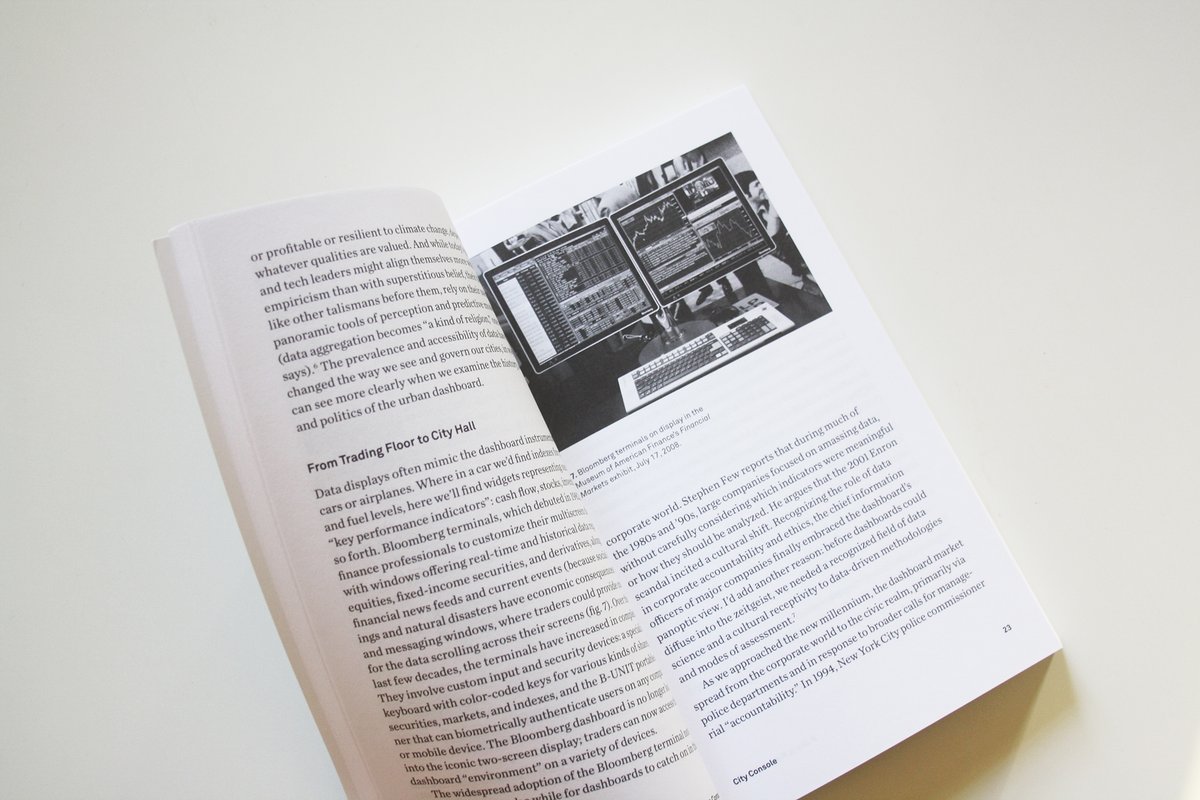
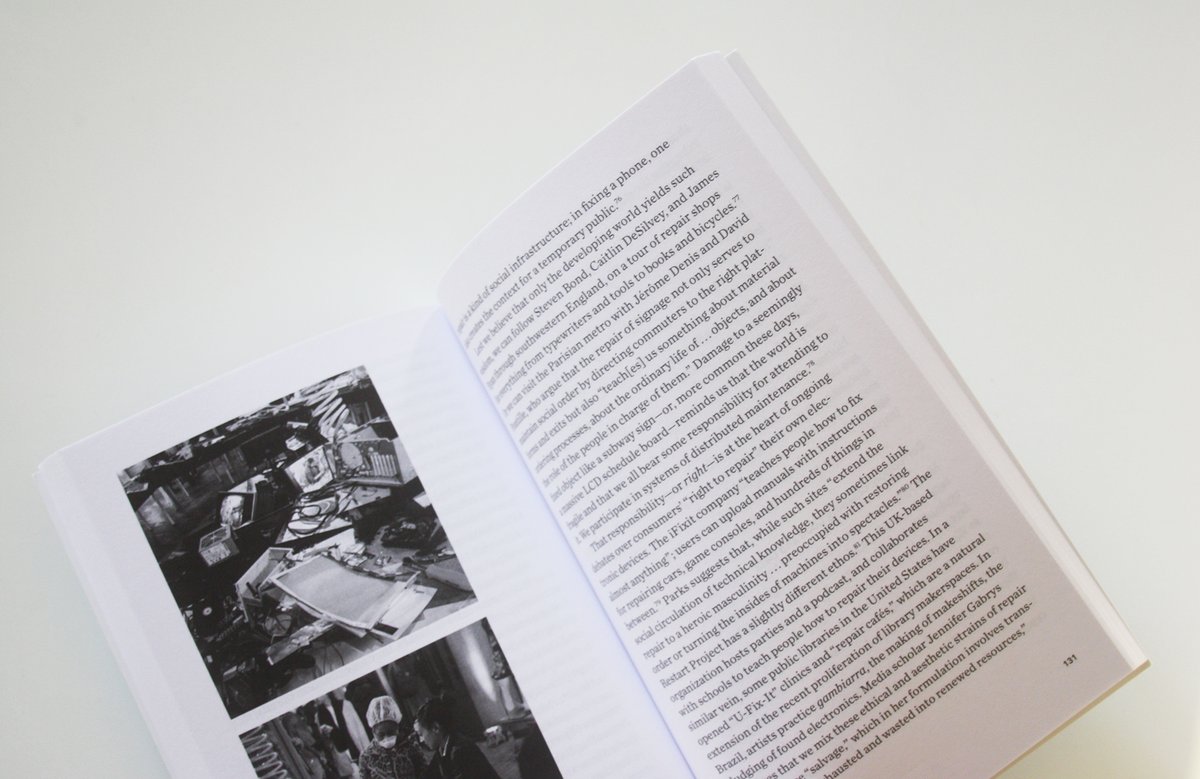
#BookOfTheDay is the remarkable and necessary 'A City Is Not a Computer: Other Urban Intelligences,’ by @shannonmattern @PlacesJournal @PrincetonUPress [2021]
placesjournal.org/book/a-cit…
📚 are #LouderThanBombs #LlibresModel #ModelBooks #stormreader

5
30
28 Apr 2022
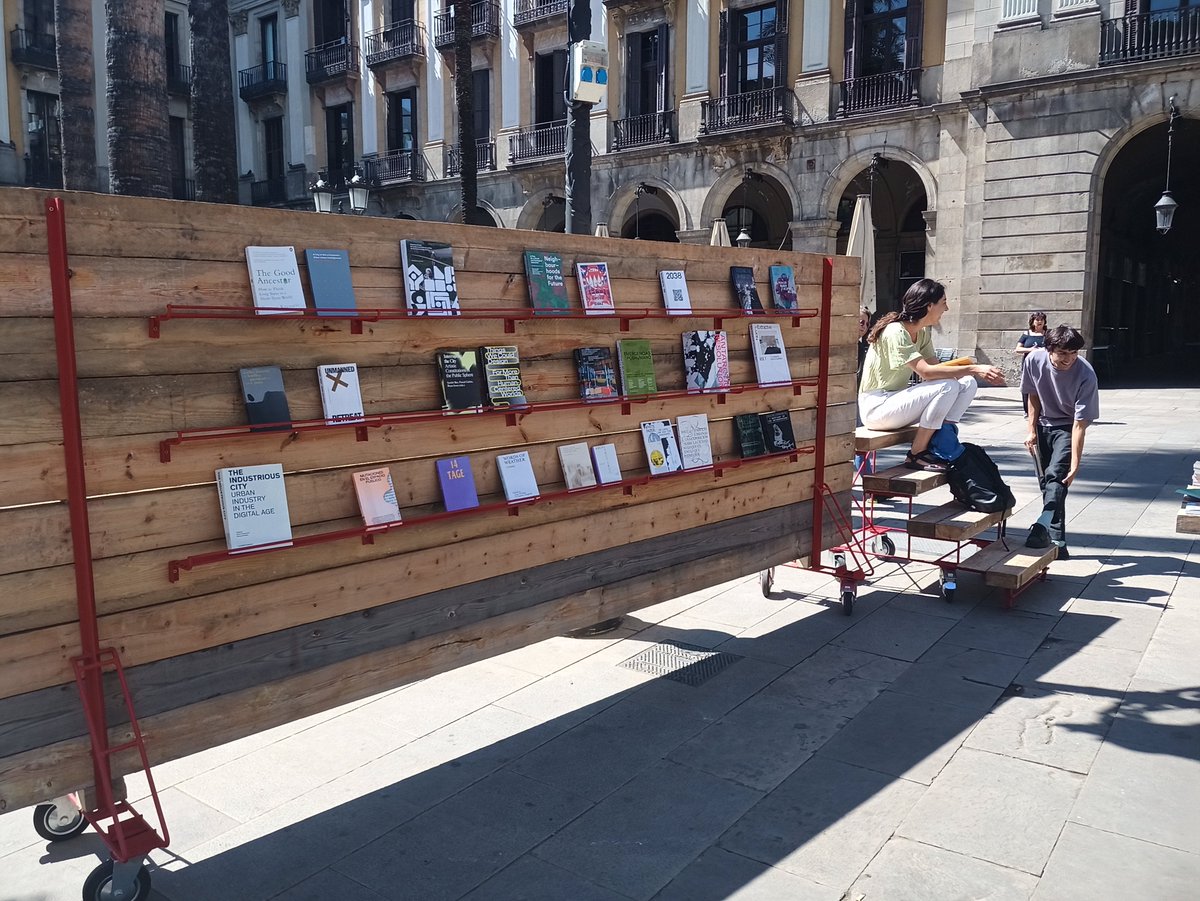
"The books can be found in the Plaça Reial installation throughout the festival, so that everyone who passes through the space may consult and reflect on what the books propose and call into question.”
model.barcelona/en/model-boo…
#ModelBooks #LlibresModel #ModelFestBCN
1
1

28 Apr 2022
28 Apr 2022

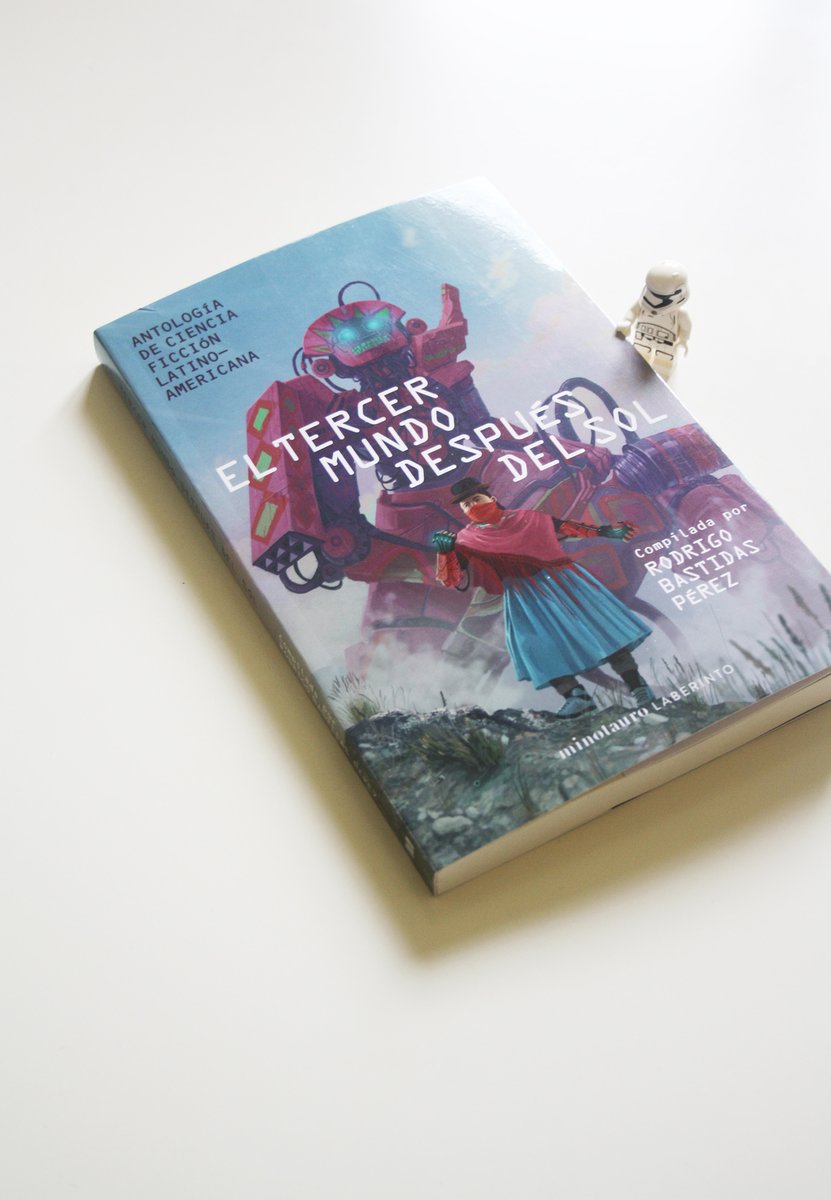
#BookOfTheDay es esta maravilla de antología de ciencia ficción Latinoamericana. 'El tercer mundo después del sol,’ Rodrigo Bastidas Pérez (ed.) @minotaurolibros [2021]
planetadelibros.com/libro-el…
📚 are #LouderThanBombs #LlibresModel #ModelBooks #stormreader
2
28 Apr 2022
#BookOfTheDay es esta maravilla de antología de ciencia ficción Latinoamericana. 'El tercer mundo después del sol,’ Rodrigo Bastidas Pérez (ed.) @minotaurolibros [2021]
planetadelibros.com/libro-el…
📚 are #LouderThanBombs #LlibresModel #ModelBooks #stormreader
2
7
27 Apr 2022
#BookOfTheDay is not a single book but a book series, 'Sonic Urbanism Collection’ edited by @andbeyondxyz and @cityastheatre
theatrum-mundi.org/shop/soni…
📚 are #LouderThanBombs #LlibresModel #ModelBooks #ModelFestBCN

1
1
24 Apr 2022
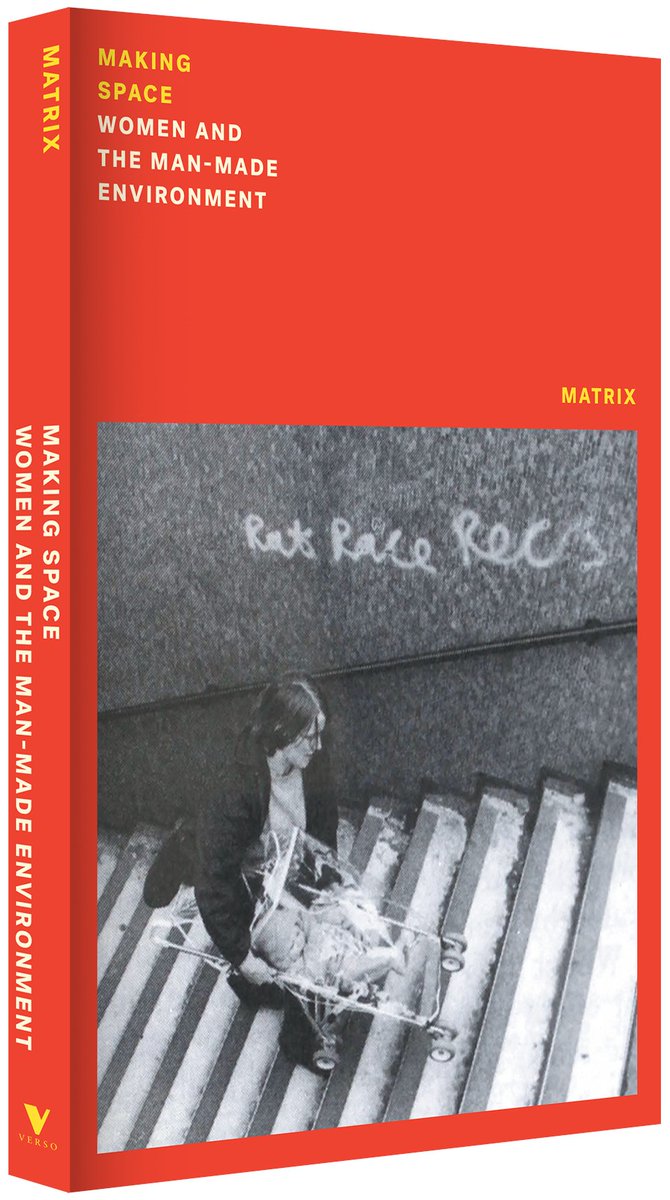
#BookOfTheDay is ‘Making Space. Women and the Man Made Environment,’ by Matrix @VersoBooks [2022] / Part of the Feminist Classics series
versobooks.com/books/3935-ma…
📚 are #LouderThanBombs #LlibresModel #ModelBooks #ModelFestBCN
3
3