23 Feb 2023
this is gold! 👏👏 100 ways to visualize the simplest dataset. the categories/shapes nomenclature reminds me of #modularinformationdesign by @superdot_studio @DarjanHil @NicoleLachen
22 Feb 2023

We are live and kicking!
For our latest project 1 dataset 100 visualizations, we challenged ourselves to turn one simple dataset into 100 insightful and visually appealing data visualizations. Explore all of the #dataviz and stories on 100.datavizproject.com
1
6
435

23 Dec 2022
Happy Holidays! Thank you everyone for your support! Enjoy our data-driven Xmas card. #dataviz #modularinformationdesign #visualizingcomplexity #xmascard
5
308

10 Dec 2022
Coming up this Wednesday 14th! Join us to pick @DarjanHil ‘s brains about his #ModularInformationDesign system.
meetu.ps/e/LDQGZ/m86Vv/i
1 Dec 2022

📆Join us in just two weeks to hear @DarjanHil talk about his award-winning #ModularInformationDesign system! December 14th at 7pm, online.
meetup.com/correlaidswitzerl…
4
5
1 Dec 2022
📆Join us in just two weeks to hear @DarjanHil talk about his award-winning #ModularInformationDesign system! December 14th at 7pm, online.
meetup.com/correlaidswitzerl…
3
3
23 Nov 2022
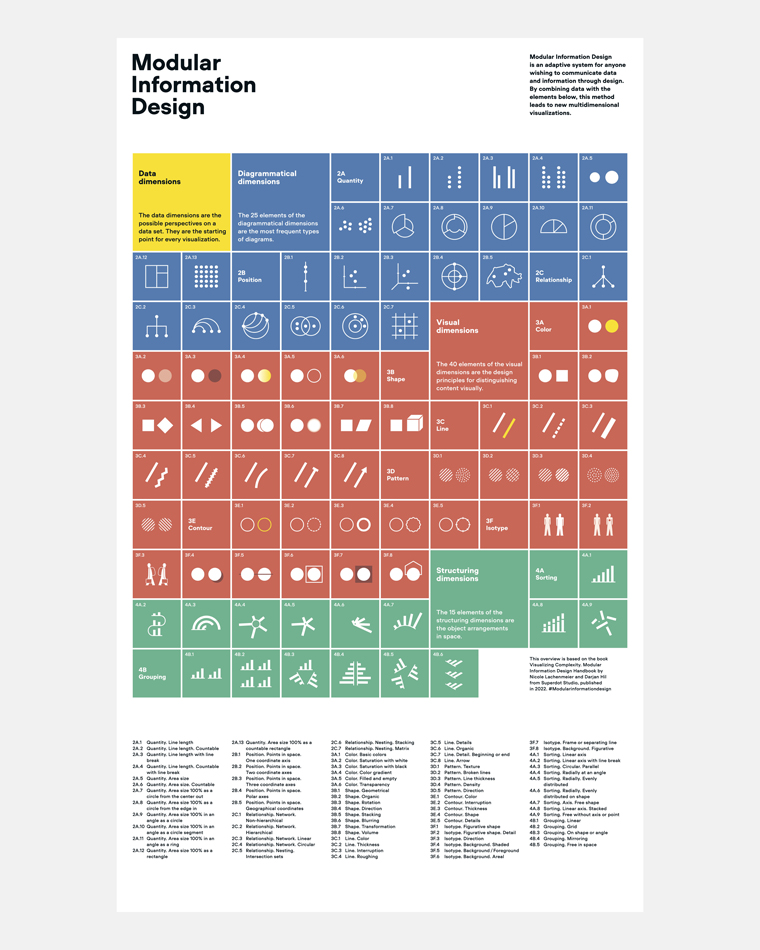
Our #modularinformationdesign summary poster was awarded 2nd 🥈 place at the @dpa_infografik award tonight. Thank you @dpa_unternehmen and congrats to all the other five winning teams!
#dataviz #infografik #visualizingcomplexity
23 Nov 2022

Der 2. Platz 🥈 in der Kategorie Unternehmen geht an @superdot_studio für die Grafik von @NicoleLachen und Darjan Hil mit dem Titel „Modular Information Design (Poster)“. #infografikaward @dpa_infografik. Glückwunsch! 🥳
13
18 Nov 2022
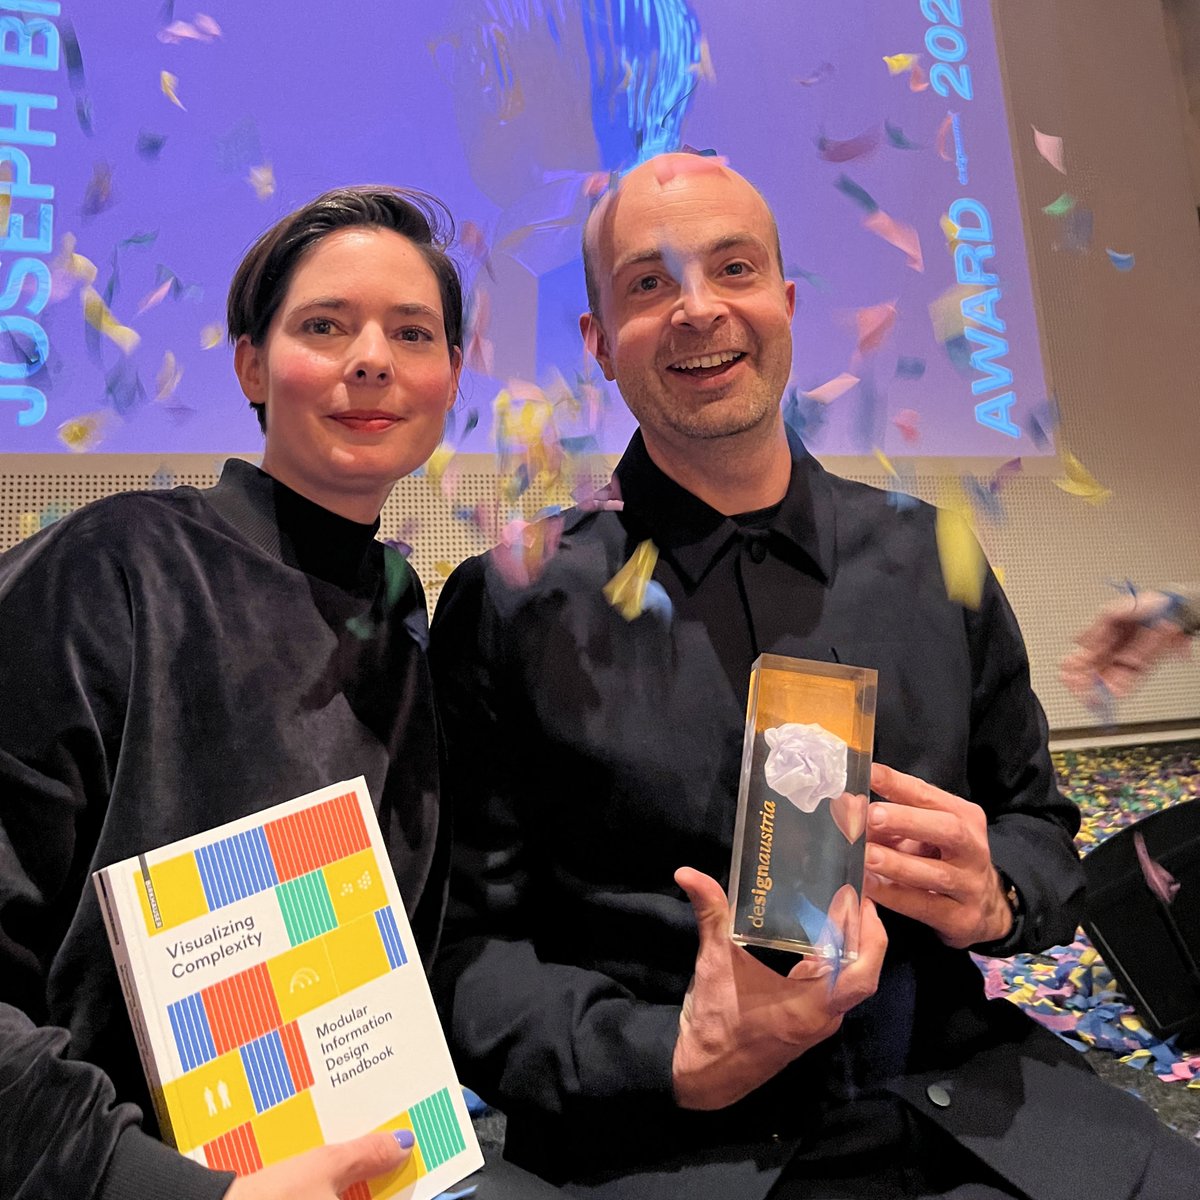
WOW. We have won the 🤩gold award 🤩 in the Information Design category @JB_Award 🏆
Thank you! @IIID_infodesign @superdot_studio team!
#visualizingcomplexity #modularinformationdesign
4
36
13 Sep 2022
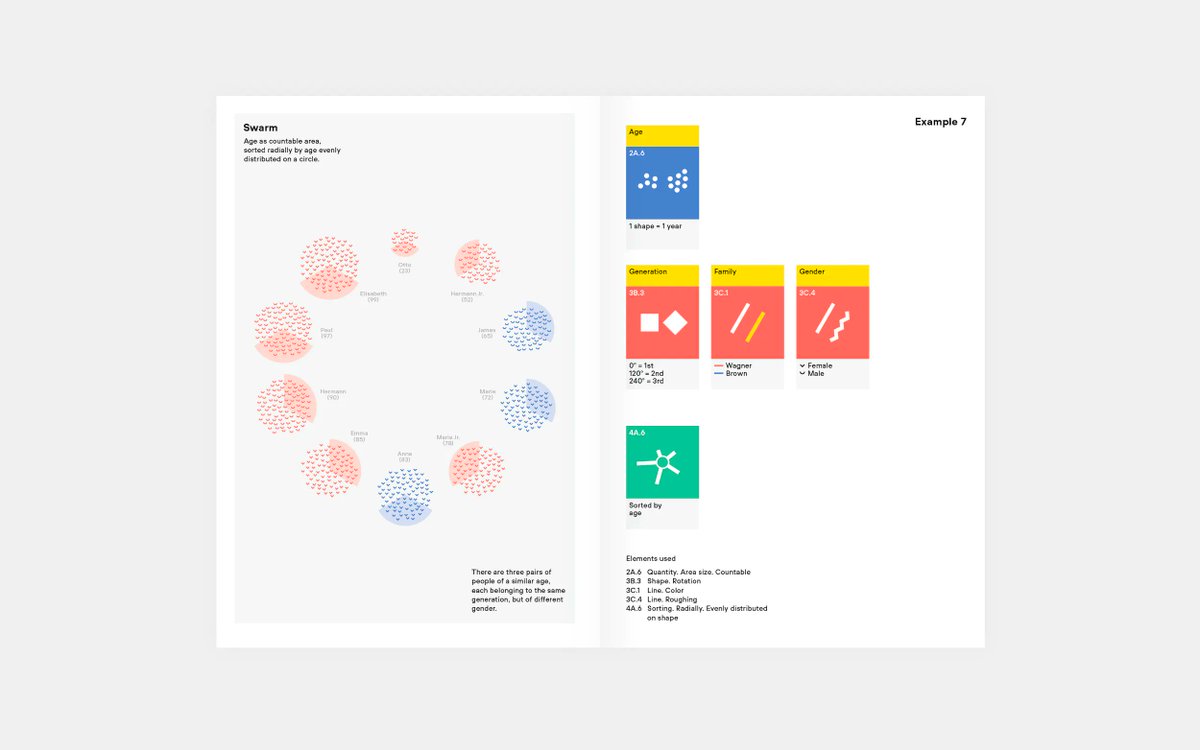
Great to see #modularinformationdesign examples
12 Sep 2022

Military Spending in 2021 - here's my late #MakeoverMonday submission for week 35. Another #DorlingCartogram - a fine example of #ModularInformationDesign, showing stark disparity between countries and regions in military spending
On @tableaupublic at public.tableau.com/views/spe…
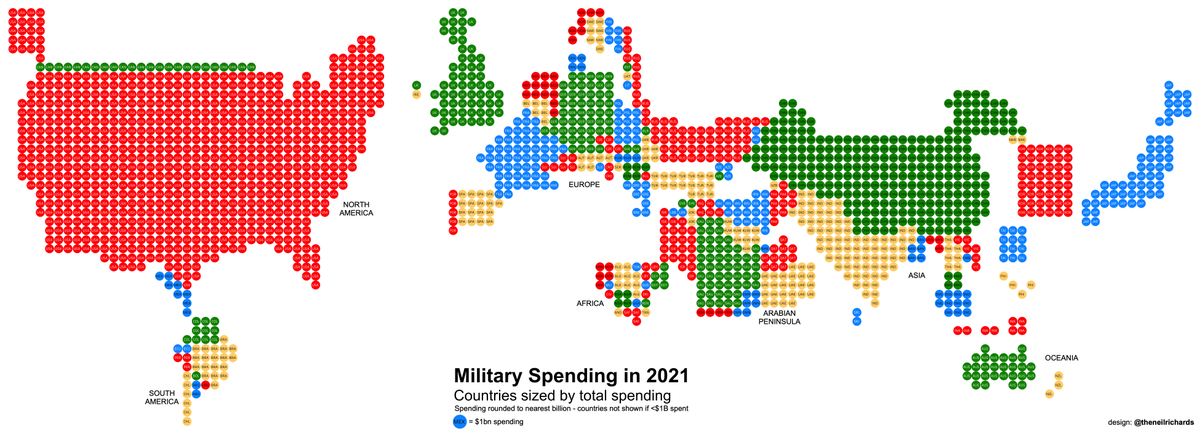
ALT Darling Cartogram - Military Spending in 2021
1
3

12 Sep 2022
Military Spending in 2021 - here's my late #MakeoverMonday submission for week 35. Another #DorlingCartogram - a fine example of #ModularInformationDesign, showing stark disparity between countries and regions in military spending
On @tableaupublic at public.tableau.com/views/spe…
ALT Darling Cartogram - Military Spending in 2021
1
8
43
11 Sep 2022
I am proud to have been keynote speaker at this great conference. Thank you.#modularinformationdesign #visualizingcomplexity
11 Sep 2022

The best possible conclusion. Thank you to everyone who came to #2CO3: if it was two intense beautiful days of #design #conference, in #Alghero, thanks to your enthusiasm and your participation. We will miss you !

3
29 Aug 2022
Wow, thank you for this great review and for even testing #modularinformationdesign yourself! So happy you were inspired to work with the #mid system!
1
3
22 Aug 2022
Wow. These look great! So happy to see you using the #modularinformationdesign for your @tableaupublic visualizations!
1
1
17 Aug 2022
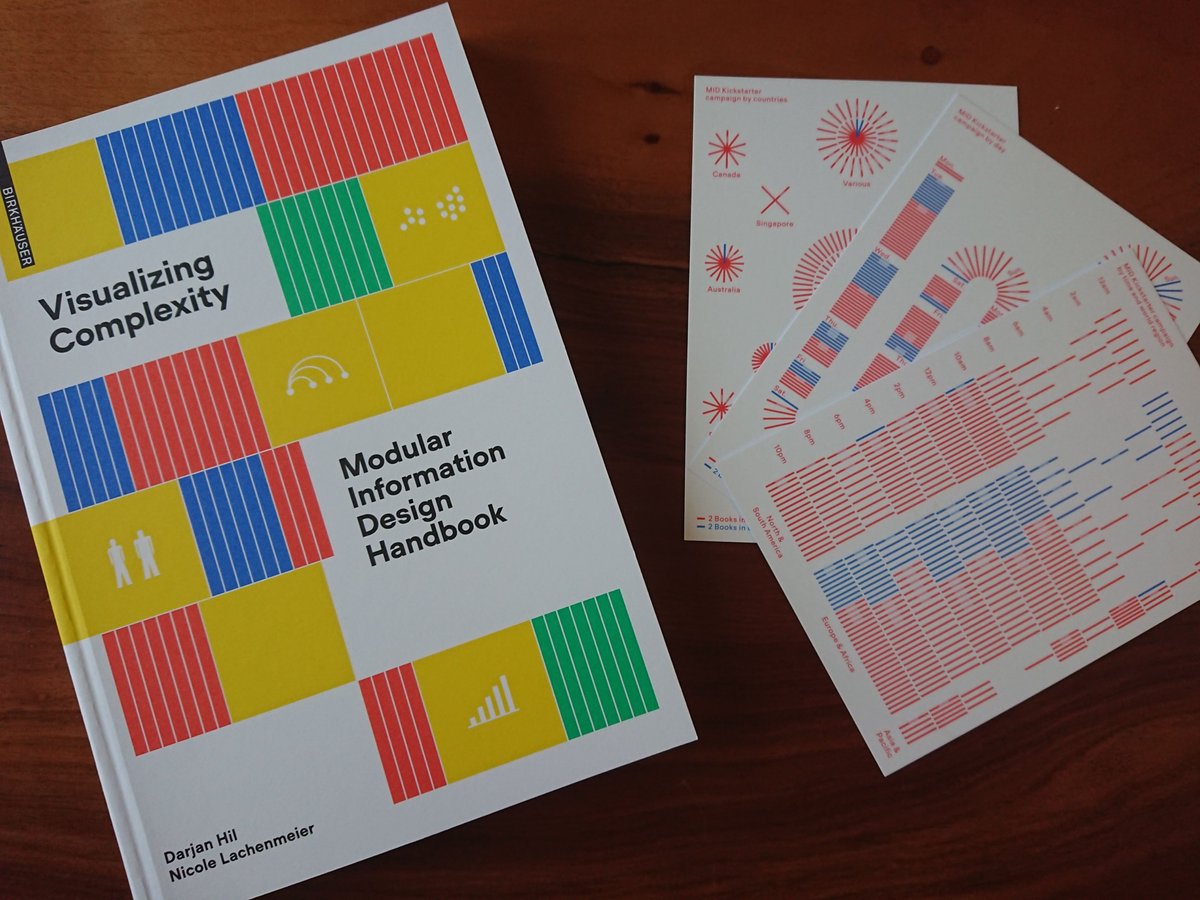
We made these #dataviz postcards with #modularinformationdesign for our lovely @kickstarter backers to share some nice insights into the #visualizingcomplexity book campaign.
P.s the best time to sell is 10 am and 10 pm
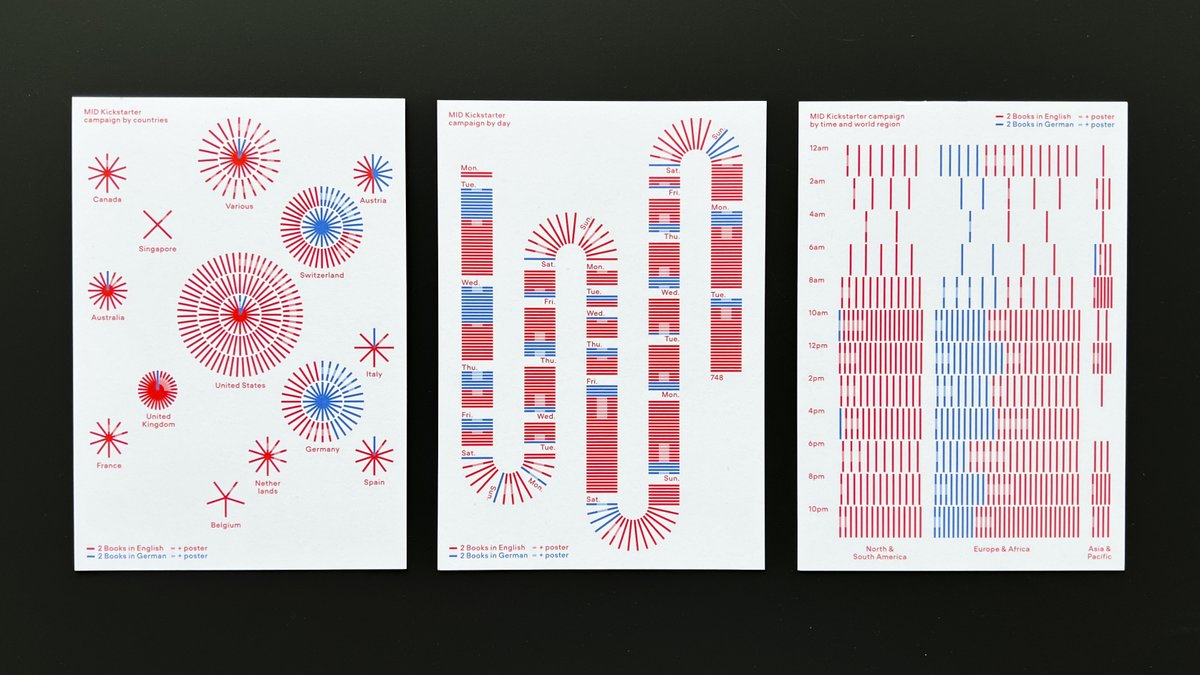
ALT Three #dataviz #modularinformationdesign postcards based on the data from the kickstarter campaign we made for the book "Visualizing Complexity – Modular Information Design Handbook"
1
2
22
25 May 2022
Save the date. At the next @onDataAndDesign online event on the 23rd of June, at 6 pm CET, I will present our book "Visualizing Complexity–Modular Information Design Handbook".
Hope to see you👉 eventbrite.ch/e/on-data-and-…
#visualizingcomplexity #modularinformationdesign #dataviz

25 May 2022
Look what cool stuff I got!
@superdot_studio @NicoleLachen @DarjanHil
#dataviz #mid #modularinformationdesign #dataexperience
One question about the postcards though: is one line 2 books or 6 books? Slightly confused ;-)
Looking forward to actually checking out the content!
2

24 May 2022
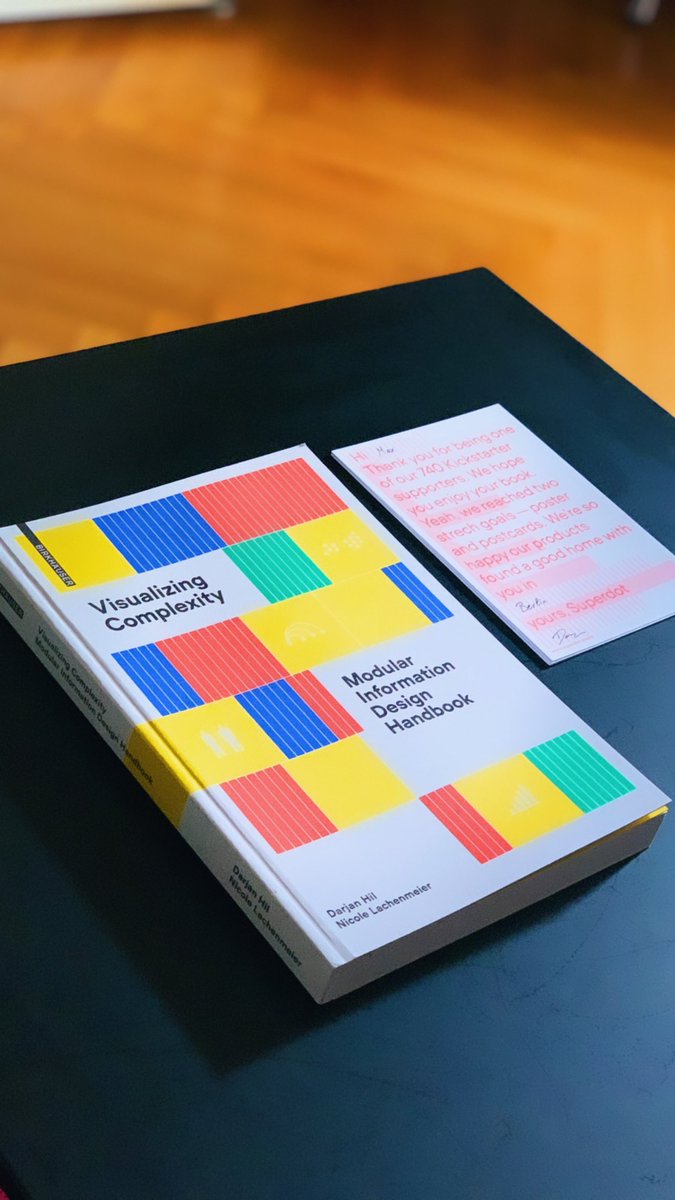
Another special delivery today!📦
Just got my copy of Visualizing Complexity by @superdot_studio!🇨🇭
Brilliant work done by @NicoleLachen & @DarjanHil 🙏
#dataviz #mid #modularinformationdesign #dataexperience #visualgrammar #Kickstarter
1
1
13
17 May 2022
🟡🔵🔴🟢 We have started packing all the books and additional products and the first ones are already on their way to you! 🟡🔵🔴🟢 @superdot_studio
#modularinformationdesign #mid #dataviz #visualizingcomplexity
3
7 Apr 2022
We are super happy that the book went to the printers this week. The final sprint took a lot out of us, but it was worth it. As a team, we can hardly believe that this phase is over now. Our excitement couldn't be greater. #modularinformationdesign #mid #visualizingcomplexity

1
4
20 Jan 2022
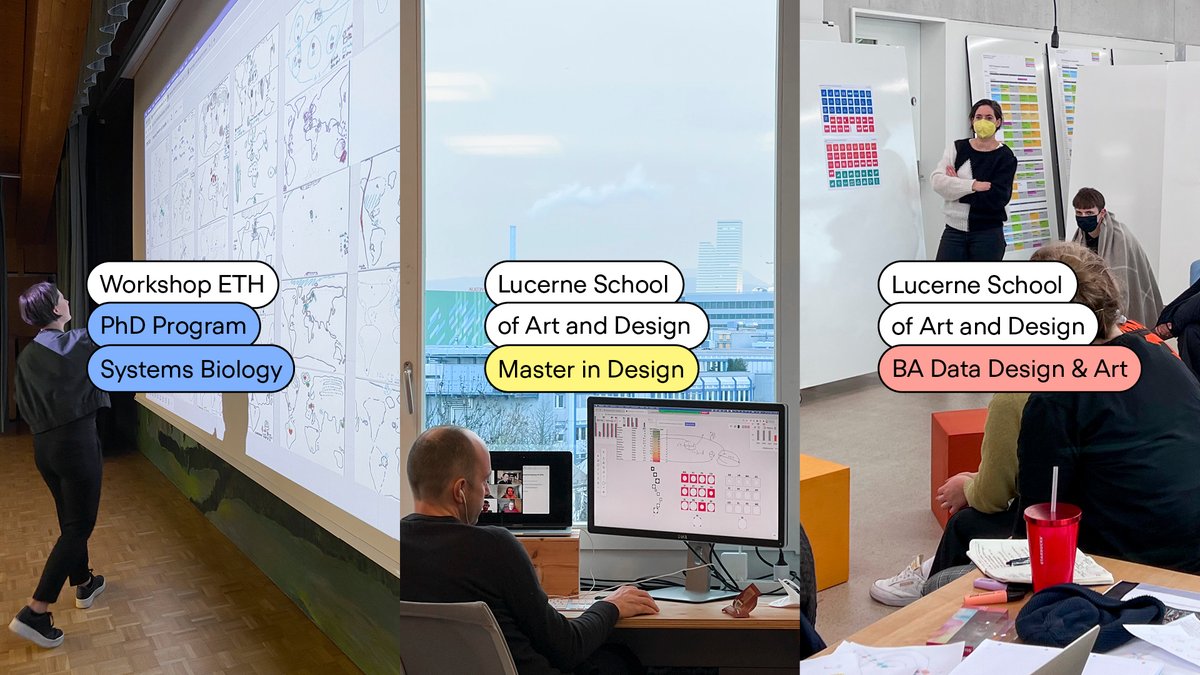
We are very committed to passing on our knowledge to the next generation. Within a few weeks in 2021, we taught in five different courses #datavisualization for #posterdesign, for #UXUI and the general principles of #modularinformationdesign. Thank you.
@ETH @hslu @FHNWbusiness
1
15
2 Dec 2021
Yay! We are approaching the first #Kickstarter #StrechGoal!!! You can help us to reach it by inviting your friends to join the campaign so everyone will get a free extra product. 👉 kck.st/3nCRgC2
#visualizingcomplexity #informationdesign
#modularinformationdesign #mid

24 Nov 2021
🙏 Early Bird packages of our «Visualizing Complexity» book on Kickstarter are already sold out! 🙏 🙏 🙏kck.st/3nCRgC2
#mid #informationdesign #modularinformationdesign