
26 May 2023
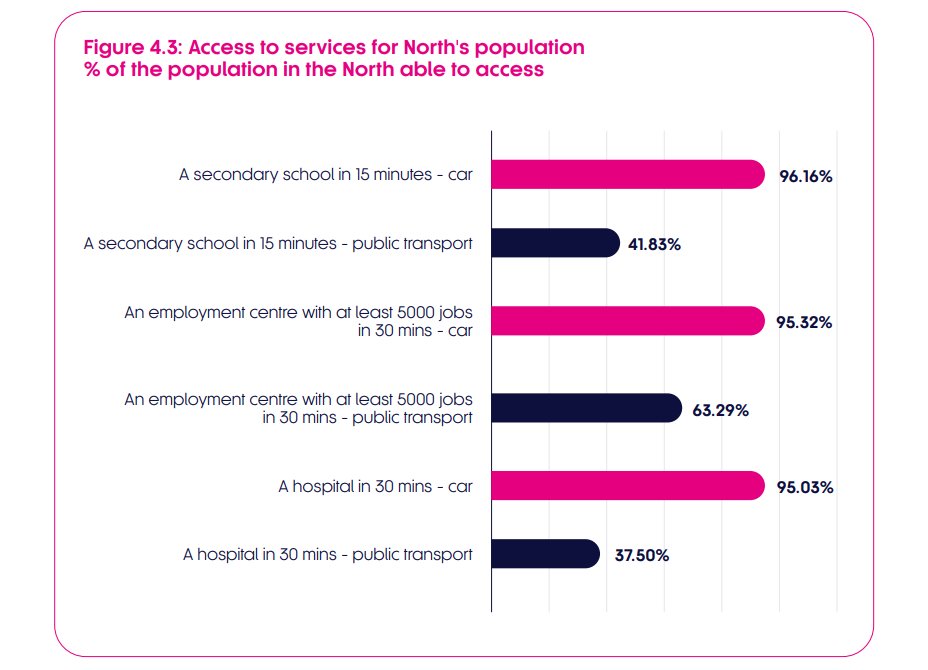
CHART OF THE WEEK: Lifting the region's economic and social performance is critical to unlock the North's potential.
But the #connectivity challenges on our current #transport network must be addressed if we are to achieve our 2050 vision. [1/3] #NorthernStats
1
2
2
706
19 May 2023
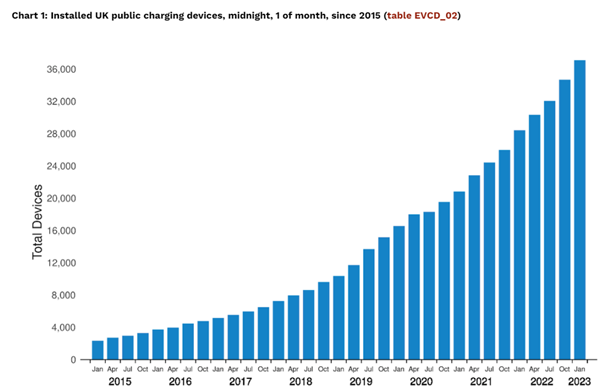
CHART OF THE WEEK: @transportgovuk figures show that as of January 2023 there were 37,055 public #ElectricVehicle charging devices installed in the UK.
The chart below shows the growth since 2015.
#NorthernStats [1/4]
1
1
3
2,606
14 Apr 2023
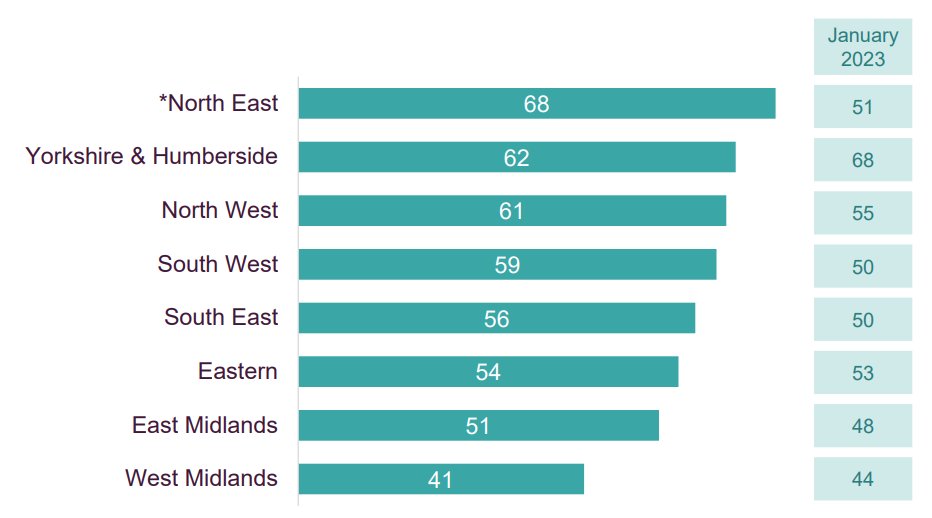
CHART OF THE WEEK: A recent @TransportFocus report showed awareness and use of the £2 #bus fare cap is higher in the three regions of the North than the rest of England.
This has increased significantly since January 2023 and is highest in the North East. #NorthernStats
1
1
1
877
10 Mar 2023
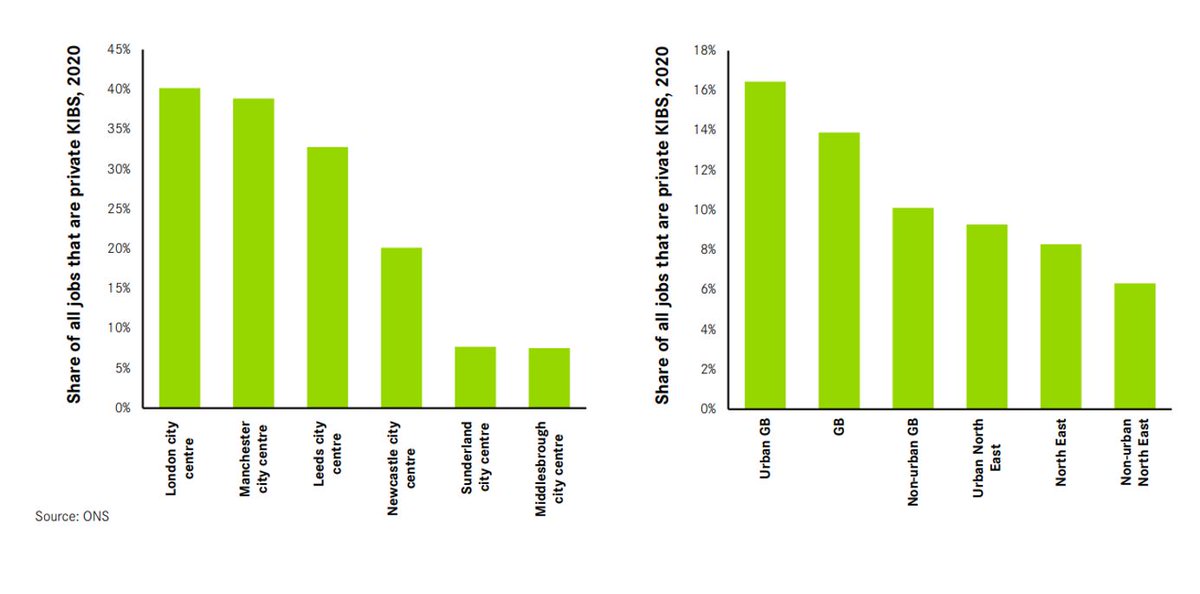
CHART OF THE WEEK: City centre underperformance is an issue for Northern cities, particular for those in the #NorthEast.
#Newcastle, #Sunderland and #Middlesbrough all trail behind London and Northern cities such as #Manchester and #Leeds. #NorthernStats [1/4]
2
4
11
28,981
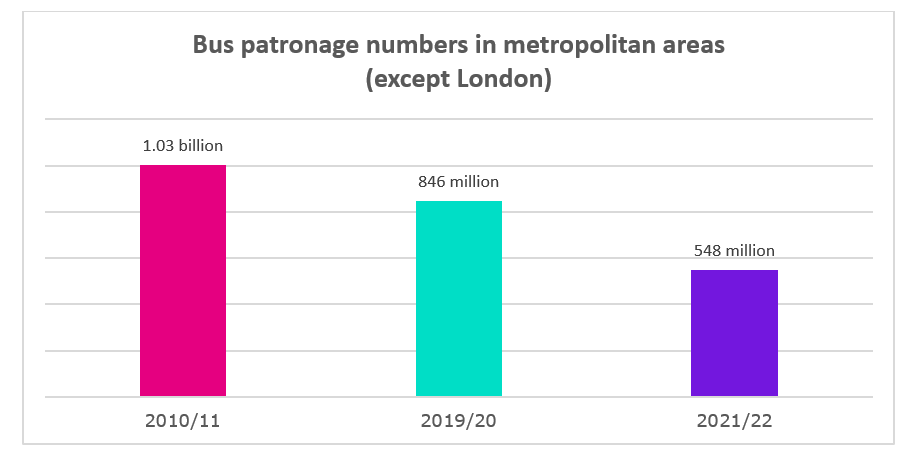
17 Feb 2023
CHART OF THE WEEK: Latest government statistics have shown the number of bus journeys in metropolitan areas outside of London are continuing to fall. This comes as the Bus Recovery Grant is set to end in March, which could see vital #bus services cut [1/3] #NorthernStats
1
2
5
1,889
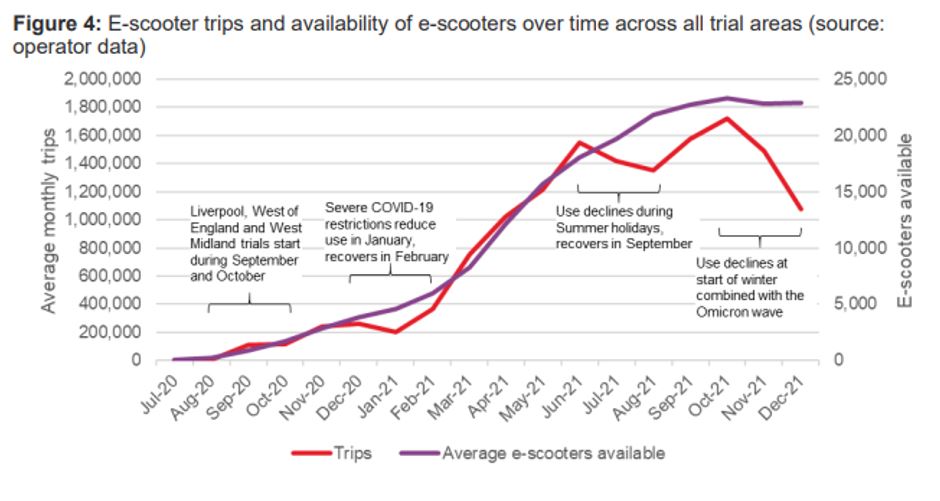
3 Feb 2023
CHART OF THE WEEK: Evidence from trials of #Escooters across the UK, including 10 sites in the North, shows up to 1.7 million trips were taken a month on around 23,000 scooters.
The average trip was slightly longer than an average walking trip, at 2.2km. [1/3] #NorthernStats

2
3
4
1,587
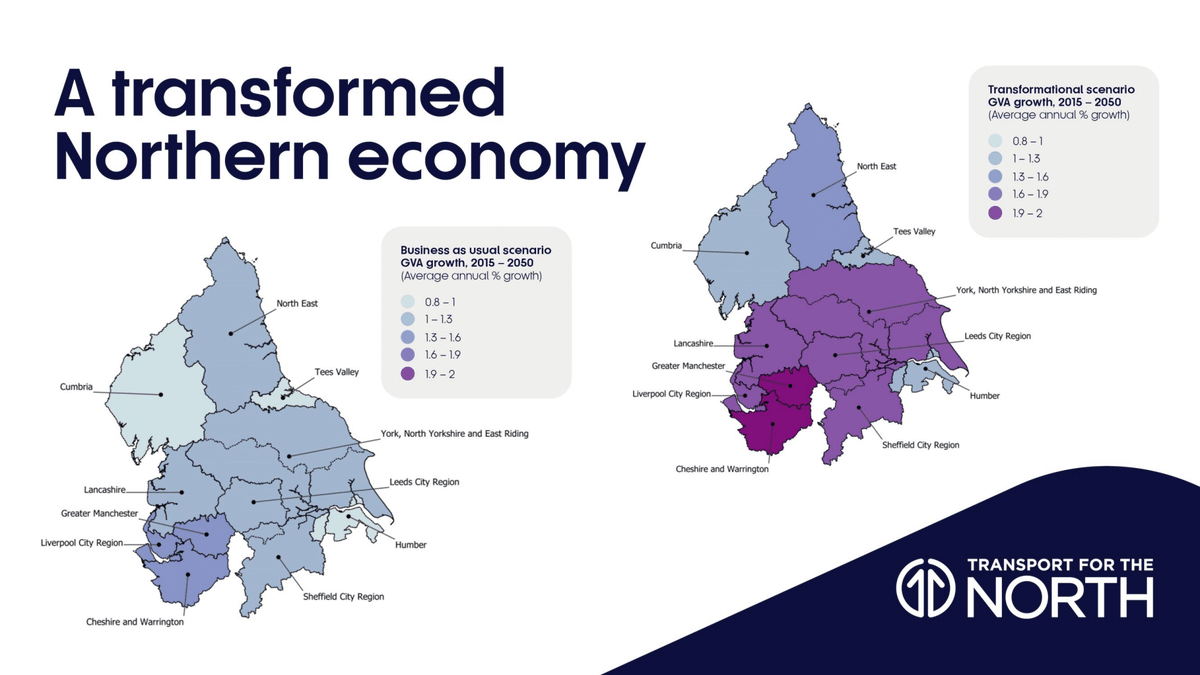
27 Jan 2023
CHART OF THE WEEK: Inclusive growth across the North would ensure all people and communities can contribute towards, and benefit from, a transformed Northern economy.
Our transformational scenario shows greater % growth across all regions of the North by 2050. #NorthernStats
5
5
9
2,914
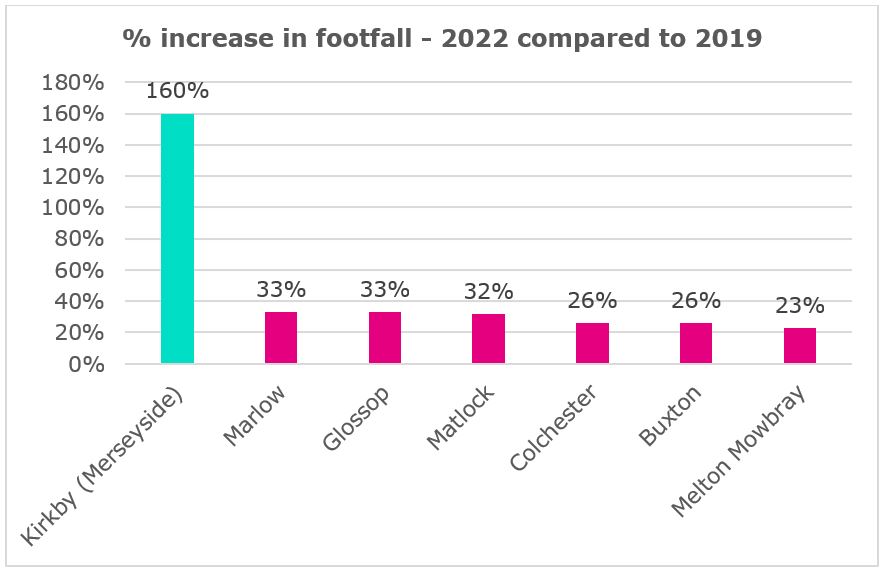
6 Jan 2023
CHART OF THE WEEK: Data shared by @BBCNews shows some towns across the UK have seen large increases in footfall compared to pre-pandemic levels.
In the North, #Kirkby, with shops, offices, and housing in easy walking distance, performed particularly well.
#NorthernStats [1/3]
1
1
6
1,666
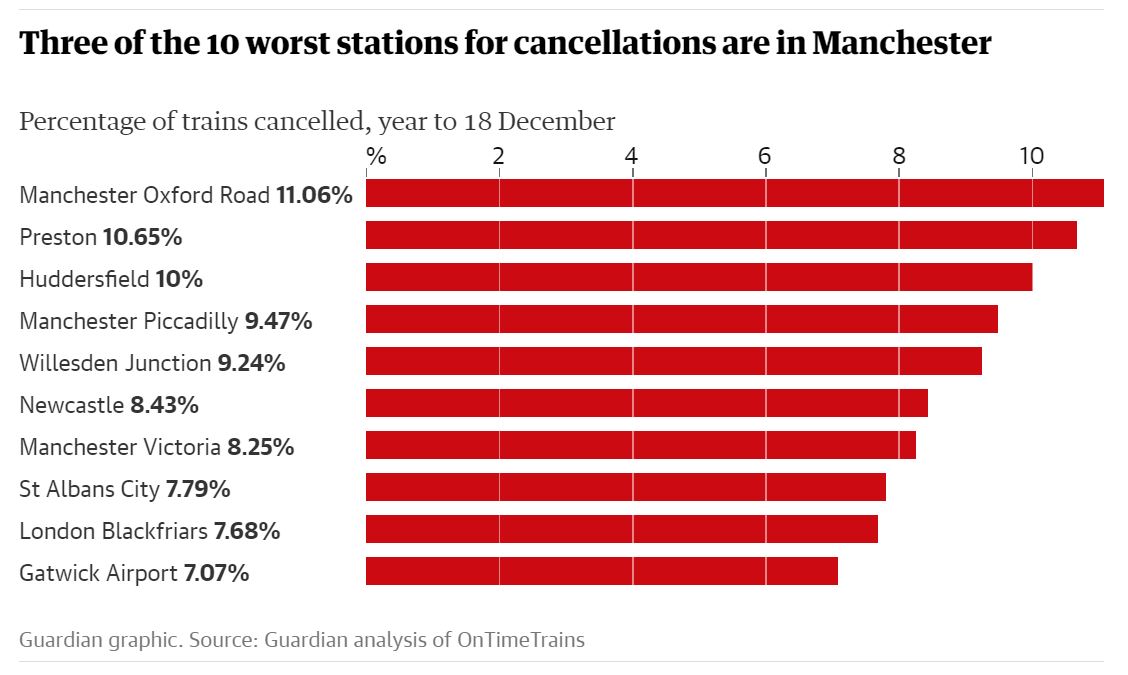
30 Dec 2022
CHART OF THE WEEK: #Rail delay and cancellation data analysis by @guardian this week found #Manchester Oxford Road was the worst performing of Great Britain's 100 busiest stations, in terms of the severity of delays experienced by passengers.
#NorthernStats [1/2]
3
8
13
5,992
23 Dec 2022
CHART OF THE WEEK: From January, the whole of England will see a 3-month £2 bus fare cap for a single journey.
It follows a similar cap in some of our major city regions.
This will reduce the average £2.80 fare, boosting the attractiveness of bus travel. #Northernstats [1/3]

1
2
2
1,672
2 Dec 2022
CHART OF THE WEEK: @railandroad recently published their Estimates of Station Usage for 2021-22, showing #Manchester Piccadilly to be the North's busiest train station, followed closely by #Leeds.
Both stations had almost 20 million entries and exits.
#NorthernStats [1/3]

2
1
6
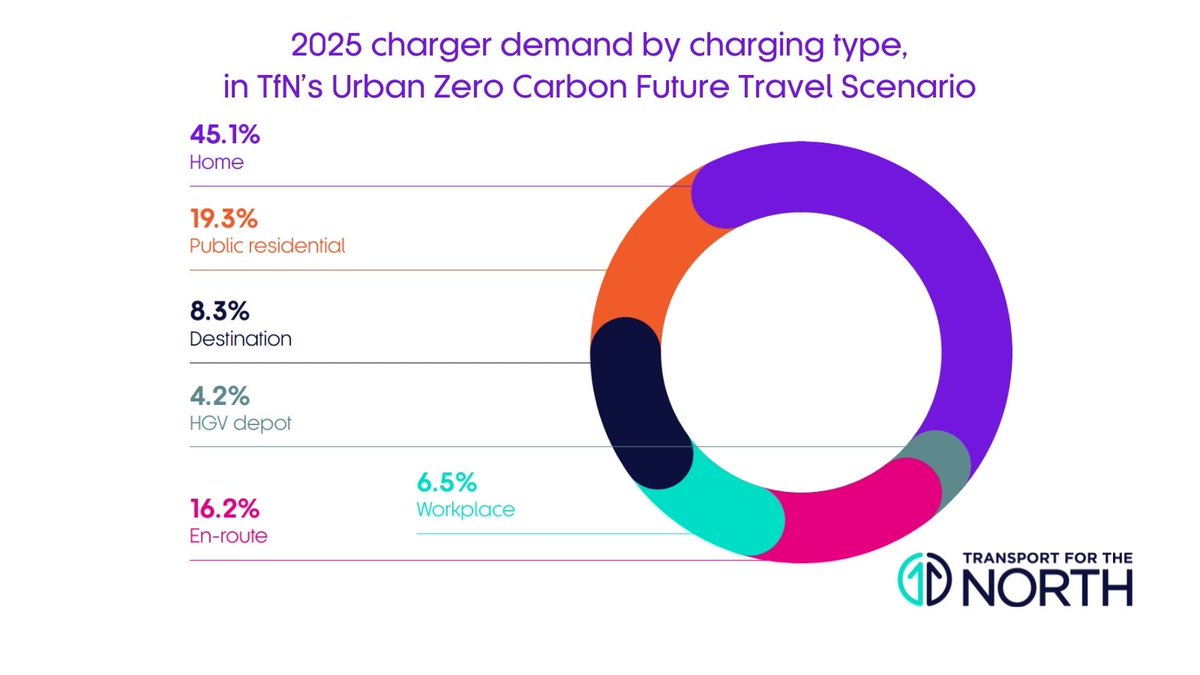
18 Nov 2022
CHART OF THE WEEK: Our analysis forecasts that as much as 56.9% of #ElectricVehicle charging infrastructure in the North may need to be at en-route sites, lorry depots, and workplaces - providing flexible charging solutions for all types of journeys. #Northernstats [1/3]
1
2
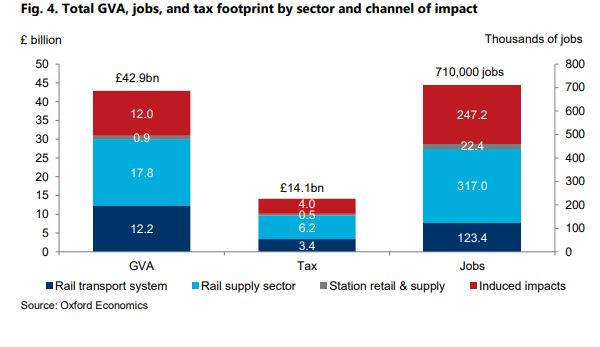
4 Nov 2022
CHART OF THE WEEK: Research for @railindustry highlights the positive impact of #rail in the UK and how investment can boost this further.
Rail connects people and places, enables social mobility, reduces #CO2 emissions, and supports a diverse supply chain. #NorthernStats [1/3]
1
1
4
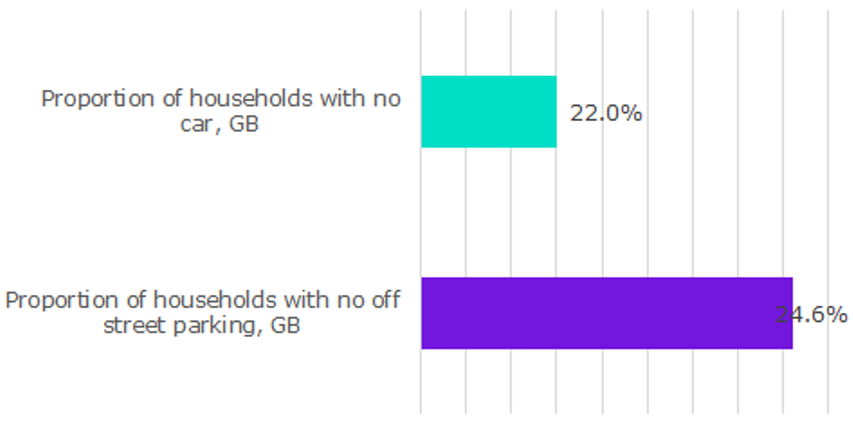
21 Oct 2022
Research by @CREDS_UK shows well-designed policies to #decarbonise energy and #transport can help low income families benefit from lower fuel bills.
This targets people with no car, those struggling with fuel costs, or have no off-street parking facilities.
#NorthernStats [1/3]
1
2
3
7 Oct 2022
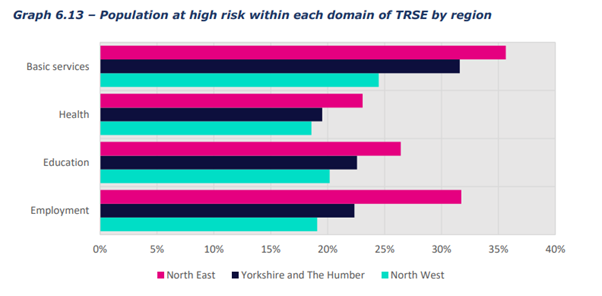
CHART OF THE WEEK: Our research on transport and social exclusion shows the North's residents are particularly exposed to a lack of access to basic services like shops and pharmacies.
It's vital #transport focuses on all journeys, and not just commutes to work. #Northernstats
1
3
23 Sep 2022
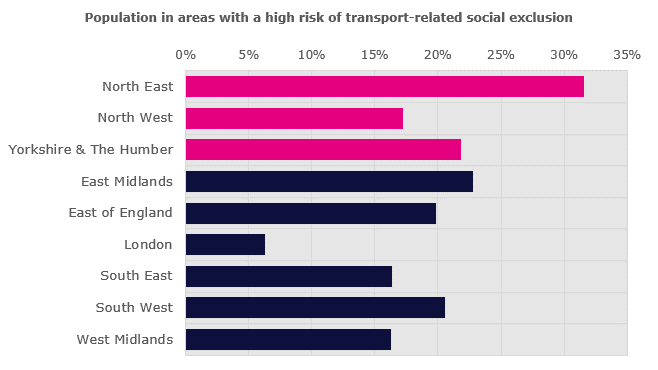
CHART OF THE WEEK: Our latest research shows 21.3% of people in the North live in areas with a high risk of social exclusion because of #transport problems.
The #NorthEast has by far the highest level of risk of any region in England. #NorthernStats
👉 ow.ly/NsAe50KO70i
1
2
1
19 Aug 2022
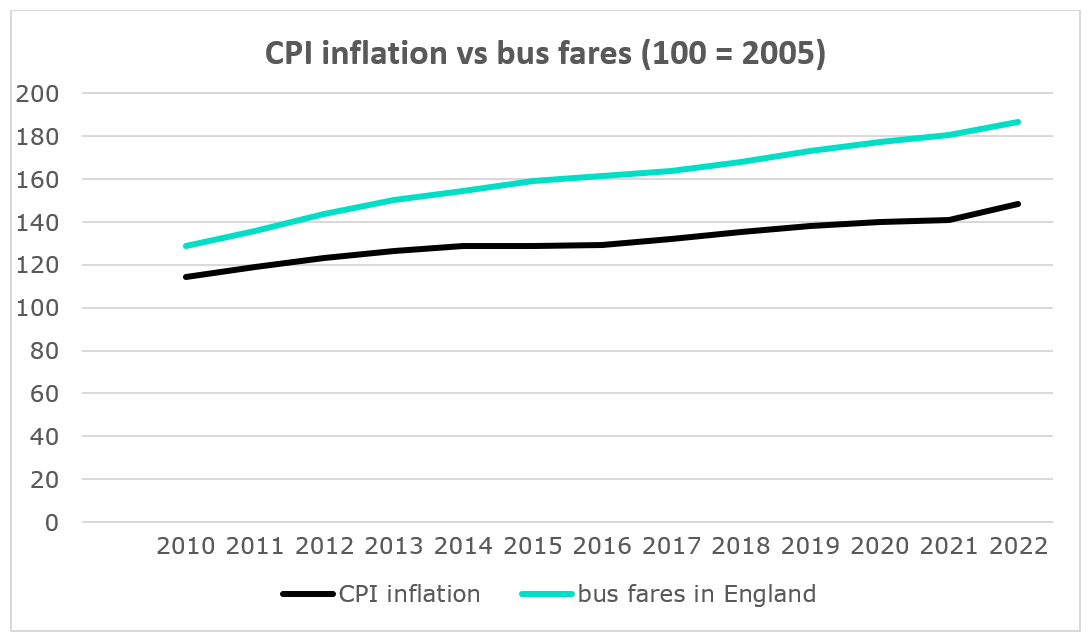
CHART OF THE WEEK: This week, Transport Secretary @grantshapps put forward plans to cap #busfares at £2 per journey for 12 months.
This could provide some welcome relief against #inflation with bus fares rising above the rate over the last decade. #NorthernStats [1/3]
1
1
3
29 Jul 2022
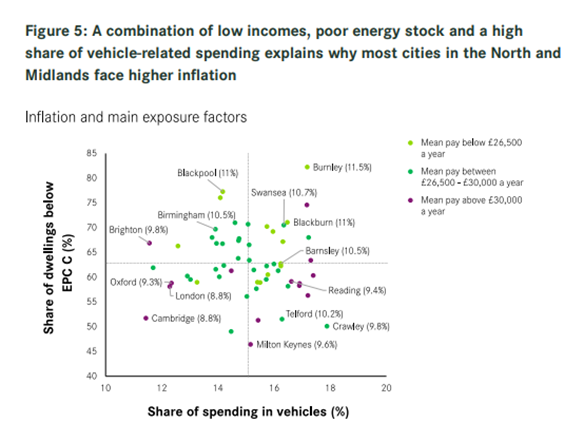
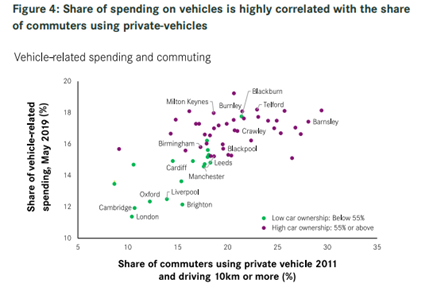
CHART OF THE WEEK @CentreforCities research
finds the cost-of-living crisis is hitting the North particularly hard. Largely due to vehicle & heating expenses. In highly car-dominated areas, running a car costs up to 20% of average incomes #NorthernStats
centreforcities.org/wp-conte…
5
5
24 Jun 2022
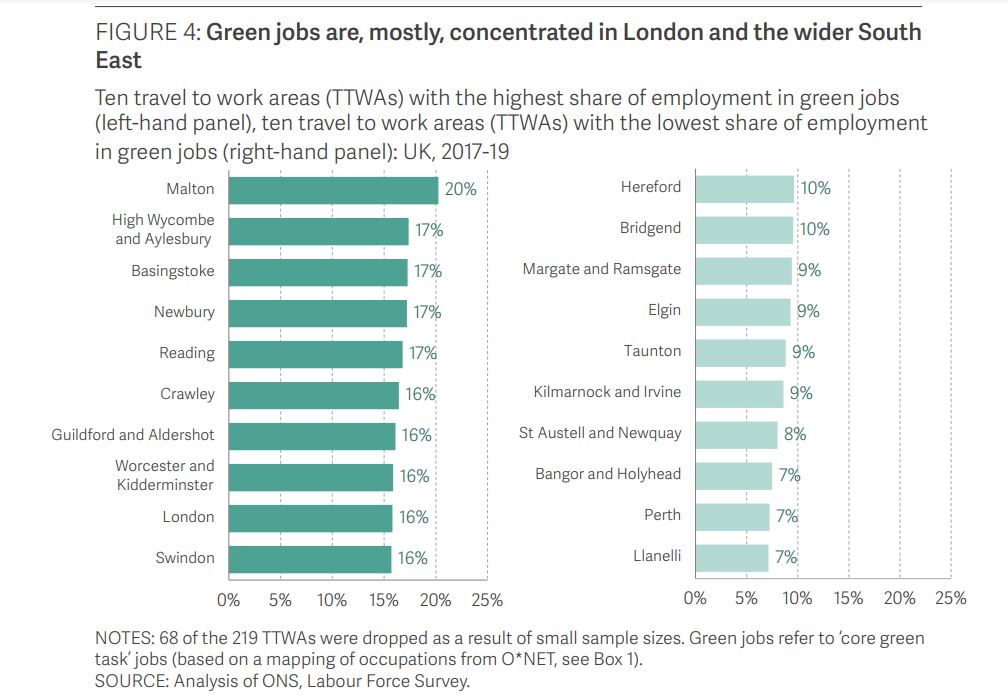
CHART OF THE WEEK: Latest research from the @resfoundation shows 'green jobs' are currently concentrated in London and the South East, although #Malton, in #NorthYorkshire, is top of the pack, with its innovative food technology and energy cluster. #NorthernStats [1/3]
1
1
2
10 Jun 2022
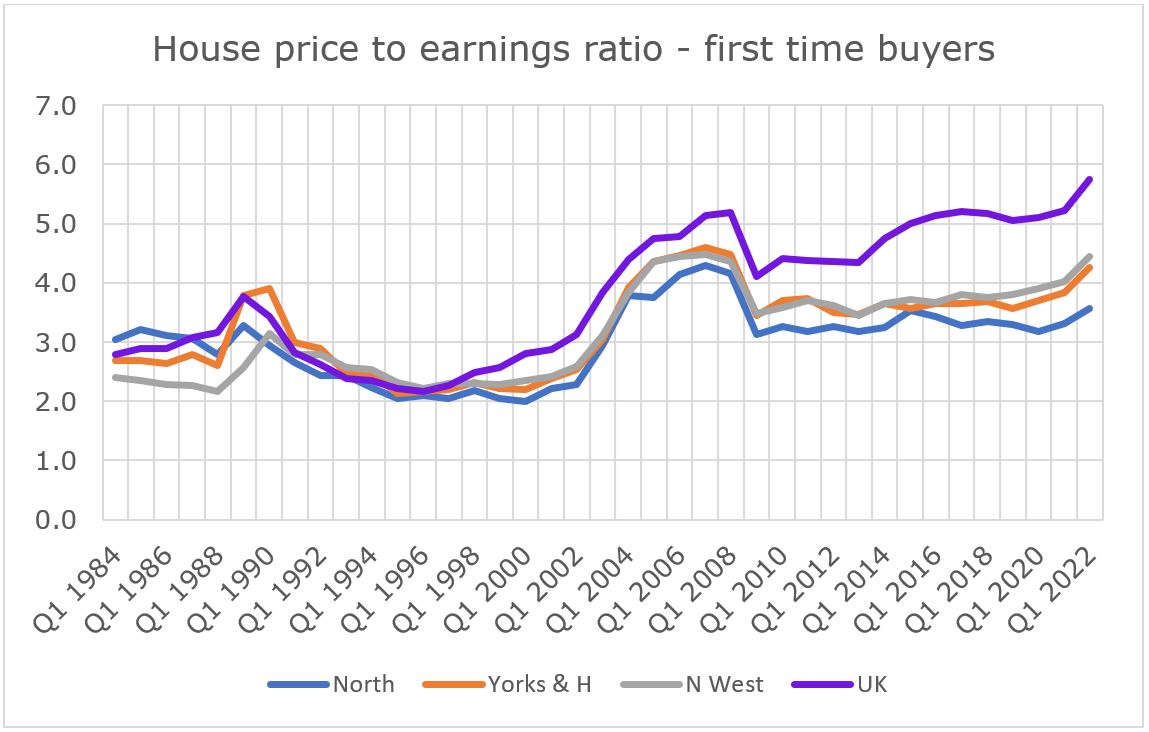
CHART OF THE WEEK: #Housing affordability (house price to earnings) for first time buyers in the North continues to decrease, according to Nationwide.
The gap between the North and the UK average remains significant, boosting quality of life in the region. #NorthernStats [1/3]
1
1
2