
May 17
hi hi! open joki jasa olah data xrd pake originpro sama software match bisa dm atau @ yaa ☝🏻#zonauang #jokitugas
2
384

Apr 20
Microsoft Excel vs OriginPro vs MATLAB:
Which of these Should Graduate Students Use for Data Analysis and Graphing?
For graduate students, analyzing data and presenting results clearly are essential parts of research.
Whether you are working on a thesis, dissertation, or publication, choosing the right software for data analysis and graphing can save you time and improve the quality of your work.
Three popular tools used in academia are Microsoft Excel, OriginPro, and MATLAB. Each has its strengths and limitations, and the right choice often depends on your research needs, level of experience, and type of data.
1. Microsoft Excel: Simple and Accessible.
Microsoft Excel is often the first data analysis tool students encounter. It’s part of the Microsoft Office suite and is widely available across institutions.
Excel is user-friendly, making it great for beginners. It can handle basic data organization, descriptive statistics, and simple charts such as bar graphs, scatter plots, and line charts.
For small datasets or quick analyses, Excel is convenient. Functions like AVERAGE, STDEV, and CORREL help perform basic statistical tests. The Data Analysis ToolPak add-in even allows for regression, ANOVA, and t-tests.
However, Excel has its limits. It struggles with large datasets or complex analyses, and it lacks advanced scientific graphing options. While suitable for coursework or simple lab reports, it may not be ideal for high-level research that requires precision and automation.
Best for: Beginners, small datasets, and quick visualizations.
2. OriginPro: Professional Scientific Graphing and Analysis.
OriginPro is designed specifically for researchers and scientists. It combines data analysis with advanced graphing capabilities.
OriginPro supports nonlinear fitting, signal processing, curve fitting, and statistics, all in one environment.
Its biggest strength lies in its publication-quality graphs. You can create highly detailed, professional plots such as contour maps, 3D surfaces, and multi-axis charts with just a few clicks. It also allows easy customization of fonts, colors, and layouts to meet journal requirements.
Compared to Excel, OriginPro handles larger datasets and provides tools for automation through scripting (Origin C or Python).
However, it is a paid software, and new users might need time to get familiar with its interface.
Best for: Graduate students who want professional-quality graphs and advanced analytical tools.
3. MATLAB: Advanced Data Processing and Computation.
MATLAB is a powerful computing platform used for mathematical modeling, simulations, and data analysis.
It’s ideal for engineering, physics, and computational science students who work with large datasets or require algorithm development.
MATLAB allows users to write scripts for custom data processing, which makes it incredibly flexible. Its toolboxes (such as Signal Processing, Statistics, or Machine Learning) enable advanced analyses beyond what Excel or OriginPro can do.
Graphs in MATLAB are also highly customizable, though they require some programming knowledge.
The main drawback is that MATLAB has a steeper learning curve and may be overkill for students needing only basic statistics or plotting.
Best for: Students in STEM (engineering, physics, etc) or data-heavy research fields needing complex analysis.
Recommendation:
Use Excel for quick, simple analyses and when ease of use matters most.
Choose OriginPro if you need high-quality graphs and versatile data analysis tools for publication.
Go for MATLAB if your research involves programming, large datasets, or mathematical modeling.
Each software serves a unique purpose and mastering even one of them can make your research analysis smoother, faster, and more professional.
Which of the three do you like most and why?

6
3
19
689

Apr 19
Gracias ruso por sus paginas piratas de sus pagina baje cosas como originpro y pdf. De paso también gtadesco a los persas.
3
327

Mar 19
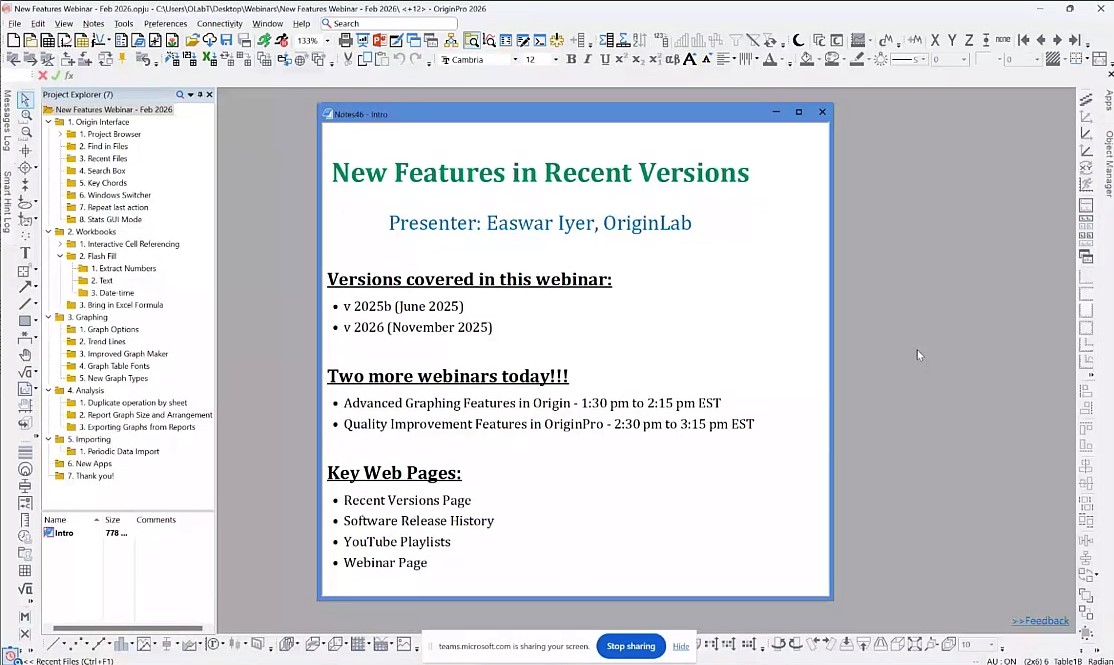
Catch up with some key features in recent versions of OriginPro in this public webinar youtu.be/JlrG2G5FC4c, such as Project Browser, Search box, Repeat last action, interactive cell reference in Formula, Flash fill, Graph Maker, etc.
Learn more and download a free trial at originlab.com/2026
#originpro2026 #OriginPro #originlab #DataAnalysis #DataVisualization #scientificgraphing
1
2
111
Mar 9
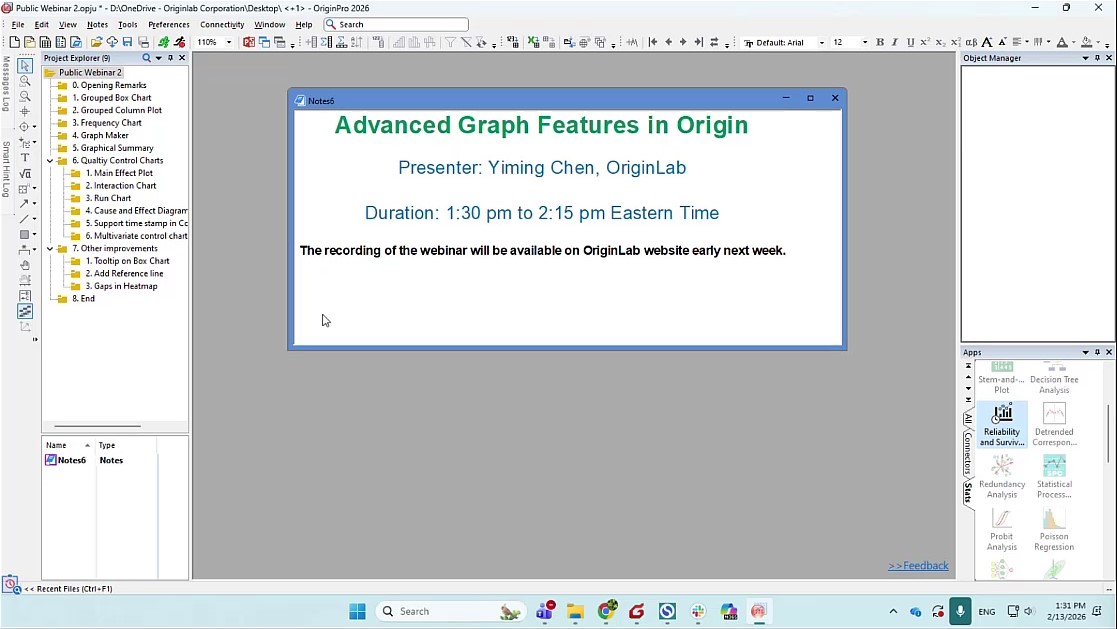
We hosted an Advanced Graphing Features in Origin webinar youtu.be/G4kKPM_jYYI based on Origin 2026 recently.
You can download the project file in webinar from originlab.com/index.aspx?go=…
2026. Learn more and download a free trial at originlab.com/2026
#originpro #originpro2026 #originlab #DataAnalysis #DataVisualization
1
2
233

MATLAB ini aplikasi ngolah data kah? Gak kenal soalnya kampus pake OriginPro (tp gw pake python aja 😂)
2
485

Mar 4
Macbook tdk bs diinstal software saintifik atau engineering kayak: OriginPro, Aspen Hysis, Chemcad, dll.. So laptop Windows masih menang di bidang ini. 🤷🏻♂️
5
86
12,668

مجموعة دعم الكتابة الأكاديمية PhD
FFPR / Transfer
Word – Excel – OriginPro – Referencing – AI
حلول سريعة لمشاكل البرامج توجيه لاستخدام الذكاء الاصطناعي أكاديمياً.
Microsoft Teams للانضمام:
cnmq@leeds.ac.uk
bhpm6914@leeds.ac.uk
@SaudisinLeeds

1
15
2,472
Feb 4
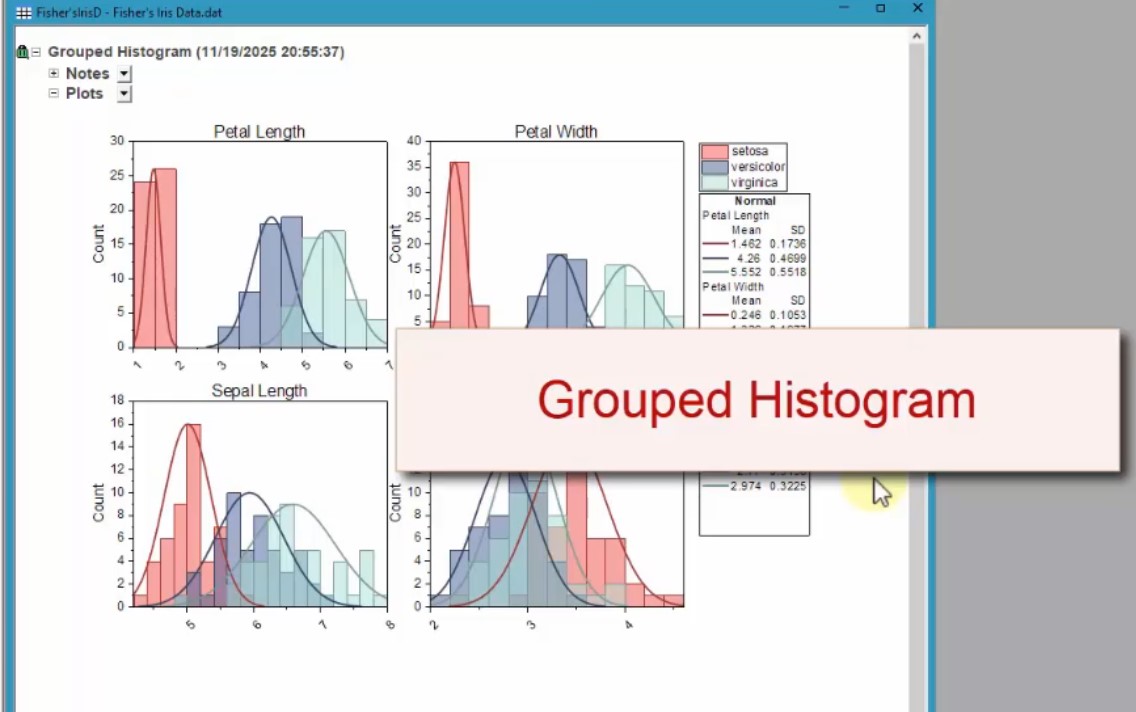
Origin 2026 added Grouped Histogram with distribution curve for each group. youtu.be/gN7G3CV0GCU The plots can be arranged as separate graphs or as one graph with multiple panels. Graphs all in same book as source data for easy management an modification
Learn more and download a free trial at originlab.com/2026
#originpro2026 #OriginPro #originlab #DataAnalysis #DataVisualization #scientificgraphing #statistics #histogram #distribution
2
112
Jan 5
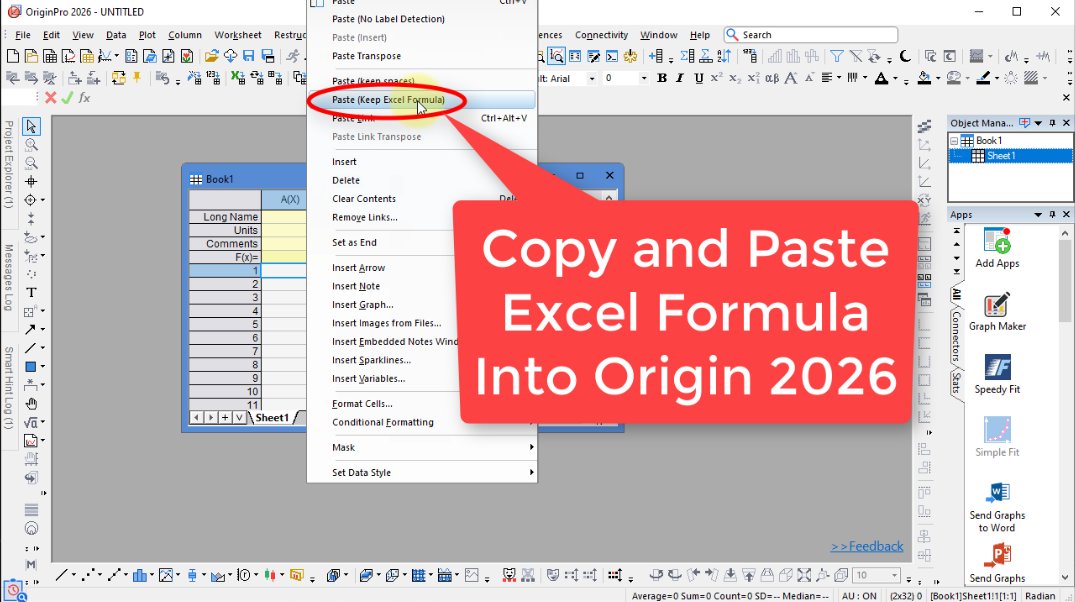
Now you can bring in cell formula from Excel to Origin to continue with your calculations youtu.be/9hIrW8PWl7k and then create your publication-quality graphs and perform advanced analysis operations. This also works for google sheet formula by Ctrl C and Ctrl V.
Note: This isn't turned on in German Origin 2026 sr0 since we don't support localized excel formula in German.
Learn more and download a free trial at originlab.com/2026
#originpro2026 #excelformulas #datahandling #datacalculation #originpro #originlab #DataAnalysis #DataVisualization
2
133
24 Nov 2025
Origin and OriginPro 2026 now available! New features include Flash Fill and Smart Formula, Find in Project Files, Bring in Cell Formula from Excel into Origin, Periodic Refresh for Data Import, Repeat Last Action and Duplicate Operation, New Graph Maker, Graphical Summary for Descriptive Statistics.
Learn more and download a free trial at originlab.com/2026
Related video:
youtu.be/8bkf1J6G6K4
#scientificgraphing #statistics #OriginPro #Originpro2026 #originlab #DataAnalysis #DataVisualization
2
4
1,007
7 Nov 2025
Generated with
Pix 1: Microsoft Excel
Pix 2: OriginPro 2024
Pix 3: MATLAB 2024
Which is your favourite?

1
1
2
191
7 Nov 2025
Data Analysis and Graphing with MS Excel vs OriginPro vs MATLAB: Which Should Graduate Students Use?
For graduate students, analyzing data and presenting results clearly are essential parts of research.
Whether you are working on a thesis, dissertation, or publication, choosing the right software for data analysis and graphing can save you time and improve the quality of your work.
Three popular tools used in academia are Microsoft Excel, OriginPro, and MATLAB. Each has its strengths and limitations, and the right choice often depends on your research needs, level of experience, and type of data.
1. Microsoft Excel: Simple and Accessible.
Microsoft Excel is often the first data analysis tool students encounter. It’s part of the Microsoft Office suite and is widely available across institutions.
Excel is user-friendly, making it great for beginners. It can handle basic data organization, descriptive statistics, and simple charts such as bar graphs, scatter plots, and line charts.
For small datasets or quick analyses, Excel is convenient. Functions like AVERAGE, STDEV, and CORREL help perform basic statistical tests. The Data Analysis ToolPak add-in even allows for regression, ANOVA, and t-tests.
However, Excel has its limits. It struggles with large datasets or complex analyses, and it lacks advanced scientific graphing options. While suitable for coursework or simple lab reports, it may not be ideal for high-level research that requires precision and automation.
Best for: Beginners, small datasets, and quick visualizations.
2. OriginPro: Professional Scientific Graphing and Analysis.
OriginPro is designed specifically for researchers and scientists. It combines data analysis with advanced graphing capabilities.
OriginPro supports nonlinear fitting, signal processing, curve fitting, and statistics, all in one environment.
Its biggest strength lies in its publication-quality graphs. You can create highly detailed, professional plots such as contour maps, 3D surfaces, and multi-axis charts with just a few clicks. It also allows easy customization of fonts, colors, and layouts to meet journal requirements.
Compared to Excel, OriginPro handles larger datasets and provides tools for automation through scripting (Origin C or Python).
However, it is a paid software, and new users might need time to get familiar with its interface.
Best for: Graduate students who want professional-quality graphs and advanced analytical tools.
3. MATLAB: Advanced Data Processing and Computation.
MATLAB is a powerful computing platform used for mathematical modeling, simulations, and data analysis.
It’s ideal for engineering, physics, and computational science students who work with large datasets or require algorithm development.
MATLAB allows users to write scripts for custom data processing, which makes it incredibly flexible. Its toolboxes (such as Signal Processing, Statistics, or Machine Learning) enable advanced analyses beyond what Excel or OriginPro can do.
Graphs in MATLAB are also highly customizable, though they require some programming knowledge.
The main drawback is that MATLAB has a steeper learning curve and may be overkill for students needing only basic statistics or plotting.
Best for: Students in STEM (engineering, physics, etc) or data-heavy research fields needing complex analysis.
Recommendation:
Use Excel for quick, simple analyses and when ease of use matters most.
Choose OriginPro if you need high-quality graphs and versatile data analysis tools for publication.
Go for MATLAB if your research involves programming, large datasets, or mathematical modeling.
Each software serves a unique purpose and mastering even one of them can make your research analysis smoother, faster, and more professional.


3
9
28
1,267
17 Oct 2025
One of the most popular Apps Correlation Plot is improved and preinstalled in OriginPro 2025b if you choose Stats mode during installation. In case you didn't install Stats mode, you can download it manually from originlab.com/fileExchange/d…
#correlationplot #statistics #scientificgraphing #dataanalysis #DataVisualization #originpro2025b #originpro #originlab

1
114

6 Oct 2025
Here are some sports convictions i think you guys should check out.
▪️ Liverpool to top the premier league table by December 31st
▪️ Manchester United to secure top 10 by October 25
▪️ Barcelona to secure victory against olympiacos on October 21st
▪️ Galatasaray secures top 8 rank in 2025/2026 UCL league
If you're not on xo alpha, you can use this link to sign up: alpha.xo.market/markets
Special alpha code: XO-ORIGINPRO 🎫
Also follow @xomarket for more updates, see you on the leaderboard 👌🏿

51
36
261

6 Oct 2025
Finally got my invite code after the wait felt like forever 😊
Ready to dive in and let my conviction do the talking in the market.
I'm coming in hot, expect back to back bangers
Let’s f**kin go 💪
If you want in
Code: XO-ORIGINPRO
@xomarket x @OriginProtocol


Special alpha code for our friends over at @OriginProtocol
XO-ORIGINPRO 🎫
2
3
66

Special alpha code for our friends over at @OriginProtocol
XO-ORIGINPRO 🎫
11
9
38
2,224

3 Oct 2025
Te vas a ir de nalgas cuando veas lo que puedes hacer en OriginPro.
5
736

23 Sep 2025
Sankey plot. Pakai originPro bisa. R package juga ada.
1
3
654
