
29 Oct 2025
🎨 Data meets design with the MoMA.
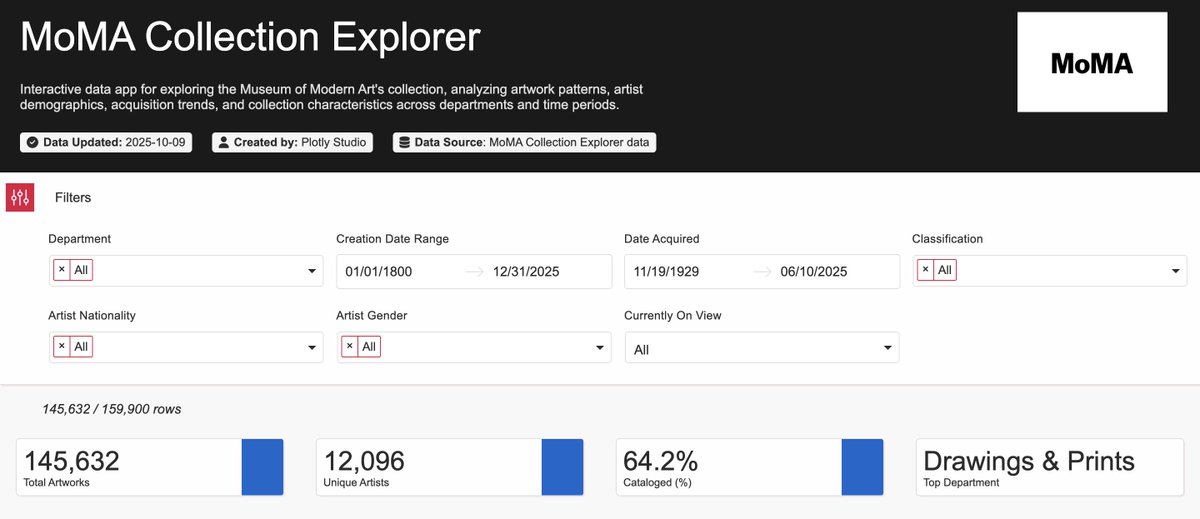
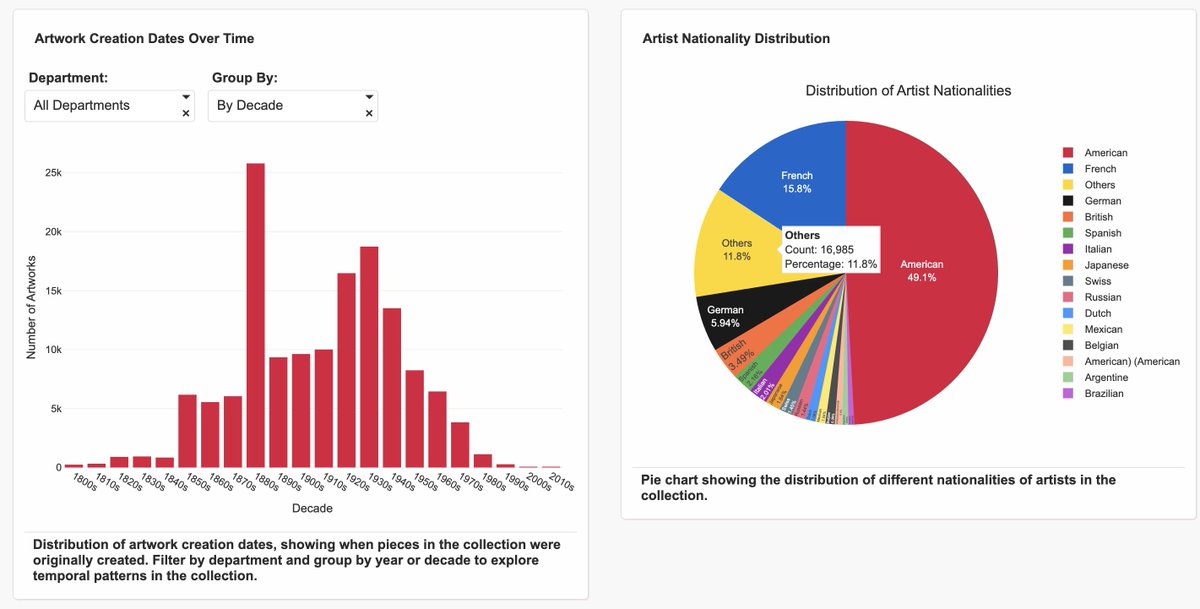
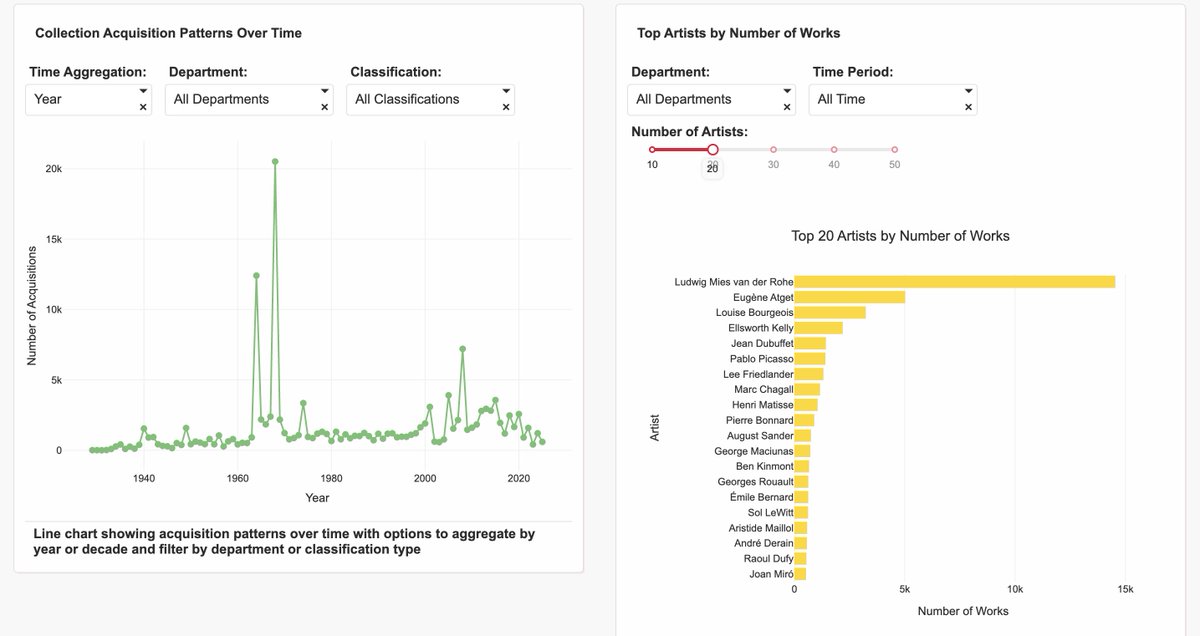
Plotly’s Eliza Wallace built a MoMA Artworks Explorer in Plotly Studio, turning one of her favorite datasets into an interactive experience. Using AI-assisted prompts, she created a theme inspired by Piet Mondrian’s iconic primary colors, added custom visuals, and highlighted her favorite graph.
🖼️ Explore the app here and see how Plotly Studio makes it easy to combine aesthetics, creativity, and interactivity in data exploration: bit.ly/3LbdkSq
📊 Download Plotly Studio today: bit.ly/3JymJ67
#PlotlyStudio
2
406

5 Oct 2025
Took part in @plotlygraphs Vibe-a-thon over the weekend and here is my submission.
A dashboard for post-recovery statistical analysis with interactive scatter plots, bar graphs and percentile graphs.
Link: e17d3a29-2ff8-4182-9d8f-41e1…
#PlotlyStudio #plotlyStudio
1
6
1,962

1 Oct 2025
We chase success. But what if it's a trap? 🤯
I analyzed decades of global data and found the "Wellbeing Paradox": where more education sometimes leads to LESS happiness.
5e33556a-101a-4fa5-8f63-0655…
#PlotlyStudio #plotly #hackathon
1
2
293
4 Sep 2025
⚙️ Beyond generating full dashboards, Plotly Studio is highly effective for iterative, question-driven analytics.
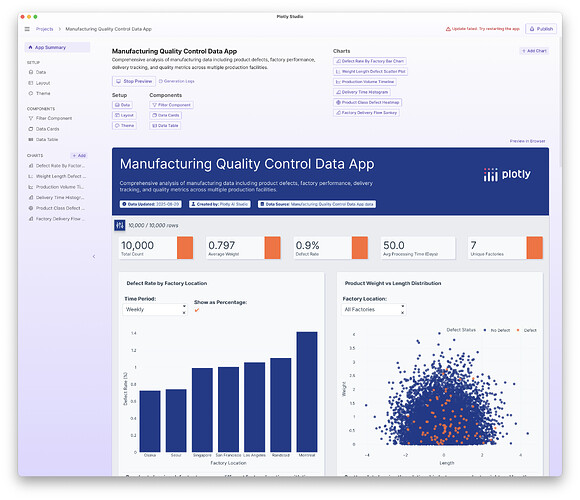
Here’s how Chris Parmer, Plotly’s Co-Founder, uses it to explore a supply chain and manufacturing dataset step by step:
• Start with 6 auto-generated charts to get oriented
• Drill down into details with pivot tables
• Add filters and dropdowns to slice data different ways
• Create new charts to test relationships between variables
The key: Studio doesn’t “give answers.” Instead, it writes the analytics code (#Python) to compute results and visualize them letting you inspect, validate, and extend the logic. This keeps analysis transparent and adaptable while accelerating the workflow.
Read all of his tips and tricks in the #PlotlyCommunity: community.plotly.com/t/using…
👉 Want to dive deeper? Join our webinar on Sept 23 to see how Plotly Studio fits into modern analytics workflows. plotly.com/webinars/rise-of-…
#PlotlyStudio #Plotly
2
455
15 Aug 2025
In our latest webinar, Matt Brown and Chris Parmer (Plotly Co-founder & CPO) showed how Plotly Studio Cloud are turning datasets into powerful, production-ready apps in minutes. 😎📊✨
From healthcare to finance, manufacturing to energy, we explored real AI-generated applications built during the early access program and the innovation they’re unlocking.
Check out the highlight reel! ⬇️
Sign up for Plotly Studio: plotly.com/studio/?utm_mediu…
Watch the full webinar: plotly.com/webinars/from-spr…
#PlotlyStudio #PlotlyAI #AI
2
528
7 Aug 2025
NYC data folks — we’re doing it again! 🙌
Last month’s Plotly Meetup was packed with creativity, collaboration, and seriously impressive data apps all built using Plotly. We loved seeing what the Plotly community could create together, and we’re feeling very lucky to be part of it.
Our next session will be on August 20! Drop by for food, soda, and seriously good data vibes. You’ll also get hands-on access to Plotly Studio, our AI-powered data app builder.
Save your spot 👉 lu.ma/n1qspo8i
#PlotlyCommunity #Plotly #Dash #PlotlyStudio #AI #PlotlyAI

1
2
571