
Feb 28
🔝 Power BI Report of the Day by Michal Jezik
🔗 community.fabric.microsoft.c…
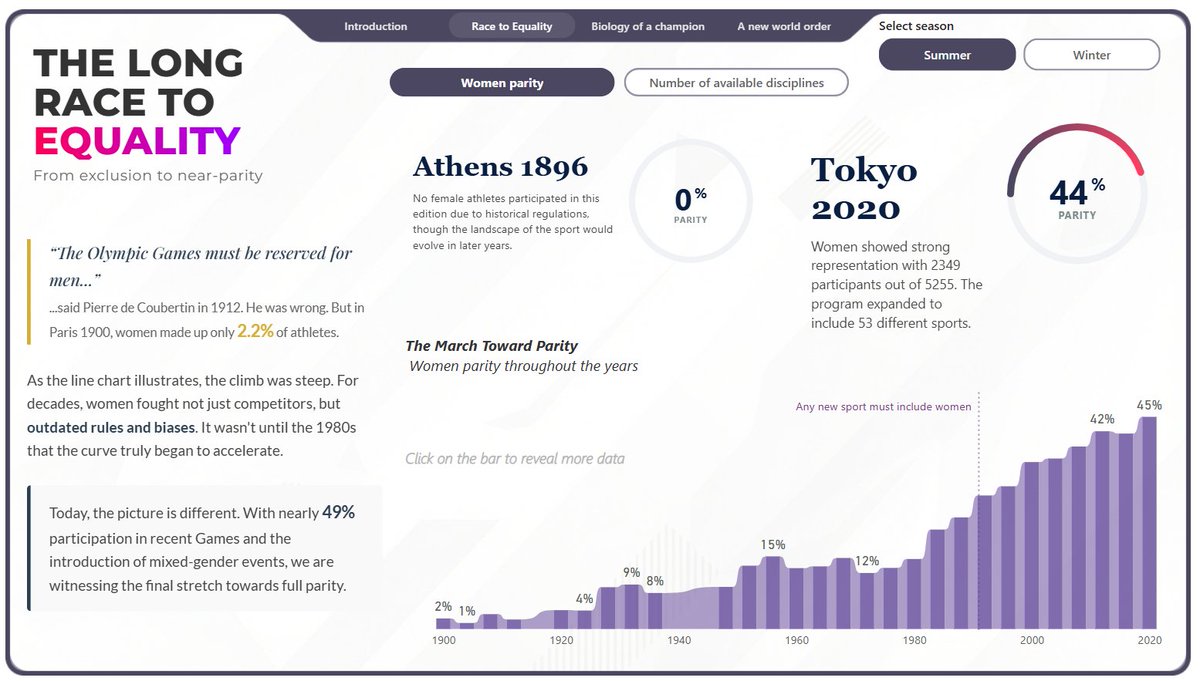
The journey from 0% to nearly 50% women's participation in the Olympics is one of sport's greatest stories. From Athens 1896 (zero female athletes) to Tokyo 2020 (44% parity) — the climb was slow, but the momentum is undeniable. Full parity is within reach. 🏅
👉 Follow us for more: linktr.ee/powerbi.masterclas…
#PowerBiMasterclass #PowerBI #DataVisualization #dataviz #DataAnalytics #DataScience #BusinessIntelligence
1
2
7
423
Feb 25
📊 Power BI Masterclass — Weekly Highlights | Week 08, 2026
This week's best picks:
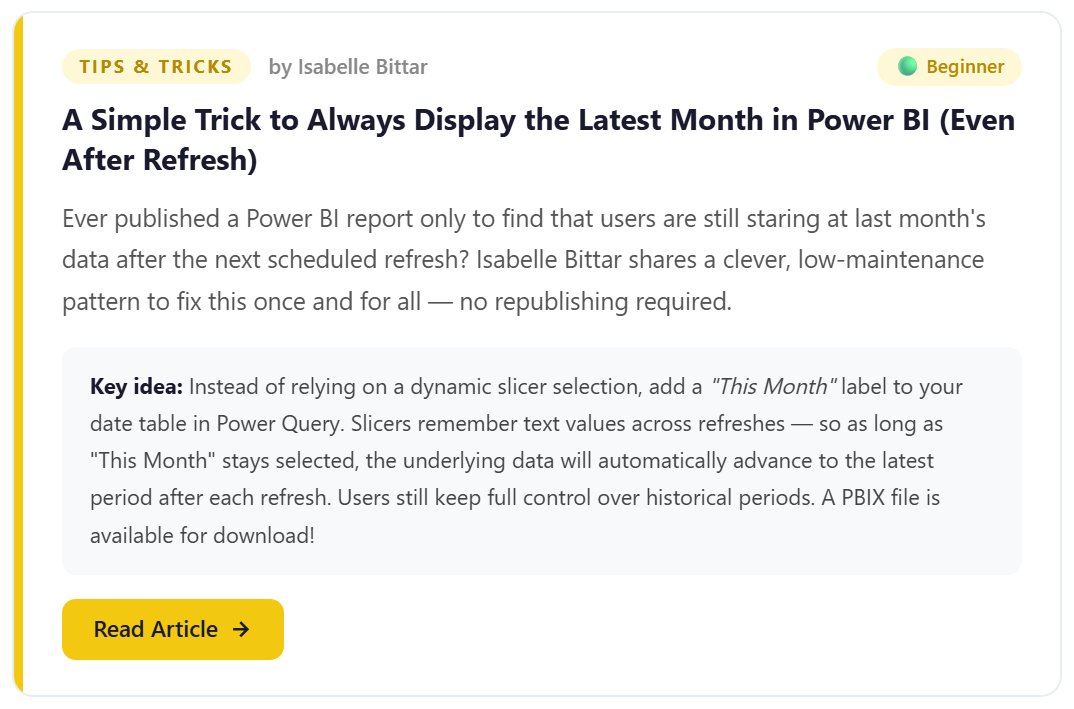
🟡 Always show the latest month in your reports — even after refresh. A simple slicer trick you'll want to steal.
🔵 DAX User-Defined Functions — stop duplicating measures. Centralize your logic, simplify your model.
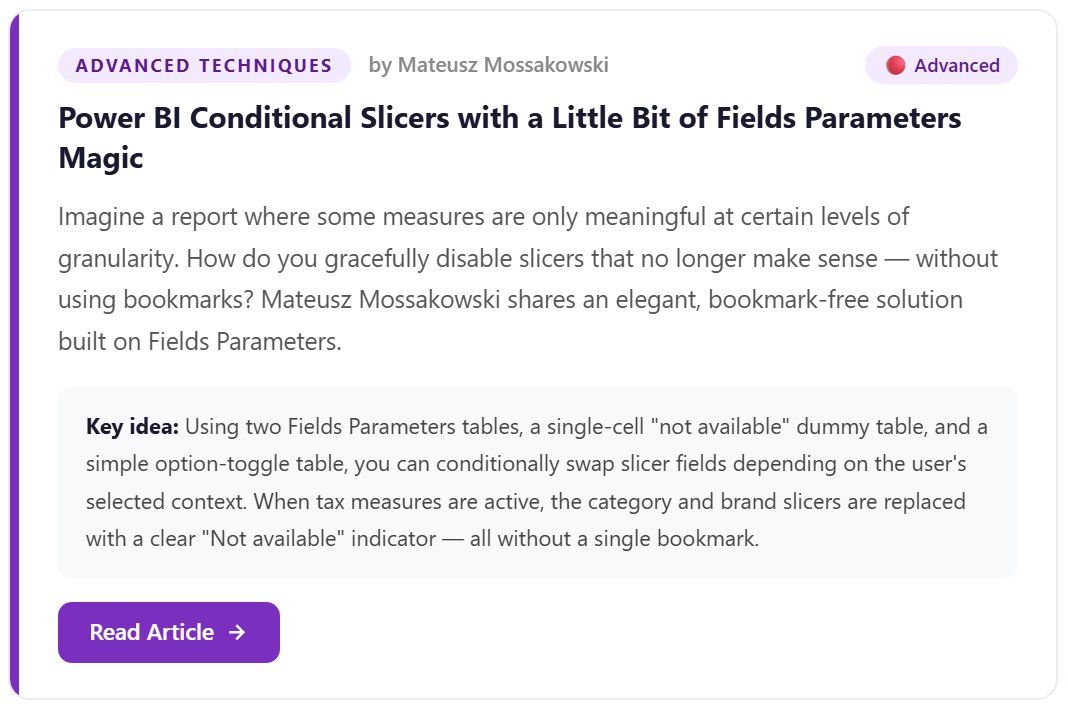
🟣 Conditional slicers with Fields Parameters magic. No bookmarks needed.
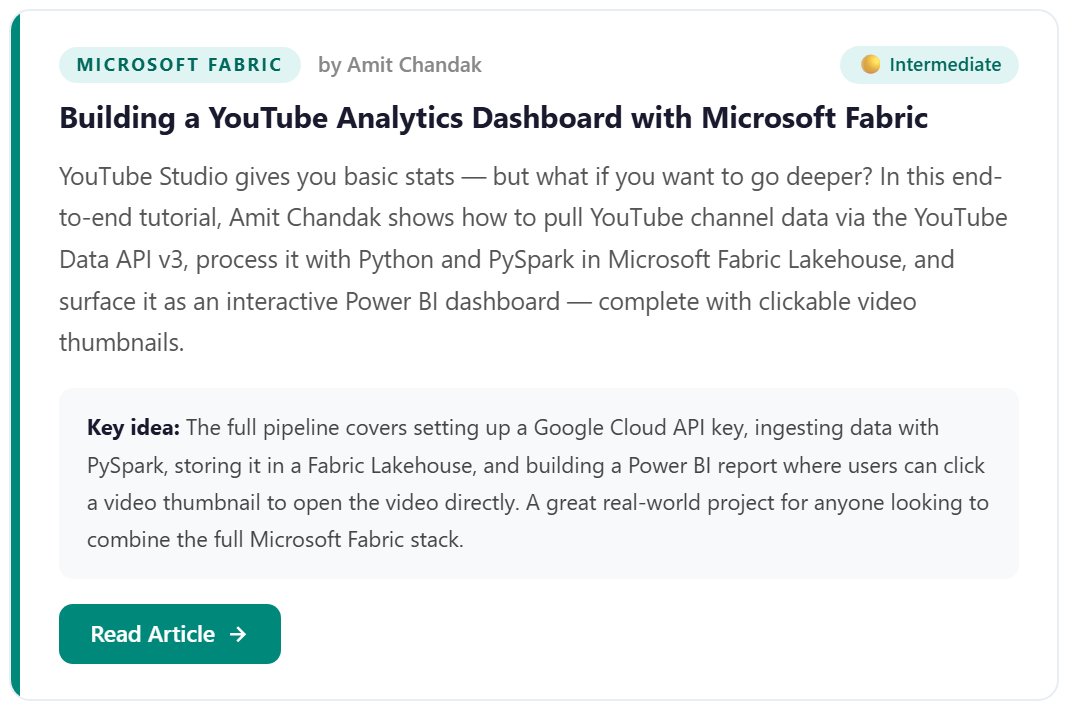
🟢 End-to-end YouTube Analytics Dashboard with Microsoft Fabric — from API to Power BI with clickable thumbnails.
Read it all 👇
powerbi-masterclass.com/arti…
👉 Get access: topmate.io/powerbi_mastercla…
#PowerBI #MicrosoftFabric #DAX #DataVisualization #PowerBIMasterclass

4
15
1,549

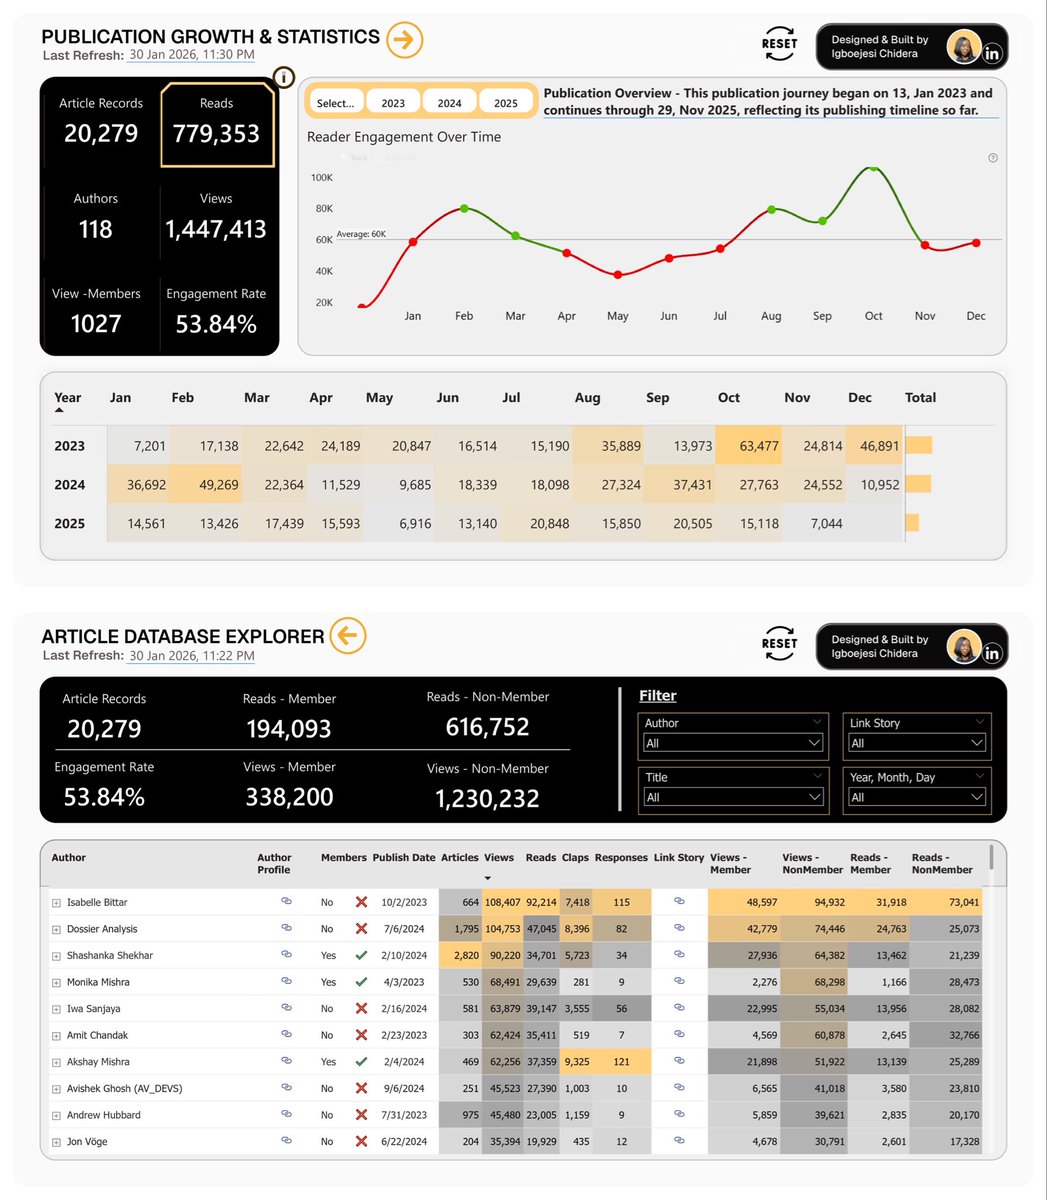
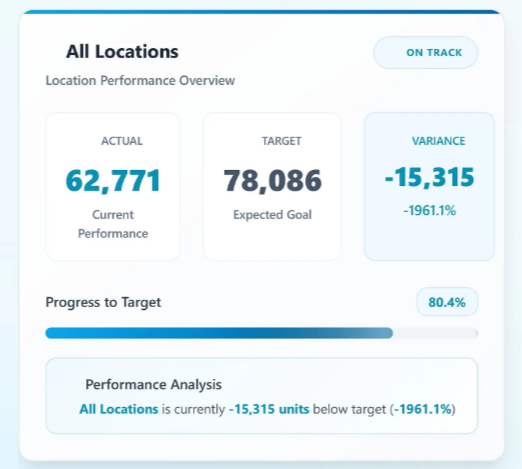
A weeks ago, the founder of a Power BI masterclass community @tomas_kutac_en reached out with a challenge: "We need to allow users to view publications growth, explore read statistics over time and browse/filter the articles database with accessible URLs.”
How can I actually make sense of this?
That's the kind of problem I love solving.
Here's what they were dealing with - massive amounts of publication data, but no clear picture of engagement patterns, author performance, or optimal publishing windows.
They needed answers to publication growth and statistics: Which authors are driving the most value? Are members more engaged than casual visitors?
So, I built a report that transforms raw publication data into a complete performance system that tracks everything from high level trends down to individual authors and article performance.
Check out the solution: app.powerbi.com/view?r=eyJrI…
Fellow analysts - what's the most interesting stakeholder challenge you've tackled recently?
#PowerBI #PowerBiMasterclass #DataVisualization #dataviz #datafam #PbimChallenge2026
2
9
407
A weeks ago, the founder of a Power BI masterclass community @tomas_kutac_en reached out with a challenge: "We need to allow users to view publications growth, explore read statistics over time and browse/filter the articles database with accessible URLs.”
How can I actually make sense of this?
That's the kind of problem I love solving.
Here's what they were dealing with - massive amounts of publication data, but no clear picture of engagement patterns, author performance, or optimal publishing windows.
They needed answers to publication growth and statistics: Which authors are driving the most value? Are members more engaged than casual visitors?
So, I built a report that transforms raw publication data into a complete performance system that tracks everything from high level trends down to individual authors and article performance.
Check out the solution: app.powerbi.com/view?r=eyJrI…
Fellow analysts - what's the most interesting stakeholder challenge you've tackled recently?
#PowerBI #PowerBiMasterclass #DataVisualization #dataviz #datafam #PbimChallenge2026

13
23
195
7,406

Jan 30
Honored to have my Power BI dashboard featured as Report of the Day..
Grateful for the opportunity to participate in the Power BI Masterclass challenge and to keep growing.. 🥂
#PowerBI #PowerBIMasterclass #dataviz #datafam #PbimChallenge2026
Jan 30

🔝 Report of the Day and new submission for Power BI Masterclass Report Challenge by Adetunji Abassi
📺 Watch live report: app.powerbi.com/view?r=eyJrI…
📖 Read the summary here: linkedin.com/posts/adetunji-…
👀 We look forward to more reports!
📋 If you want to join this challenge, here are the instructions:
👉 powerbi-masterclass.short.gy…
💡 Our #PowerBI GPT Coach will help you to rate your dashboard and propose improvements:
👉 powerbi-masterclass.short.gy…
👉 Follow us for more: linktr.ee/powerbi.masterclas…
#PbimChallenge2026 @AdetunjiAbassi

3
6
227
25 Dec 2025
🔥 Power BI Coach & Assistant now in version 2.0
🔝 With a 4.7 rating, it is the best-rated custom Power BI GPT on ChatGPT
🔗 linkedin.com/posts/microsoft…
#PowerBiMasterclass #PowerBI #DataVisualization #dataviz #DataAnalytics #DataScience #BusinessIntelligence #ai
7
23
2,383
15 Dec 2025
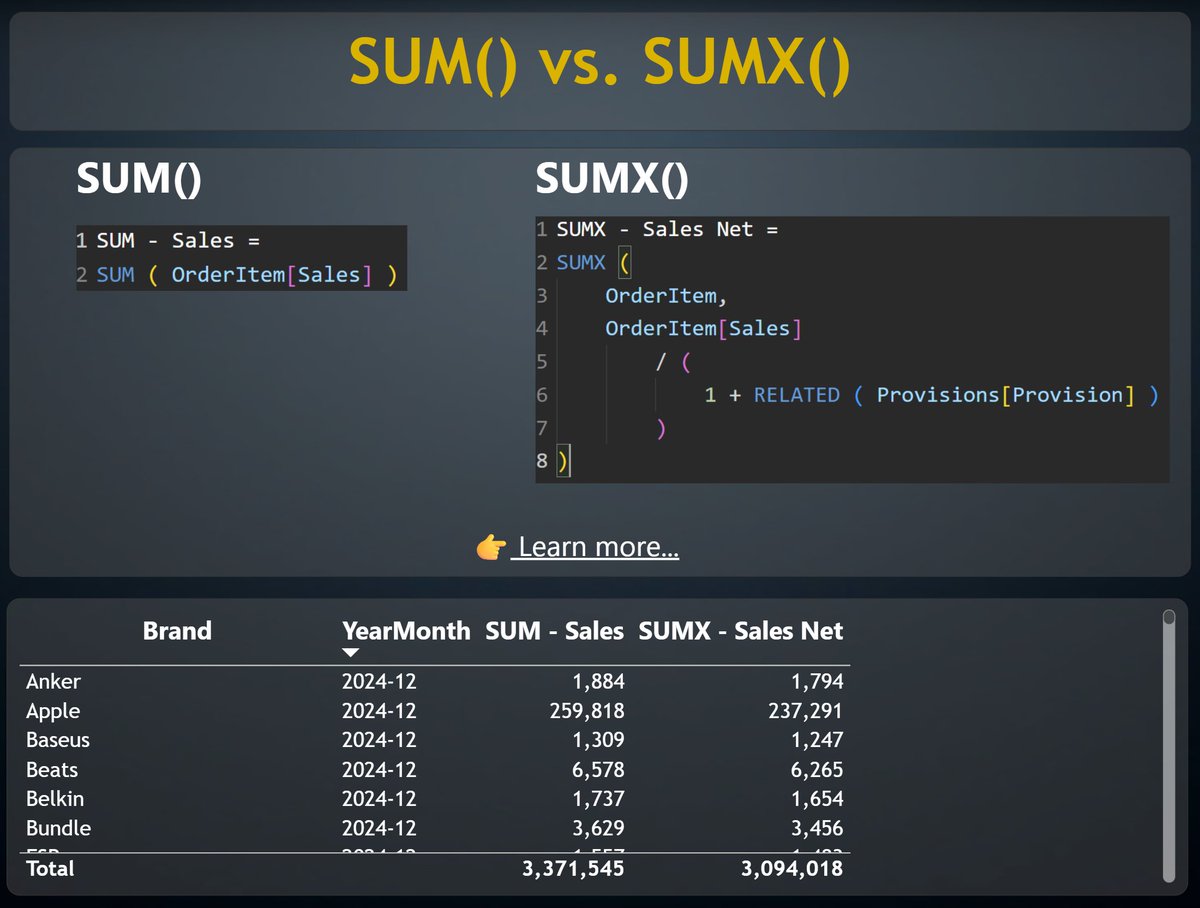
🔎 DAX Explained — SUM vs. SUMX
🔗 medium.com/microsoft-power-b…
👉 For more: powerbi-masterclass.short.gy…
#PowerBiMasterclass #PowerBI #DataVisualization #dataviz #DataAnalytics #DataScience
9
41
1,914
27 Nov 2025
💻 Mastering DAX - How DAX works with filters
🔗 medium.com/microsoft-power-b…
👉 For more: powerbi-masterclass.short.gy…
#PowerBiMasterclass #PowerBI #DataVisualization #dataviz #DataAnalytics #DataScience #BusinessIntelligence
6
29
1,431
25 Nov 2025
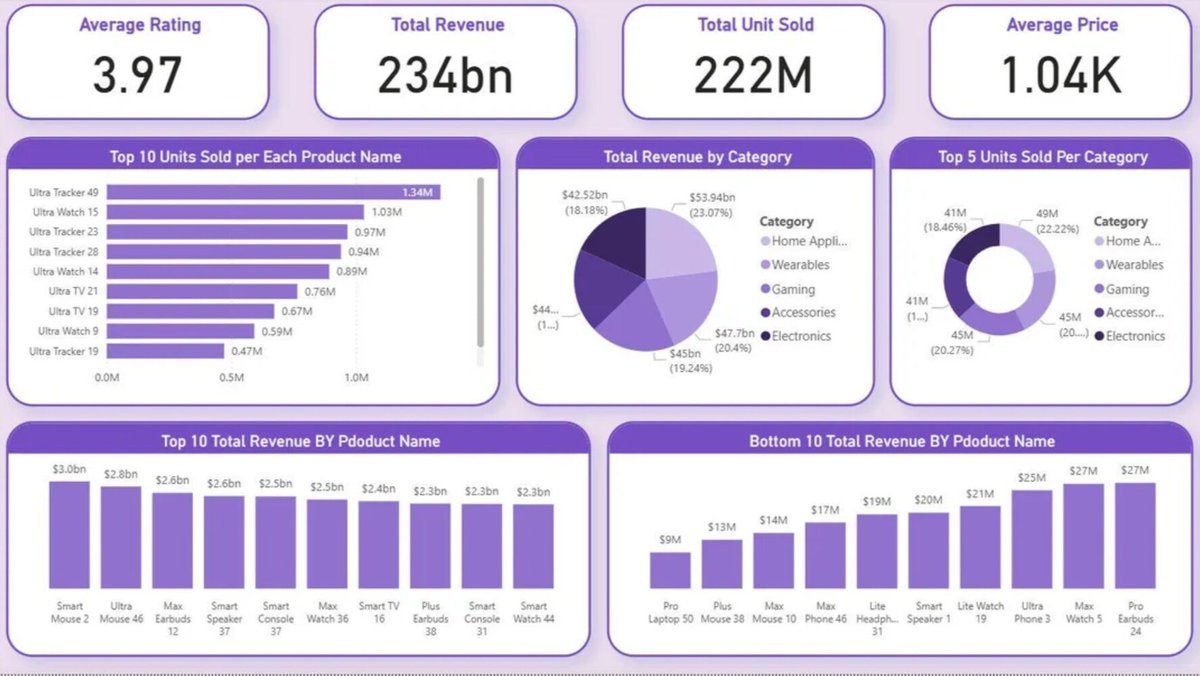
🔝 Power BI Report of the Day
🔗 reddit.com/r/PowerBIdashboar…
👉🏻 Follow us for more free Power BI content: powerbi-masterclass.short.gy…
#PowerBiMasterclass #PowerBI
3
14
520
17 Nov 2025
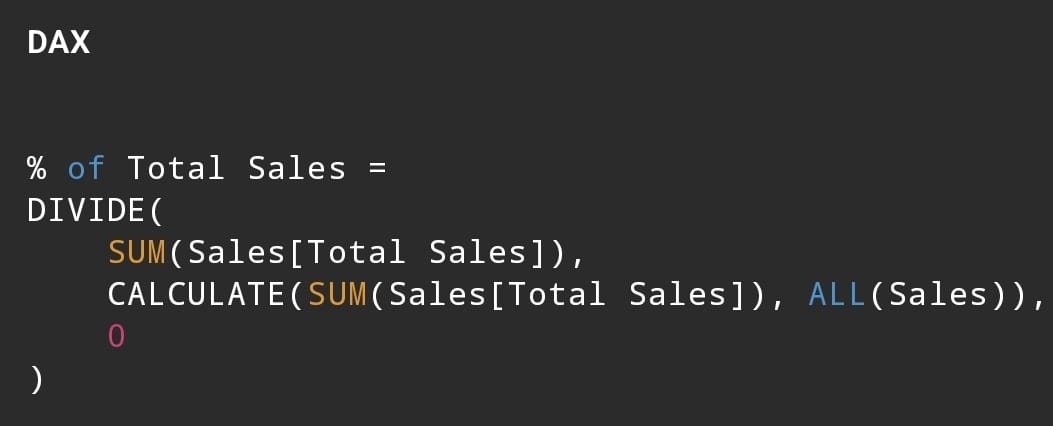
💡 Quick DAX Tip
🔁 Use ALL() to Remove Filters and Calculate Totals or Percentages
The ALL() function is incredibly useful when you need to ignore filters in your report — for example, when calculating percentages of a total.
🔎 Get detailed explanation from our PBI GPT: chatgpt.com/g/g-68554431f960…
👉 Follow us for more: powerbi-masterclass.short.gy…
#PowerBiMasterclass #PowerBI #DataVisualization #dataviz #DataAnalytics #DataScience #BusinessIntelligence
1
3
34
1,313
17 Nov 2025
💻 Power BI Modeling Excellence: The Architecture Behind Reliable Insights
🔗 medium.com/microsoft-power-b…
👉 For more: powerbi-masterclass.short.gy…
#PowerBiMasterclass #PowerBI #DataVisualization #dataviz #DataAnalytics #DataScience #BusinessIntelligence
6
24
3,592
16 Nov 2025
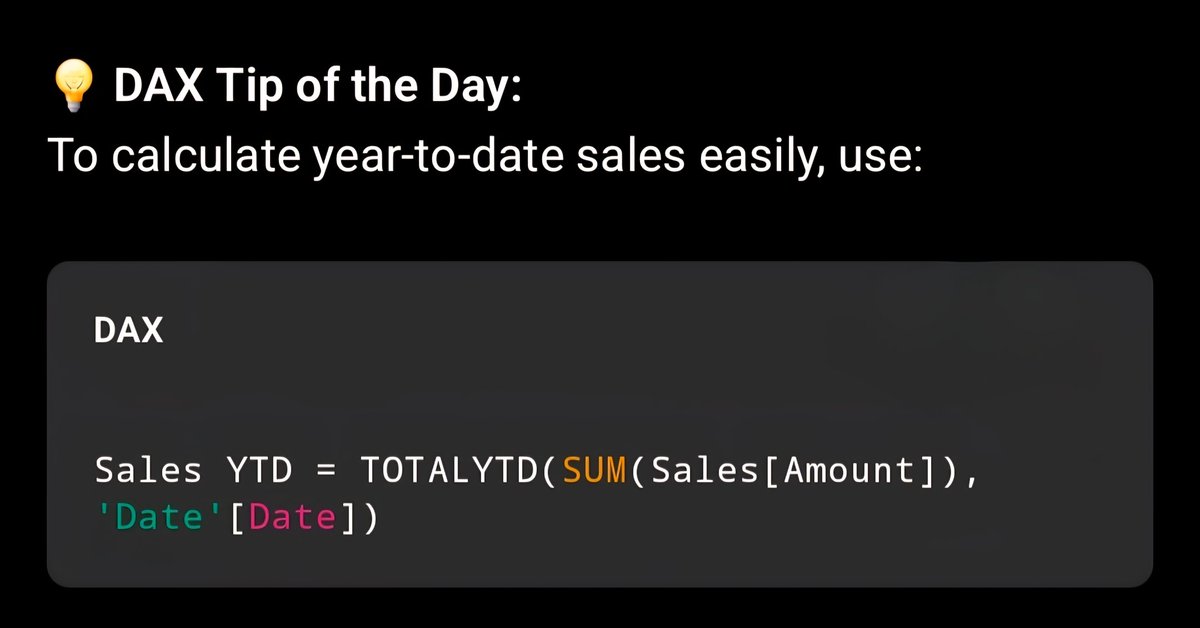
💡 Quick DAX Tip
👉 Calculate YTD sales with TOTALYTD()
🔎 Detail explanation: chatgpt.com/s/t_691a23c5dcbc…
👉 Follow us for more Power BI content: powerbi-masterclass.short.gy…
#PowerBiMasterclass #PowerBI #DataVisualization #dataviz #DataAnalytics #DataScience #BusinessIntelligence
5
19
694
16 Nov 2025
🏆 Power BI Report of the Day by Michel van Schaik
🔗 linkedin.com/posts/microsoft…
👉 Follow us for more Power BI content: linktr.ee/powerbi.masterclas…
#PowerBiMasterclass #PowerBI #DataVisualization #dataviz #DataAnalytics #DataScience

4
24
1,031
16 Nov 2025
📅 Build the Ultimate Calendar Table in Power BI (Step-by-Step Guide)
🔗 medium.com/microsoft-power-b…
👉 For more: powerbi-masterclass.short.gy…
#PowerBiMasterclass #PowerBI #DataVisualization #dataviz #DataAnalytics #DataScience #DataAnalysis
1
9
48
3,322
12 Nov 2025
💡 Power BI Quick Tip:
You can create fully custom KPI cards using HTML DAX — no need for fancy visuals.
Use a measure that returns HTML, then render it with the HTML Content custom visual.
🎨 The result? Beautiful, dynamic KPI cards with total design freedom.
👉 See 3 complete examples (built from scratch):
medium.com/microsoft-power-b…
👉 For more free Power BI content: powerbi-masterclass.short.gy…
#PowerBiMasterclass #PowerBI #DataVisualization #dataviz #DataAnalytics #DataScience #DataAnalysis
8
50
3,687
11 Nov 2025
🔝 Power BI Report of the Day by lancu Cojocaru
🔗 linkedin.com/posts/iancu-coj…
👉 Free Power BI content: linktr.ee/powerbi.masterclas…
#PowerBiMasterclass #PowerBI #DataVisualization #dataviz #DataAnalytics #DataScience #BusinessIntelligence
6
32
2,183
9 Nov 2025
💡 Power BI Tips & Tricks
🎨 Copy a visual’s format to multiple visuals in Power BI faster
You already know the Format Painter tool — but here’s a time-saving trick 👇
Instead of formatting each visual one by one:
1️⃣ Select all visuals you want to format (except the one with the desired format).
2️⃣ Group them.
3️⃣ Use Format Painter on the group — not each visual.
Boom 💥 All visuals formatted in one go!
👉 Follow us for more: powerbi-masterclass.short.gy…
#PowerBiMasterclass #PowerBI #DataVisualization #dataviz #DataAnalytics #DataScience #BusinessIntelligence
1
13
78
4,232
9 Nov 2025
✨4 Recent Power BI Features — Small Ones but Big Impacts
🔗 medium.com/microsoft-power-b…
👉 For more: powerbi-masterclass.short.gy…
#PowerBiMasterclass #PowerBI #DataVisualization #dataviz #DataAnalytics #DataScience #BusinessIntelligence

6
16
948
8 Nov 2025
It's so easy to start learning Power BI nowadays... just say HELLO 👋🏻 to our Power BI GPT
👉🏻 chatgpt.com/g/g-68554431f960…
#PowerBiMasterclass #PowerBI #DataVisualization #dataviz #DataAnalytics #DataScience #BusinessIntelligence #ai

5
23
1,772
5 Nov 2025
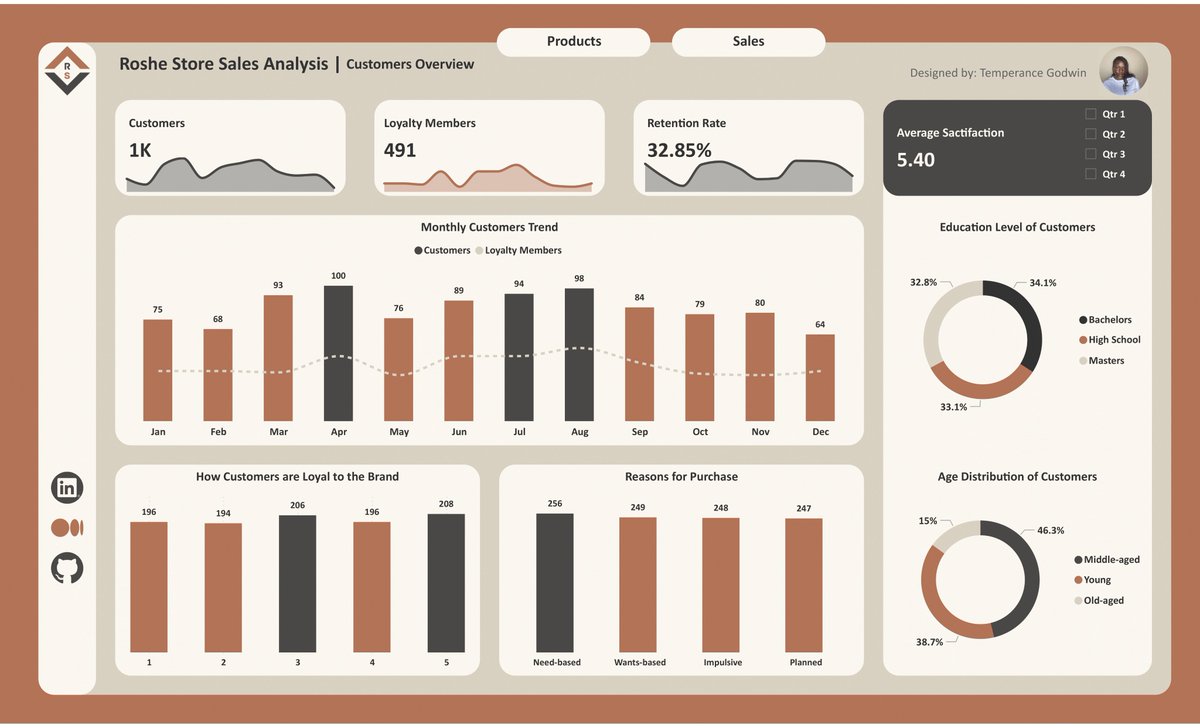
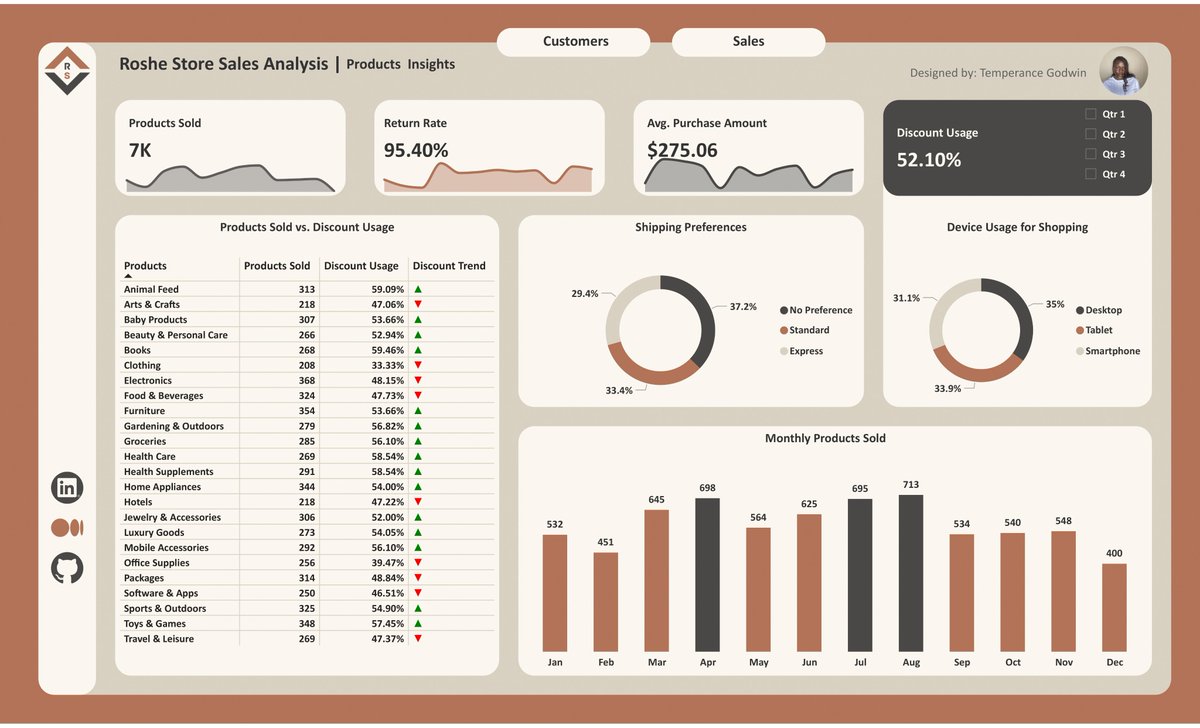
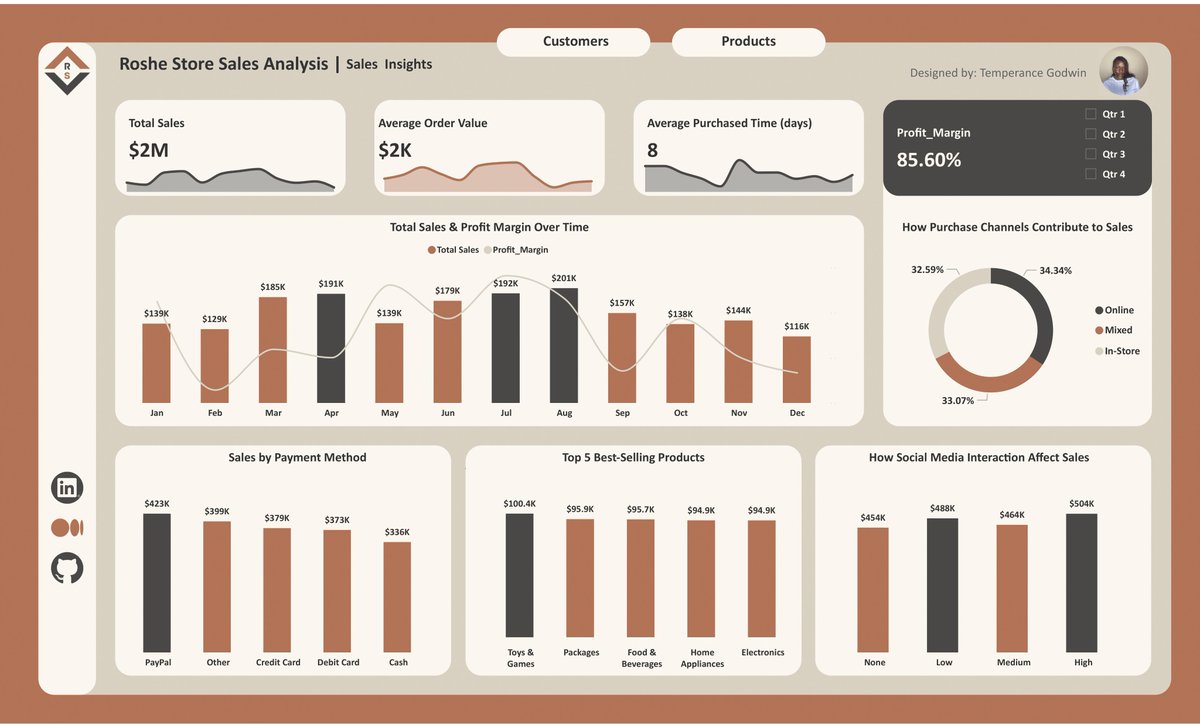
🏆 Power BI Report of the Day by @Roshethequeen
👉 Follow for more Power BI content: linktr.ee/powerbi.masterclas…
#PowerBiMasterclass #PowerBI #DataVisualization #dataviz #DataAnalytics #DataScience
30 Oct 2025

ROSHE STORE SALES ANALYSIS👌
The aim was to uncover customer and product insights, track seasonal and behavioral trends, and identify opportunities for improving retention and sales strategies.
2
18
1,623