
PowerFleet signals FY 2027 revenue of $485M-$490M with $30M-$35M free cash flow outlook ift.tt/J9eaRNI
19

Powerfleet Shares Jump on Strong Fiscal 2027 Outlook Despite Earnings Miss (AIOT) investorshub.advfn.com/marke…
30

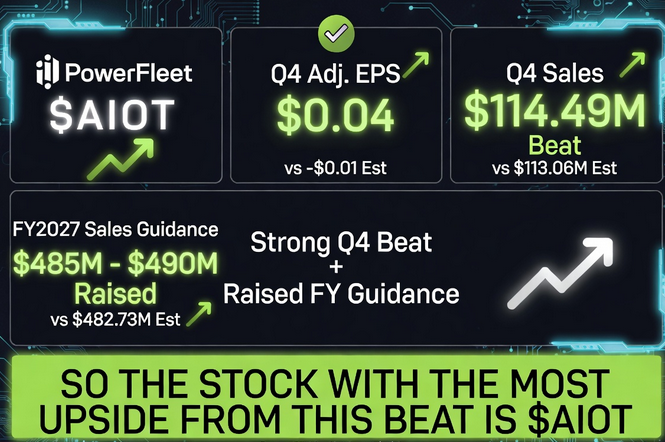
POWERFLEET $AIOT
Q4 Adj EPS $0.04 vs -$(0.01)** Est → Beat
Q4 Sales $114.49M vs $113.06M Est → Beat
FY2027 Sales Guidance $485M – $490M vs $482.73M Est → Raised
277


$AIOT ( 5.9% pre) Powerfleet (Nasdaq: AIOT) lifts 2026 revenue 22% and boosts EBITDA outlook
ooc.bz/l/105107
1,376


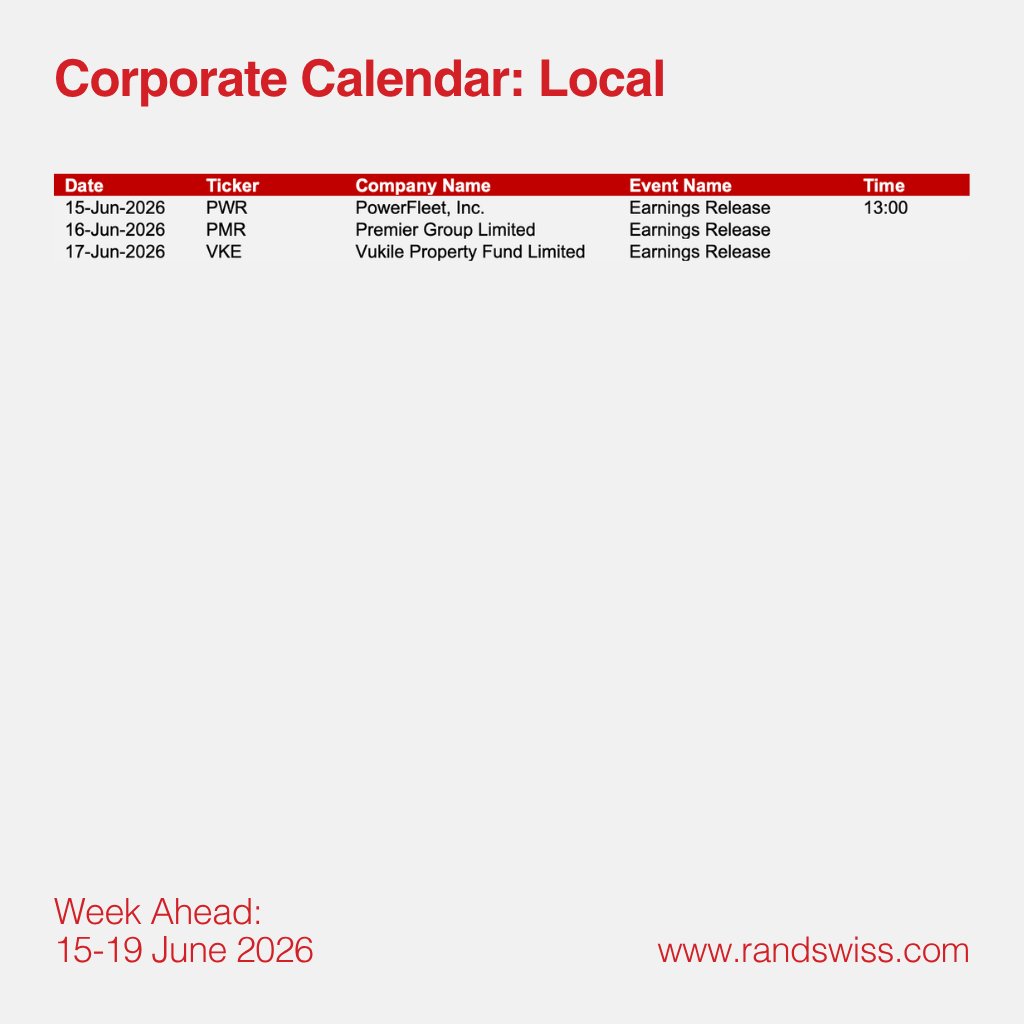
SA Earnings to Watch This Week
A relatively light week on the JSE, with results expected from Premier Group, Vukile Property Fund and PowerFleet.
#JSE #EarningsSeason #SAStocks #MarketUpdate #WeeklyWrap #RandSwiss
59

[REUTERS] BRIEF-Powerfleet Q4 Revenue USD 114.5 Million Vs. IBES Estimate USD 113.1 Million
$AIOT
46

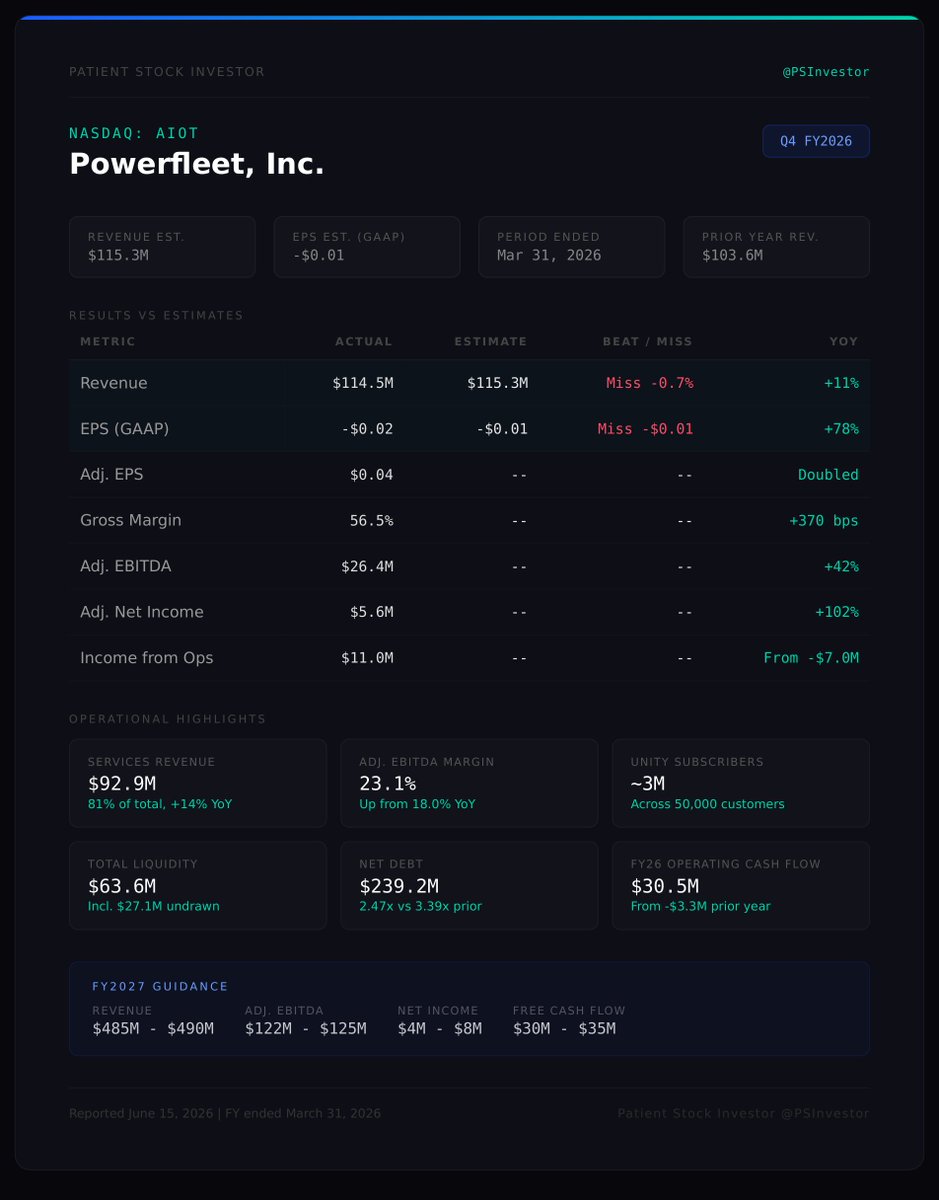
Powerfleet $AIOT Q4 and full-year fiscal 2026 earnings are out.
The headline here is not the top line, it is the profitability turn. Revenue growth was steady, but the real story is a business that has flipped to positive operating income and is now generating real cash, with high-margin recurring services carrying the model and operating leverage finally showing up at the bottom line.
Key catalysts from the report:
- A landmark South African National Treasury agreement to deploy Unity safety solutions, ramping over the next eighteen months and commencing in the second quarter of fiscal 2027
- The three largest individual contracts in the company's history, including enterprise wins with a top global food and beverage player and a global manufacturer
- A growing pool of realized cost synergies from the MiX and Fleet Complete combinations, with more centralization and automation savings targeted for the back half of fiscal 2027
Steve Towe $AIOT, Chief Executive Officer:
'𝘞𝘦 𝘢𝘳𝘦 𝘦𝘯𝘵𝘦𝘳𝘪𝘯𝘨 𝘧𝘪𝘴𝘤𝘢𝘭 2027 𝘢𝘴 𝘢 𝘴𝘵𝘳𝘰𝘯𝘨𝘦𝘳, 𝘮𝘰𝘳𝘦 𝘧𝘰𝘤𝘶𝘴𝘦𝘥 𝘤𝘰𝘮𝘱𝘢𝘯𝘺 𝘸𝘪𝘵𝘩 𝘤𝘭𝘦𝘢𝘳 𝘷𝘪𝘴𝘪𝘣𝘪𝘭𝘪𝘵𝘺 𝘪𝘯𝘵𝘰 𝘵𝘩𝘦 𝘯𝘦𝘹𝘵 𝘱𝘩𝘢𝘴𝘦 𝘰𝘧 𝘰𝘶𝘳 𝘨𝘳𝘰𝘸𝘵𝘩.'
Growth is now led by recurring services on the Unity platform, with onsite safety the standout and hardware acting as the land-and-expand on-ramp rather than the engine. A distribution network of telecom and consulting partners is doing a lot of the reach, and the subscriber base keeps compounding across a broad customer set with no obvious single-customer concentration.
Inflection point: fiscal 2026 is the year Powerfleet $AIOT crossed into positive operating income and positive second-half free cash flow, and management is now guiding fiscal 2027 to its first full year of positive net income.
242

🚨 POWERFLEET $AIOT – STRONG Q4 & FISCAL 2026 RESULTS
Powerfleet delivered solid doubledigit growth and margin expansion in its fiscal 2026 results.
📊 KEY FINANCIAL HIGHLIGHTS
Q4 2026
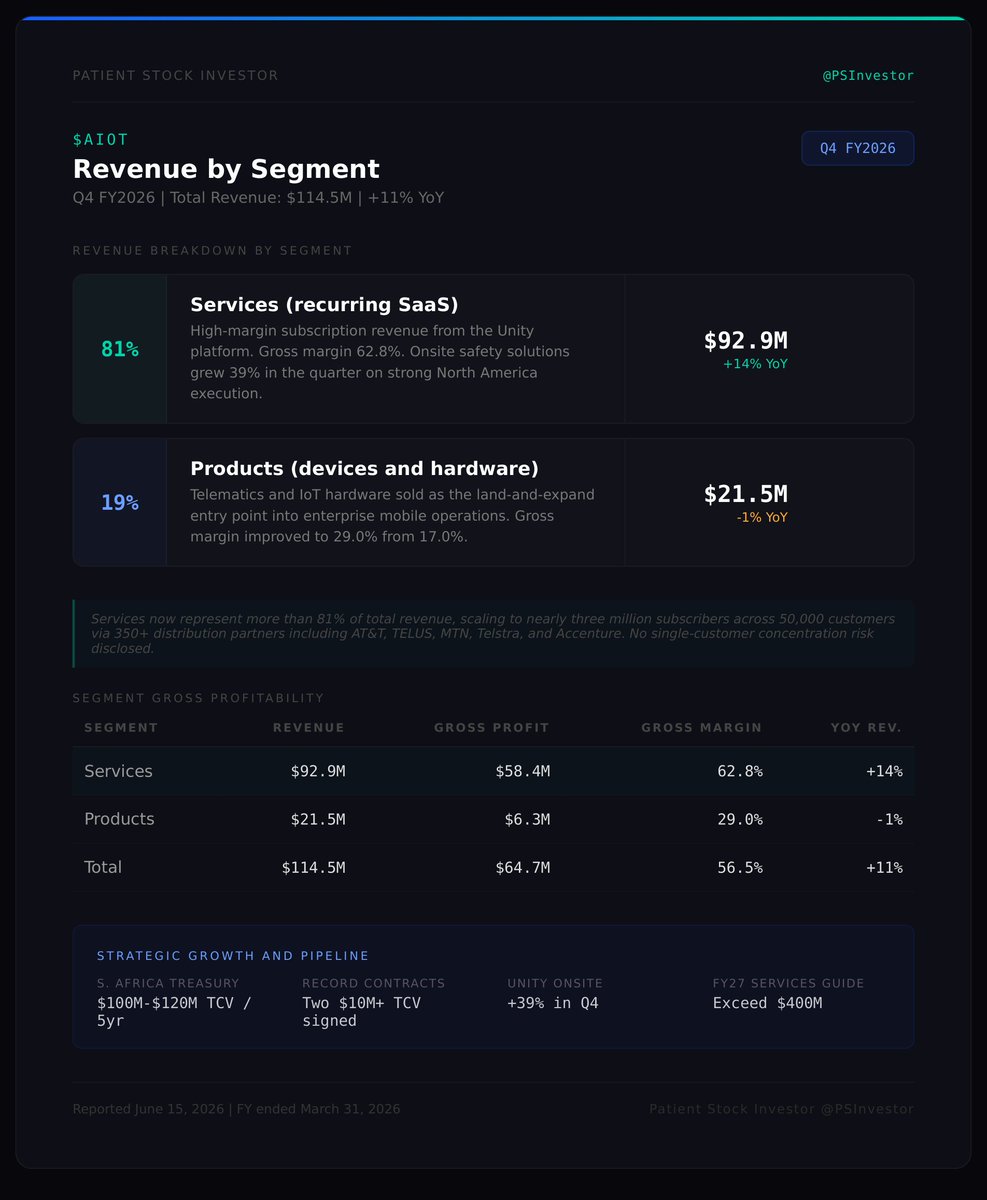
Revenue: $114.5M ( 11% YoY)
Services Revenue: $92.9M ( 14% YoY, 81% of total)
Gross Margin: 56.5% ( 370 bps)
Adjusted EBITDA: $26.4M ( 42% YoY, 23% margin)
Full Fiscal 2026
Revenue: $443.8M ( 22% YoY)
Services Revenue: $359.8M ( 30% YoY)
Adjusted EBITDA: $97.0M ( 44% YoY, 22% margin)
Operating Cash Flow: $30.5M (vs $3.3M prior year)
Net Loss: $20.6M (improved)
✅ MAJOR POSITIVES
Strong services revenue mix and margin expansion
Significant cost synergies realized ($34M over two years)
Major 5year South African National Treasury contract ($100–$120M TCV)
Leverage improved to 2.47x net debt / Adjusted EBITDA
Fiscal 2027 Guidance (optimistic):
Revenue: $485M – $490M (~10% growth)
Adjusted EBITDA: $122M – $125M (~27% growth)
Free Cash Flow: $30M – $35M
Net Income: $4M – $8M
⚠️ NEGATIVES
GAAP net loss of $20.6M for the year
Total debt stands at $280M (net debt $239.2M)
Overall Verdict:
Powerfleet posted a very strong finish to fiscal 2026 with accelerating growth, margin gains, and a major new government contract. The 2027 guidance signals continued momentum in the fleet/IoT telematics space.
77
🚨 $AIOT (Powerfleet) FY2026 Earnings
Growth margin expansion accelerating…
but the big South African contract and 2027 guidance are the real story 👀
📊 KEY METRICS (Q4 FY2026)
🔹 Revenue: $114.5M ( 11% YoY) 🟢
🔹 Services Revenue: $92.9M ( 14% YoY, 81% of total) 🟢
🔹 Gross Margin: 56.5% ( 370 bps) 🟢
🔹 Adj. EBITDA: $26.4M ( 42% YoY, 23% margin) 🟢
🔹 Operating Cash Flow: $30.5M (vs negative prior year) 🟢
👉 Core takeaway:
Strong services mix, record margins, and cash flow inflection
📈 GROWTH ENGINE (CORE STORY)
🟢 Highmargin recurring services revenue
🟢 Fleet management IoT telematics solutions
🟢 Enterprise & government contracts
👉 This is:
A growing player in the connected vehicle / fleet intelligence space
🚀 STRATEGIC MOVE
🟢 Signed major 5year South African National Treasury contract ($100–$120M total value)
🟢 Delivered $34M in cost synergies over two years
🟢 Leverage improved to 2.47x net debt / Adj. EBITDA
👉 This is:
Scale operational efficiency play
⚡ WHAT’S HAPPENING?
Powerfleet is successfully shifting toward highermargin services while landing large government wins and cleaning up the balance sheet.
📉 PROFITABILITY
🔻 GAAP Net Loss: $20.6M for the year
🔻 Q4 GAAP Net Loss: $2.7M
👉 Translation:
Still showing GAAP losses, but Adjusted EBITDA and cash flow are turning strongly positive.
📅 FISCAL 2027 GUIDANCE (CONFIDENT)
🔹 Revenue: $485M – $490M (~10% growth) 🟢
🔹 Adj. EBITDA: $122M – $125M (~27% growth) 🟢
🔹 Net Income: $4M – $8M 🟢
🔹 Free Cash Flow: $30M – $35M 🟢
👉 Important: Clear path to sustained profitability and strong cash generation
🧠 WHAT’S ACTUALLY WORKING
🟢 Services revenue mix jumping to 81%
🟢 Significant margin expansion
🟢 Major government contract win
🟢 Strong cash flow generation
🟢 Improving balance sheet
⚠️ WEAK SPOTS
🔻 Still GAAP unprofitable for the full year
🔻 Debt remains elevated ($280M total)
🔻 Execution risk on large new contract
🔻 Guidance implies moderation from Q4’s 23% EBITDA margin
🧠 MARKET SIGNAL
$AIOT is transitioning into a higherquality, servicesdriven growth story in the fleet/IoT sector with visible scale via government contracts.
🔥 BULL vs BEAR
🟢 Bull Case
• Services mix margin expansion continues
• South African contract ramps successfully
• Path to consistent profitability in FY27
• Strong demand for fleet intelligence solutions
🔴 Bear Case
• Integration/execution risk on large contract
• Margins may normalize lower
• Debt burden limits flexibility
• Competition in telematics space
💭 CONCLUSION
Powerfleet delivered a strong finish to FY2026 with accelerating services growth, margin gains, and a transformative government contract. FY2027 guidance shows confidence in continued scaling and profitability.
👀 KEY QUESTION
Can Powerfleet successfully integrate the big South African win and convert strong Adjusted EBITDA into consistent GAAP net income?
1
97

11h
$AIOT — just dropped an 8-K confirming a major financial turnaround. Powerfleet exceeded Q4 and full-year FY26 revenue and adjusted EBITDA estimates, with Q4 revenue hitting $114.50 million, up from the $112.99 million estimate. We've watched this trajectory since Q3, and the company has now achieved positive operating income and free cash flow in the second half of FY26, alongside substantial deleveraging. This isn't just a beat; it's a sustained pivot to profitability.
Further solidifying this momentum, AIOT announced a landmark contract valued at $100M-$120M. Management isn't stopping there, issuing robust FY27 guidance projecting double-digit revenue growth, increased adjusted EBITDA, and a return to positive net income and free cash flow. This filing paints a clear picture of an accelerating business.
Headlines are late. Filings aren't.
Source & full breakdown: Wiseek (link in bio)
153

39

11h
$AIOT Q4 2026 earnings: Integration Complete: The Pivot to Profitable SaaS is Working
Powerfleet has successfully completed its difficult integration phase following the MiX and Fleet Complete acquisitions and is now inflecting toward sustained profitability. Q4 26 showcased an 11% YoY revenue increase, driven entirely by high-margin services revenue ( 14%), while Adjusted EBITDA surged 42% YoY to $26.4 million. The narrative has decisively shifted from cost synergies to top-line acceleration, punctuated by a massive $100M contract with the South African National Treasury. With guidance projecting positive GAAP Net Income and $30M in Free Cash Flow for FY27, Powerfleet is evolving into a structurally sound, cash-generating SaaS enterprise.
Full article with charts - link in bio
🐂 𝐁𝐮𝐥𝐥 𝐂𝐚𝐬𝐞
• 𝐌𝐚𝐫𝐠𝐢𝐧 𝐄𝐱𝐩𝐚𝐧𝐬𝐢𝐨𝐧 𝐄𝐧𝐠𝐢𝐧𝐞 — Services now represent over 81% of total revenue. As this mix continues to shift, gross margins are expanding rapidly (56.5% in 26Q4 vs 52.8% a year ago), pulling Adjusted EBITDA up 42% YoY.
• 𝐅𝐫𝐞𝐞 𝐂𝐚𝐬𝐡 𝐅𝐥𝐨𝐰 𝐈𝐧𝐟𝐥𝐞𝐜𝐭𝐢𝐨𝐧 — After burning $13.7M in H1 FY26, the company generated $4.1M in H2 and is guiding for $30M-$35M in FY27. The heavy lifting of integration costs is over.
🐻 𝐁𝐞𝐚𝐫 𝐂𝐚𝐬𝐞
• 𝐇𝐚𝐫𝐝𝐰𝐚𝐫𝐞 𝐒𝐭𝐚𝐠𝐧𝐚𝐭𝐢𝐨𝐧 — Product revenue declined slightly YoY in Q4 ($21.5M vs $21.8M). While management is focused on SaaS, sluggish hardware sales could eventually bottleneck new subscriber growth if ARPU expansion stalls.
• 𝐇𝐢𝐠𝐡 𝐃𝐞𝐛𝐭 𝐁𝐮𝐫𝐝𝐞𝐧 — Total debt stands at $280M against $40.8M in cash. While the leverage ratio is improving (2.47x), a significant portion of operating cash goes to interest expense ($27.5M in FY26).
⚖️ 𝐕𝐞𝐫𝐝𝐢𝐜𝐭: 🟢
Bullish. The company delivered exactly what it promised: synergy realization, margin expansion, and a massive tier-one contract win. The guidance for GAAP profitability in FY27 proves the operating model is now structurally sound.
𝐊𝐞𝐲 𝐓𝐡𝐞𝐦𝐞𝐬
🟢🟢 𝐒𝐨𝐮𝐭𝐡 𝐀𝐟𝐫𝐢𝐜𝐚𝐧 𝐍𝐚𝐭𝐢𝐨𝐧𝐚𝐥 𝐓𝐫𝐞𝐚𝐬𝐮𝐫𝐲 𝐌𝐞𝐠𝐚-𝐃𝐞𝐚𝐥 [NEW]
Powerfleet secured a landmark 5-year agreement anticipated to deliver $100M-$120M in total contract value. This is a game-changer. It validates the Unity platform at a sovereign scale, provides a massive anchor of recurring revenue over the next 18 months, and serves as a highly visible reference case for global public sector expansion.
🟢 𝐔𝐧𝐢𝐭𝐲 𝐏𝐥𝐚𝐭𝐟𝐨𝐫𝐦 𝐃𝐫𝐢𝐯𝐢𝐧𝐠 𝐋𝐚𝐧𝐝-𝐚𝐧𝐝-𝐄𝐱𝐩𝐚𝐧𝐝
The strategy to consolidate point solutions into the 'Single Pane of Glass' Unity platform is accelerating. The onsite safety solutions segment grew 39% in the fourth quarter. By cross-selling AI video and in-warehouse tools, Powerfleet is systematically increasing its Average Revenue Per Unit (ARPU) and locking in enterprise stickiness.
🟢 𝐒𝐲𝐧𝐞𝐫𝐠𝐲 𝐓𝐚𝐫𝐠𝐞𝐭𝐬 𝐑𝐞𝐚𝐜𝐡𝐞𝐝, 𝐅𝐮𝐧𝐝𝐢𝐧𝐠 𝐅𝐮𝐭𝐮𝐫𝐞 𝐆𝐫𝐨𝐰𝐭𝐡
Management executed its integration playbook perfectly, achieving over $34 million in realized synergy savings over the past two years ($18M in FY26 alone). Instead of letting all of this flow to the bottom line, the company is reinvesting these savings into sales channels and AI initiatives to fuel FY27's projected 10% top-line growth.
🔴 𝐏𝐫𝐨𝐝𝐮𝐜𝐭 𝐑𝐞𝐯𝐞𝐧𝐮𝐞 𝐒𝐭𝐚𝐠𝐧𝐚𝐭𝐢𝐨𝐧 𝐚𝐧𝐝 𝐌𝐚𝐜𝐫𝐨 𝐂𝐨𝐧𝐬𝐭𝐫𝐚𝐢𝐧𝐭𝐬
While the SaaS story is excellent, physical product revenue dropped YoY from $21.9M in 25Q4 to $21.5M in 26Q4. Management previously noted macroeconomic cautiousness and tariff pressures on CapEx-heavy hardware. If hardware sales remain flat, future SaaS subscriber acquisition could slow down, forcing the company to rely entirely on ARPU expansion from the existing base.
🔴 𝐅𝐫𝐨𝐧𝐭-𝐋𝐨𝐚𝐝𝐞𝐝 𝐈𝐧𝐯𝐞𝐬𝐭𝐦𝐞𝐧𝐭𝐬 𝐖𝐢𝐥𝐥 𝐃𝐫𝐚𝐠 𝐇𝟏 𝐌𝐚𝐫𝐠𝐢𝐧𝐬 [NEW]
Management explicitly warned that ongoing centralization, simplification, and AI initiatives, coupled with the ramp of the South Africa deployment, will require 'upfront investment in the first half' of FY27. Investors should anticipate lower sequential margin improvement in Q1 and Q2 before accelerating in the back half.
🔴 𝐇𝐢𝐠𝐡 𝐂𝐚𝐩𝐢𝐭𝐚𝐥𝐢𝐳𝐞𝐝 𝐒𝐨𝐟𝐭𝐰𝐚𝐫𝐞 𝐂𝐨𝐬𝐭𝐬
Reported operating cash flow was $30.5M, but this was heavily offset by $18.5M in capitalized software development costs. By capitalizing these R&D expenses rather than expensing them, current period operating margins look better. This ongoing cash requirement limits true discretionary Free Cash Flow.
𝐎𝐭𝐡𝐞𝐫 𝐊𝐏𝐈𝐬
𝐅𝐫𝐞𝐞 𝐂𝐚𝐬𝐡 𝐅𝐥𝐨𝐰: $4.1 million in H2 FY26
Reversing. Free Cash flow inflected positively, moving from a cash burn of $13.7 million in the first half of FY26 to generating $4.1 million in the second half. This validates the end of heavy integration spending.
𝐀𝐝𝐣𝐮𝐬𝐭𝐞𝐝 𝐍𝐞𝐭 𝐃𝐞𝐛𝐭 𝐭𝐨 𝐋𝐓𝐌 𝐀𝐝𝐣𝐮𝐬𝐭𝐞𝐝 𝐄𝐁𝐈𝐓𝐃𝐀: 2.47x
Accelerating improvement. Leverage improved nearly a full turn from 3.39x at the end of FY25. With $280M in total debt and $40.8M in cash, the balance sheet remains heavily leveraged, but the rapid growth in EBITDA is making the debt load manageable.
𝐆𝐮𝐢𝐝𝐚𝐧𝐜𝐞
𝐅𝐘𝟐𝟕 𝐑𝐞𝐯𝐞𝐧𝐮𝐞: $485 - $490 million
Stable. Implies ~10% YoY growth. Because FY26 included integration noise and the shedding of low-margin legacy businesses, this 10% figure represents a clean, organic growth rate, primarily driven by the services segment which is guided to exceed $400M.
𝐅𝐘𝟐𝟕 𝐀𝐝𝐣𝐮𝐬𝐭𝐞𝐝 𝐄𝐁𝐈𝐓𝐃𝐀: $122 - $125 million
Accelerating. Implies ~27% YoY growth and a margin of roughly 25%. Management explicitly noted that EBITDA growth will outpace revenue growth, showcasing the organic operating leverage built into their SaaS model.
𝐅𝐘𝟐𝟕 𝐍𝐞𝐭 𝐈𝐧𝐜𝐨𝐦𝐞: $4 - $8 million
Reversing. Powerfleet expects to flip from a $20.6M GAAP Net Loss in FY26 to full-year GAAP profitability in FY27, signaling the complete absorption of M&A amortization and restructuring costs.
𝐅𝐘𝟐𝟕 𝐅𝐫𝐞𝐞 𝐂𝐚𝐬𝐡 𝐅𝐥𝐨𝐰: $30 - $35 million
Accelerating. A massive step up from FY26, indicating the company will finally have organic cash to begin meaningful debt paydown or pursue strategic share repurchases.
𝐊𝐞𝐲 𝐐𝐮𝐞𝐬𝐭𝐢𝐨𝐧𝐬
𝐒𝐨𝐮𝐭𝐡 𝐀𝐟𝐫𝐢𝐜𝐚 𝐂𝐨𝐧𝐭𝐫𝐚𝐜𝐭 𝐌𝐚𝐫𝐠𝐢𝐧 𝐏𝐫𝐨𝐟𝐢𝐥𝐞
Given the unprecedented scale of the South African National Treasury deployment, how does the gross margin profile of this contract compare to the corporate average of 56%? Will hardware deployment significantly compress margins in H1 FY27?
𝐇𝐚𝐫𝐝𝐰𝐚𝐫𝐞 𝐓𝐚𝐫𝐢𝐟𝐟𝐬 𝐚𝐧𝐝 𝐂𝐚𝐩𝐄𝐱 𝐂𝐨𝐧𝐬𝐭𝐫𝐚𝐢𝐧𝐭𝐬
Product revenue declined slightly YoY in Q4. How much of this is intentional vs. macroeconomic pressure on customer CapEx? At what point does stagnant hardware placement bottleneck future SaaS subscriber growth?
𝐂𝐚𝐩𝐢𝐭𝐚𝐥 𝐀𝐥𝐥𝐨𝐜𝐚𝐭𝐢𝐨𝐧 𝐏𝐫𝐢𝐨𝐫𝐢𝐭𝐢𝐞𝐬
With the balance sheet deleveraging below 2.5x and FCF expected to exceed $30 million next year, what is the priority for excess cash? Is the focus purely on debt paydown, or are further M&A targets or share repurchases on the table?

1
635
PowerFleet Q4 Adj. EPS $0.04 Beats $(0.01) Estimate, Sales $114.490M Beat $113.060M Estimate
17
PowerFleet Non-GAAP EPS of $0.04 beats by $0.02, revenue of $114.5M beats by $1.51M ift.tt/fTnqXrK
15

$AIOT - Expected earnings Powerfleet Inc
Powerfleet, Inc. (AIOT) is expected to report $0 for Q4 2026
News & Disclaimer
ift.tt/vkjlAPS
171

Eventos de hoje — 15/06/2026 (hora de Lisboa)
13:30: NY Fed Manufacturing
14:15: Produção Industrial MoM (EUA)
15:00: Índice do Mercado Imobiliário NAHB (EUA)
Antes da abertura 👇
12:00: $CGC Canopy Growth
12:00: $AIOT Powerfleet
Após fecho 👇
21:05: $DOMO Domo
21:05: $PLAY Dave & Buster's Entertainment
21:00: $HITI High Tide
2
340
📅 Today's Key Events (All Times EST) — June 15, 2026
🇺🇸 Economic Data
🕣 08:30 AM
NY Fed Manufacturing Index
🕘 09:15 AM
US Industrial Production (MoM)
🕙 10:00 AM
US NAHB Housing Market Index
🌅 Before Market Open
🕖 07:00 AM
🍃 Canopy Growth $CGC
🤖 Powerfleet $AIOT
🌙 After Market Close
🕓 04:00 PM
🌿 High Tide $HITI
🕓 04:05 PM
☁️ Domo $DOMO
🎮 Dave & Buster's Entertainment $PLAY
👀 What Markets Will Be Watching
🏭 Industrial Production
A key read on US manufacturing and economic activity.
Stronger than expected:
✅ Bullish for industrials, cyclicals, and economic growth stocks.
Weaker than expected:
⚠️ Could reinforce expectations for Fed rate cuts.
🏠 NAHB Housing Market Index
Measures homebuilder confidence.
Important for:
Homebuilders
Housing stocks
Mortgagesensitive sectors
📊 Earnings To Watch
🤖 $AIOT (Powerfleet)
AI, IoT, fleet management demand
Margin and recurring revenue trends
🎮 $PLAY (Dave & Buster's)
Consumer spending health
Entertainment and discretionary demand
☁️ $DOMO
Enterprise software spending
AI analytics adoption
🌿 $CGC & $HITI
Cannabis sector sentiment
Profitability and cash burn metrics
⭐ Market Focus Today
1️⃣ NY Fed Manufacturing
2️⃣ Industrial Production
3️⃣ Housing Market Data
4️⃣ Consumer spending signals from $PLAY
5️⃣ Software/AI demand commentary from $DOMO
📈 With the Fed meeting approaching, today's economic data could have an outsized impact on Treasury yields, ratecut expectations, and overall market sentiment.
2
149
