
Technical oversold conditions suggest a bounce toward $0.75 resistance zone within two weeks. However, the underlying bearish structure points to eventual tests of $0.55 support levels.… dlvr.it/TT1Gzs #APT #CryptoPrediction #BlockchainNews #CryptoMarket #PriceAnalysis
37

Jun 11
𝐗𝐑𝐏 𝐏𝐫𝐢𝐜𝐞 𝐓𝐨𝐝𝐚𝐲: 𝐗𝐑𝐏 𝐄𝐓𝐅𝐬 𝐃𝐫𝐚𝐰 𝐈𝐧𝐟𝐥𝐨𝐰𝐬 𝐚𝐬 𝐁𝐢𝐭𝐜𝐨𝐢𝐧 𝐅𝐮𝐧𝐝𝐬 𝐅𝐚𝐜𝐞 𝐅𝐫𝐞𝐬𝐡 𝐎𝐮𝐭𝐟𝐥𝐨𝐰𝐬
XRP ETFs saw fresh inflows as bitcoin funds recorded outflows, but XRP’s price broke below $1.13 keeps traders cautious near key support.
#XRP #XRPETFs #BitcoinETFs #CryptoMarket #ETFInflows #PriceAnalysis #analyticsinsight #analyticsinsightmagazine
Read More 👇
zurl.co/AhfXE

35

Jun 8
1
11

Jun 8
$ETH rejected at the 20D EMA and slipped below $2.8K.
Next support sits at $2.62K — below that, $2.1K is in play.
Momentum favors sellers unless ETH reclaims the moving averages.
Time is running out for bulls.
#ETH #Ethereum #priceanalysis
1
1
29

May 22
$ETH rejected at the 20D EMA and slipped below $2.8K.
Next support sits at $2.62K — below that, $2.1K is in play.
Momentum favors sellers unless ETH reclaims the moving averages.
Time is running out for bulls.
#ETH #Ethereum #priceanalysis
1
3
32

May 17
Can ZEC hit $750 as leverage risk builds under the rally? crypto.news/can-zec-hit-750-… #PriceAnalysis #Zcash
2
87

XRPの価格が1.40ドルの抵抗線を突破、次は2ドルを奪還できるか?
$XRP $RLUSD
✅原油価格の下落に伴い暗号資産市場全体が回復する中、XRPの価格は1.40ドルの抵抗線を突破し、一時1.45ドルまで上昇した。
✅XRPは依然として広範な対称三角形パターンの中で推移しているが、下降トレンドラインの抵抗線を上抜けすれば、1.66ドル、さらには2ドルへの上昇への道が開ける可能性がある。
✅XRPが4月以来の高値更新を続けている中、MACDがポジティブクロスオーバーを形成し、スーパートレンドも緑色を維持するなど、テクニカル指標は強気転じている。
XRP price breaks past $1.40 resistance, can it reclaim $2 next?
$XRP #XRP #Ripple #XRPArmy #XRPCommunity #暗号資産 #暗号通貨 #Cryptocurrency
crypto.news/xrp-price-breaks… #PriceAnalysis #XRP
7
319

Apr 24
Can Solana price break $90 resistance as it forms a bullish channel? crypto.news/can-solana-price… #PriceAnalysis #Solana
1
2
14

Apr 24
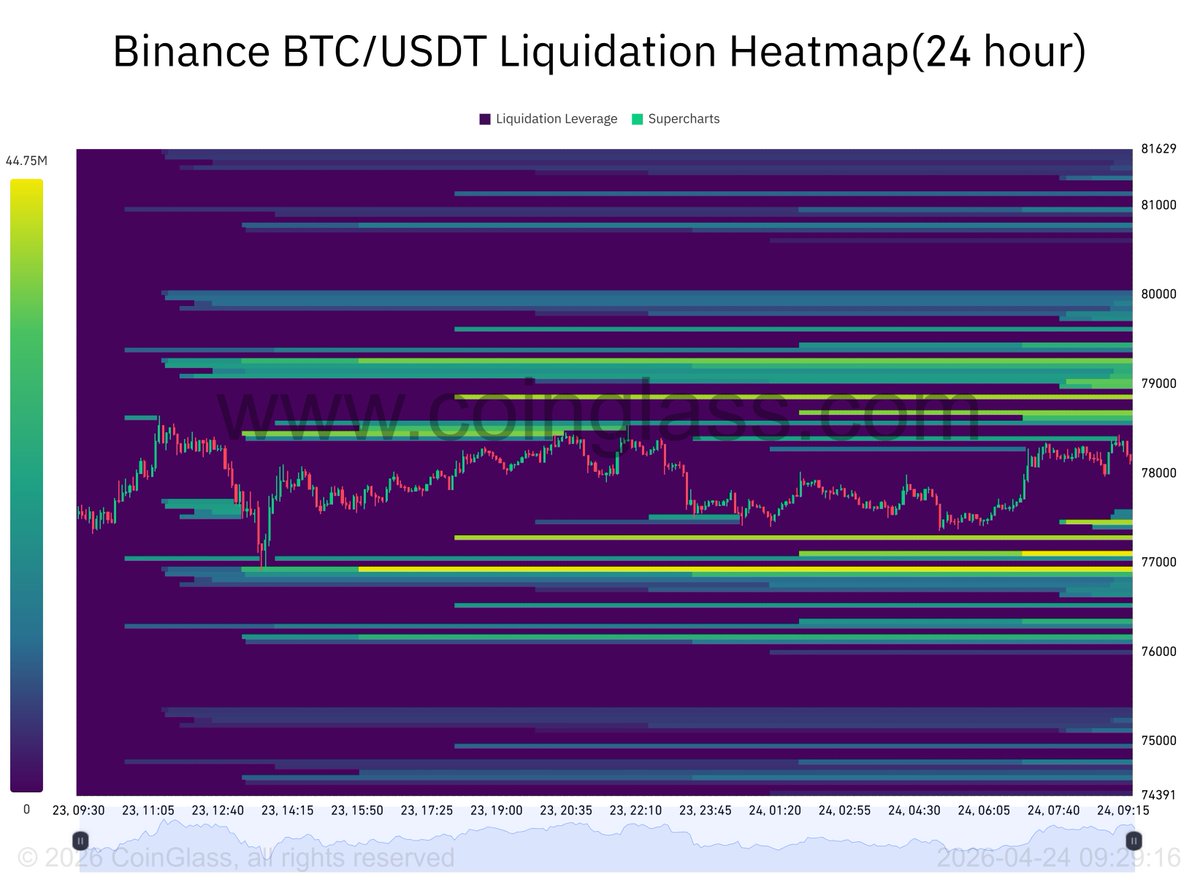
🔥 Mapa de liquidaciones en #BTC hoy 24-04.
Según el mapa de liquidaciones en coinglass existe una alta concentración de liquidaciones cerca de ⬇ $76.961 -⬆$78.469.
Ojo a posible volatilidad y "caza de CORTOS" hay una zona de liquidaciones en la parte alta del gráfico; aunque el gráfico se muestra en un rango a corto plazo.
Niveles clave:
👉Soporte $76.539
👉Resistencia $78650
¡Precaución!
El gráfico nos muestra que BTC$BTC se encuentra en un rango en HTF, con zona de liquidación de cortos por $45.01M en los $78.469 y de largos por $58.29M en los $76.961👀
#BTC #PriceAnalysis #Macro #Insights
3
5
68

Trump says a U.S.–Iran deal is close.
Less geopolitical tension = risk-on sentiment 📈
Markets already reacting… Bitcoin holding strong near key levels.
If confirmed → breakout potential.
If it fails → volatility returns.
Stay sharp. 👀 #Bitcoin
Trump says U.S. is “very close to making a deal with Iran”, how will Bitcoin react? crypto.news/trump-says-u-s-i… #Bitcoin #PriceAnalysis
2
19

Apr 10
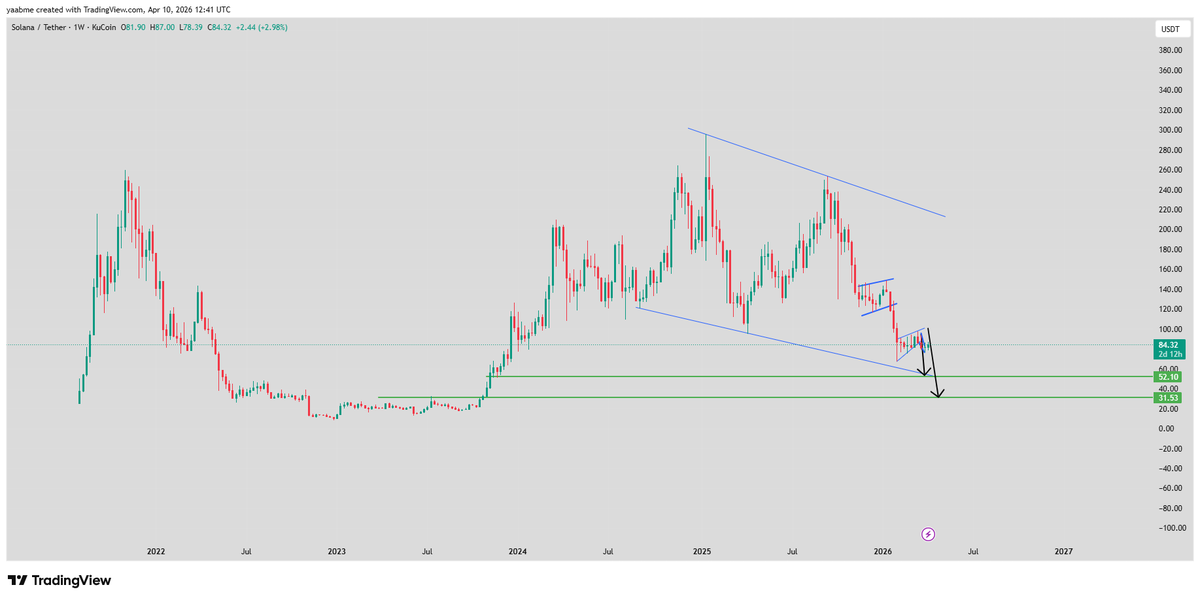
SOL briefly reclaimed $85 but remains below the 50-day SMA (~$86). Range: $76–$92. A repeating pattern suggests downside risk—failure to break $86 could send it toward ~$52.
#Solana #SOL #Crypto #Trading #PriceAnalysis #Blockchain
2
74

XRP is currently maintaining its position above the $1.30 mark, with trading volume on the rise. According to NS3.AI, the cryptocurrency is navigating a narrow price range and requires a breakthrough above the $1.33–$1.35 resistance zone to initiate a more robust rally. Holding the $1.30–$1.32 support zone is crucial for sustaining its current trend.
#XRP #Crypto #SupportLevel #TradingRange #Resistance #PriceAnalysis #Cryptocurrency
2
44
Mar 30
Solana price confirms bearish flag pattern as ETFs break 6-week inflow streak, will it crash? crypto.news/solana-price-con… #ETF #PriceAnalysis #Solana
3
24

As blockchain interoperability becomes a central theme in Web3 development, the Cosmos (ATOM) network stands at a critical juncture. #BLOCKCHAIN #Cosmos #CRYPTOCURRENCY #marketforecast #Priceanalysis
bitcoinworld.co.in/cosmos-at…
1
81

Mar 24
Bitcoin has reportedly seen an increase of 2.8% in March to date. This upward movement follows a period of declines earlier in the year, with the cryptocurrency experiencing a 10.17% decrease in January and a 14.94% decrease in February.
These recent monthly performances illustrate a volatile start to the year for Bitcoin. The reported figures indicate a challenging initial two months, followed by a partial recovery in the current month, suggesting a dynamic market environment.
Monthly percentage changes in asset prices often reflect evolving market sentiment, short-term trading behaviors, and responses to various internal and external economic factors. A recovery, even partial, after significant drops can be interpreted as a re-evaluation by market participants or a reaction to specific catalysts.
The continuation of this positive momentum through the end of March is uncertain. Market observers will likely monitor several factors, including broader economic indicators, shifts in investor capital flows, and any significant news events that could influence price direction. The final monthly close will offer further data points for analysis.
#Bitcoin #CryptoMarket #PriceAnalysis

6
8
65
As the cryptocurrency market continues to mature, investors and analysts globally are scrutinizing the long-term trajectory of major assets like Shiba Inu (SHIB). #BLOCKCHAIN #CRYPTOCURRENCY #DigitalAssets #marketforecast #Priceanalysis
bitcoinworld.co.in/shiba-inu…

2
75

Mar 23
🧮 Smart Money Setup 06 Indicator to TradingView - Free - [TradingFinder]
📊 It highlights zones such as liquidity areas, order blocks, and price imbalances, helping traders understand where price may shift direction or continue its movement.
📝 These areas often form before noticeable changes in market structure.
📕 The indicator provides a visual framework instead of fixed signals, making it adaptable across different timeframes and markets, including forex, crypto, and stocks.
🌐 Now available on TradingFinder’s official website:
tradingfinder.com/products/i…
#tflab #tradingfinder #Forex #TradingViewIndicator #Crypto #PriceAnalysis #SmartMoneyConcept #SMCSetup #OrderBlocks #LiquidityZones #DayTrading #MarketStructure
2
125
Mar 19
Can XRP price recover above $1.60 as a bullish reversal pattern forms? crypto.news/can-xrp-price-re… #Adoption #BearMarket #PriceAnalysis #whales #XRP
2
19

Mar 18
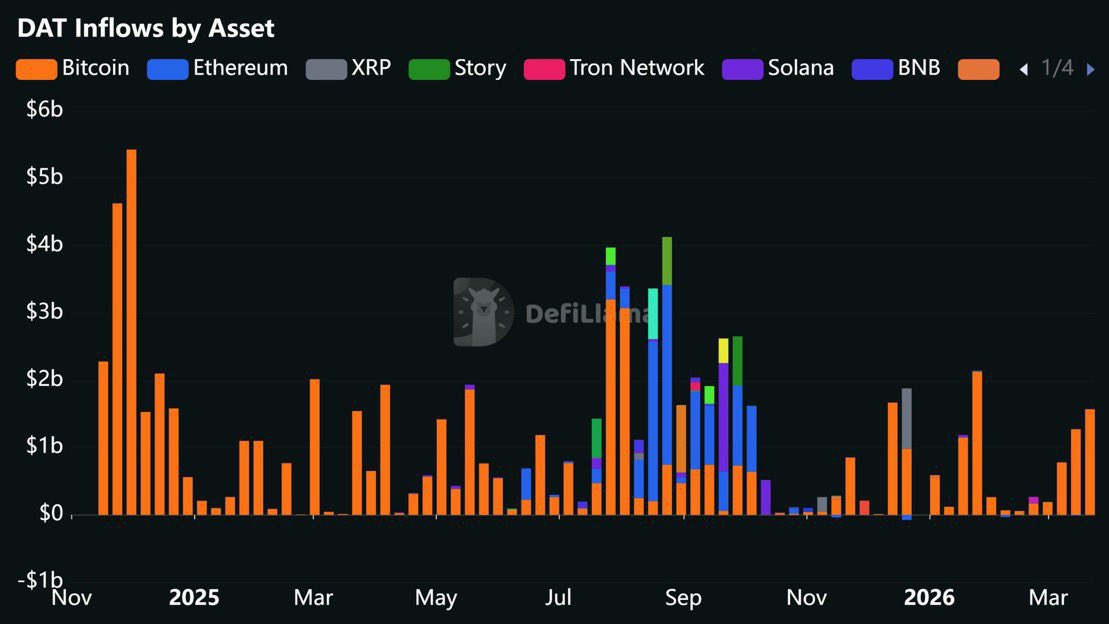
capital is quietly flooding back into crypto
from 3 directions at once
1/ ETF FLOWS
🟠 $BTC ETFs just posted 3 straight weeks
of net inflows after a 5-week streak of $4B in outflows.
week 1 (feb 27): $787M
week 2 (mar 6): $568M
week 3 (mar 13): $767M.. zero outflow days
$1.34B net inflows in march alone and this happened DURING a war.
blackrock’s IBIT added $600M in a single week. fidelity added $147M. institutions didn’t panic sell.. they bought the dip.
and bitcoin ETFs net positive for 30 days straight while gold ETFs saw record outflows in the same window.
capital is literally moving from gold → #BTC at the institutional level.
⸻
2/ STABLECOIN INFLOWS
total stablecoin market cap just hit $316B
$1.8B in the last 7 days alone.
5% in the last 30 days.
USDC is up 8% in a month. sky dollar (USDS) up 20%. USYC (yield-bearing stablecoin) up 19% in a week.
172M wallet addresses now hold stablecoins. in january 2026, stablecoin networks moved $10 TRILLION in a single month.
when stablecoin supply expands, it’s dry powder entering the system..
⸻
3/ ALTCOIN ETFs ARE LIVE
not just BTC anymore.
ETH spot ETFs: $26.7M on friday
SOL spot ETFs: $7.6M
DOGE spot ETFs: net positive
LINK spot ETFs: net positive
even AVAX saw its highest single-day inflow since launch
⸻
so you have:
→ ETF inflows accelerating (3 weeks straight, $2.1B )
→ stablecoin supply expanding ($316B, 5% monthly)
→ altcoin ETFs absorbing capital across multiple assets
→ gold-to-BTC rotation confirmed at institutional level
conditions getting slightly better
#BTC #PriceAnalysis #MacroInsights


2
2
5
561

Mar 17
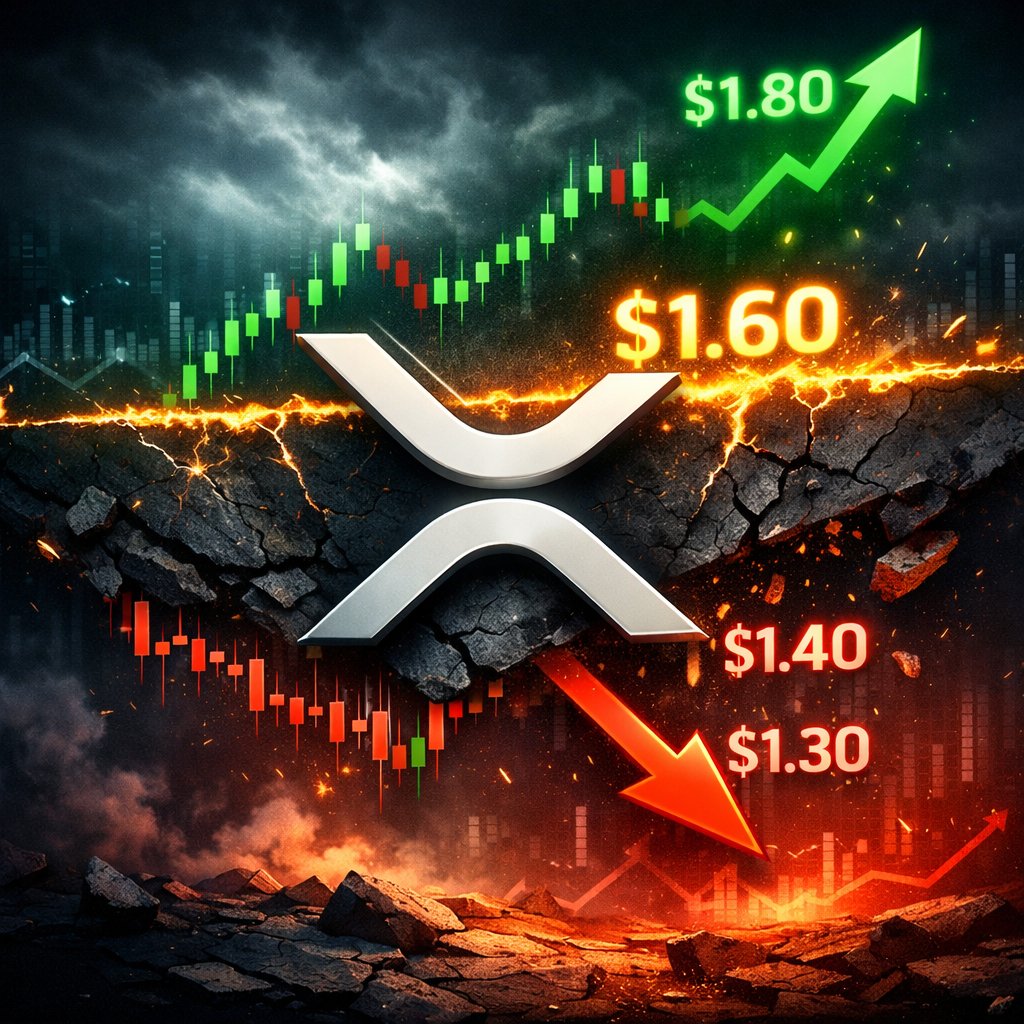
Market Update: $XRP After Recent Price Action$XRP
has recently made an impressive move, reaching a key resistance level at $1.60. While this marks an important milestone, there's a chance that we could see a false breakout above this point, similar to previous price action patterns. If $1.60 doesn’t hold as support, we might experience a sharp retracement, potentially pushing XRP back below $1.40, which would likely shake out some of the weaker traders. Keeping a close eye on this level will be crucial to determine whether this breakout is a sustainable move or just a temporary spike.XRP’s growing wallet activity signals a positive outlook for the asset's long-term potential. However, the $1.60 resistance remains a major hurdle. If $XRP can break through this level, it could open the door to a further rally, potentially reaching $1.80 or even $2. On the flip side, a rejection at $1.60 could send XRP back to lower support zones like $1.40 or $1.30, before any new upward momentum can materialize.
Will XRP manage to break through $1.60 and continue its rally, or will it face a rejection and fall back to lower support levels?
#PriceAnalysis #MarketTrends #XRPCommunity
1
1
17
1,823