
Jun 16
NIFTY Expiry Day Market Structure Outlook
Yesterday, NIFTY delivered a near-perfect reaction from the projected ToT zone.
The index opened with a strong gap-up and immediately expanded towards 24,011, almost precisely testing the previously discussed 24,020 liquidity objective. However, once premium valuations were achieved, profit-booking flows emerged and dragged the index towards the day's low near 23,817 before finally settling around 23,853.
This type of price behaviour reflects a classic:
➡️ target fulfillment event
➡️ higher-zone liquidity extraction
➡️ institutional profit distribution
➡️ inventory rebalancing near premium territory
Most importantly...
Smart Money appears to have used the opening gap-up enthusiasm to offload inventory into strength while simultaneously absorbing supply near lower value zones during the second half.
As a result, today's expiry is likely to remain inside a rotational and range-bound framework unless one side achieves decisive value acceptance.
🔹 Upside Liquidity Migration Zones:
🚀 23,960 (Most Crucial Level)
Sustained acceptance above 23,960 may trigger:
⚡ short-covering acceleration
⚡ dealer hedge adjustments
⚡ gamma expansion
towards:
🚀 24,020
🚀 24,060
A decisive move above 24,060 may open the gates for fresh premium value discovery till 24201.
🔻 Downside Demand Absorption Zones:
➡️ 23,830
➡️ 23,766
➡️ 23,660
Failure to defend 23,760 could result in a deeper liquidity sweep towards lower demand clusters.
Current market structure reflects:
⚠️ post-rally inventory balancing
⚠️ expiry-related gamma warfare
⚠️ liquidity inducement around option strikes
⚠️ non-linear intraday reversals
Therefore, expect:
➡️ sharp opening moves
➡️ sudden reversals from extremes
➡️ false breakouts and false breakdowns
➡️ volatility spikes near major option strikes
Today's objective is not prediction...
Today's objective is participation with discipline.
Remember:
On expiry days, Smart Money is usually trading volatility...
Retail traders are usually trading emotions.
Choose your side wisely. 📈⚡
Disclaimer:
I am not SEBI registered.
This analysis is shared purely for educational purposes and reflects my personal interpretation of market structure and price action only.
#StockMarket #PriceAction #Trading #SwingTrading #Investing #TraderLife #Nifty #StockMarket #Trading #Geopolitics #RiskManagement #TradingDiscipline #ProcessOverPrediction #StockMarket #Discipline #Budget #TradeSmart #nifty50 #nifty #StockMarketIndia #unionbudget #Stocktobuy #StockMarket #NiftyIt #Niftyenergy #NiftyPSU #Budget2026 #Budgetexpectations #Niftybank #usiranwar #niftyoptions #crudeoil #natgas #usoil #crude #brent #naturalgas
1
9
1,816
Jun 12
NIFTY Market Structure Outlook 📊⚡
Yesterday, NIFTY opened with a gap-down near 23,104 and once again revisited the recent swing low zone around 23,072. However, despite the early weakness, sellers failed to establish lower value acceptance.
The index subsequently witnessed a rotational recovery towards 23,327 before settling near 23,161.
This price behaviour is characteristic of:
➡️ liquidity sweep below visible support
➡️ demand absorption near discount territory
➡️ failed downside auction
➡️ intraday mean-reversion from an oversold value area
Now, overnight macro developments have altered the sentiment landscape considerably.
🟢 Optimism is building around a potential US-Iran peace framework that could see further progress over the weekend, boosting risk appetite across Asian markets. Oil prices have retreated sharply, easing inflation concerns and supporting equities globally.
🟢 US Oil is now trading below $87 the extreme war-spike levels, while Asian equities are reacting positively to the possibility of geopolitical de-escalation.
🟡 Gold gained strongly overnight, reflecting continued hedging demand despite improving risk sentiment.
🟡 The ECB has also delivered its first rate hike since 2023, highlighting persistent inflation concerns within the Eurozone.
From a technical market-structure perspective...
The inability of bears to sustain below 23,100 keeps the recent decline classified as a corrective liquidity event rather than a structural breakdown.
🔹 Upside Liquidity Migration Zones (Unchanged)
➡️ 23,332
➡️ 23,411
➡️ 23,560
➡️ 23,663
A decisive acceptance above 23,663 may trigger:
⚡ short-covering acceleration
⚡ volatility expansion
⚡ inventory rebalancing by institutions
towards higher value territory.
🔻 Downside Demand Absorption Zones
➡️ 23,150
➡️ 23,100
As long as the market continues defending these lower liquidity shelves, downside weakness may remain corrective in nature.
Current structure reflects:
⚠️ post-news repricing dynamics
⚠️ volatility clustering near support
⚠️ liquidity engineering around key pivots
⚠️ transition from distribution towards re-accumulation
Today, the key question is whether NIFTY can reclaim higher-value territory above 23,560 and convert it into acceptance.
Trust the structure. Ignore the headlines after they become popular. Price usually reacts before the narrative catches up. 📈⚡
Disclaimer:
I am not SEBI registered.
This analysis is shared purely for educational purposes and reflects my personal interpretation of market structure and price action only.
#StockMarket #PriceAction #Trading #SwingTrading #Investing #TraderLife #Nifty #StockMarket #Trading #Geopolitics #RiskManagement #TradingDiscipline #ProcessOverPrediction #StockMarket #Discipline #Budget #TradeSmart #nifty50 #nifty #StockMarketIndia #unionbudget #Stocktobuy #StockMarket #NiftyIt #Niftyenergy #NiftyPSU #Budget2026 #Budgetexpectations #Niftybank #usiranwar #niftyoptions #crudeoil #natgas #usoil #crude #brent #naturalgas
6
957
Jun 11
NIFTY Market Structure Outlook 📊⚡
Yesterday, NIFTY opened with a gap-up near 23,255 and initially expanded towards 23,425, indicating early bullish price acceptance and momentum continuation.
However, as the session progressed, selective pressure from a handful of heavyweight constituents, coupled with Sensex expiry-related positioning dynamics, resulted in a gradual downside repricing. The index eventually drifted towards 23,184 before closing near 23,216.
Interestingly, the broader market internals remained relatively resilient while index movement was largely influenced by concentrated heavyweight activity.
This type of session typically reflects:
➡️ expiry-driven inventory adjustments
➡️ index-level gamma management
➡️ selective heavyweight rebalancing
➡️ non-broad-based downside pressure
Adding another layer of complexity...
US Oil witnessed a sharp overnight spike from approximately $87 to $94 following escalating geopolitical tensions and supply disruption concerns across the Middle East region.
Higher crude prices often introduce:
⚠️ inflationary concerns
⚠️ currency pressure
⚠️ risk-premium expansion
⚠️ sentiment-driven volatility
for emerging markets.
🔹 Upside Liquidity Migration Zones Remain Unchanged:
🚀 23,332
🚀 23,411
🚀 23,663
A decisive acceptance above 23,663 may trigger:
⚡ short-covering acceleration
⚡ momentum expansion
⚡ higher-value repricing
towards:
🚀 23,766
🚀 23,830
🚀 23,960
🔻 Downside Demand Absorption Zones Remain Unchanged:
➡️ 23,150
➡️ 23,100
➡️ 23,000
As long as these zones continue absorbing supply, downside weakness may remain corrective rather than structurally bearish.
Current market structure reflects:
⚠️ Sensex expiry-induced distortions
⚠️ volatility clustering around key pivots
⚠️ liquidity engineering by institutional participants
⚠️ rotational compression before directional expansion
Today, traders should expect:
➡️ sharp intraday reversals
➡️ expiry-related liquidity sweeps
➡️ sentiment-driven reactions to crude oil developments
➡️ non-linear price discovery
The battle is no longer between Bulls and Bears...
It is between Liquidity and Volatility. 📈⚡
Disclaimer:
I am not SEBI registered.
This analysis is shared purely for educational purposes and reflects my personal interpretation of market structure and price action only. This is not a buy/sell recommendation.
#StockMarket #PriceAction #Trading #SwingTrading #Investing #TraderLife #Nifty #StockMarket #Trading #Geopolitics #RiskManagement #TradingDiscipline #ProcessOverPrediction #StockMarket #Discipline #Budget #TradeSmart #nifty50 #nifty #StockMarketIndia #unionbudget #Stocktobuy #StockMarket #NiftyIt #Niftyenergy #NiftyPSU #Budget2026 #Budgetexpectations #Niftybank #usiranwar #niftyoptions #crudeoil #natgas #usoil #crude #brent #naturalgas
1
4
885
Jun 10
NIFTY Market Structure Outlook 📊⚡
Yesterday's session was a perfect example of expiry driven market engineering.
While most broader market indices, including Banking, Financials, Auto and Midcaps, were trading with gains of more than 1%, NIFTY remained under pressure due to heavyweight-specific positioning and expiry-related inventory adjustments.
The index opened near 23,259 and witnessed a sharp liquidity sweep towards 23,104 during the first half. However, sellers failed to achieve meaningful downside acceptance and the market gradually recovered throughout the session before closing near 23,242.
This type of price behaviour generally reflects:
➡️ liquidity extraction below visible support
➡️ dealer gamma rebalancing
➡️ expiry-induced volatility distortion
➡️ absorption of panic selling near discount zones
Most importantly...
The inability of bears to sustain below 23,150 suggests that lower-zone inventory absorption remains active.
Now that expiry-related distortions are behind us, market has the potential to witness a larger directional expansion move.
🔹 Upside Liquidity Migration Zones:
➡️ 23,332
➡️ 23,411
➡️ 23,663
A decisive acceptance above 23,663 may trigger:
⚡ short-covering acceleration
⚡ momentum repricing
⚡ higher-value migration
towards:
➡️ 23,766
➡️ 23,830
➡️ 23,960
Beyond 23,960, the market may enter a fresh bullish auction phase with increased probability of premium value discovery.
🔻 Downside Demand Absorption Zones:
➡️ 23,150
➡️ 23,100
➡️ 23,000
As long as these zones continue absorbing supply, downside may remain corrective rather than impulsive.
Current structure reflects:
⚠️ post-expiry inventory realignment
⚠️ volatility compression before expansion
⚠️ liquidity vacuum formations near key pivots
⚠️ rotational accumulation beneath resistance clusters
Today's session has the potential to be significantly more directional than yesterday.
The market has spent several sessions compressing volatility...
Now it may be preparing for an expansion phase. 📈
Disclaimer:
I am not SEBI registered.
This analysis is shared purely for educational purposes and reflects my personal interpretation of market structure and price action only. This is not a buy/sell recommendation.
#StockMarket #PriceAction #Trading #SwingTrading #Investing #TraderLife #Nifty #StockMarket #Trading #Geopolitics #RiskManagement #TradingDiscipline #ProcessOverPrediction #StockMarket #Discipline #Budget #TradeSmart #nifty50 #nifty #StockMarketIndia #unionbudget #Stocktobuy #StockMarket #NiftyIt #Niftyenergy #NiftyPSU #Budget2026 #Budgetexpectations #Niftybank #usiranwar #niftyoptions #crudeoil #natgas #usoil #crude #brent #naturalgas
5
843
Jun 9
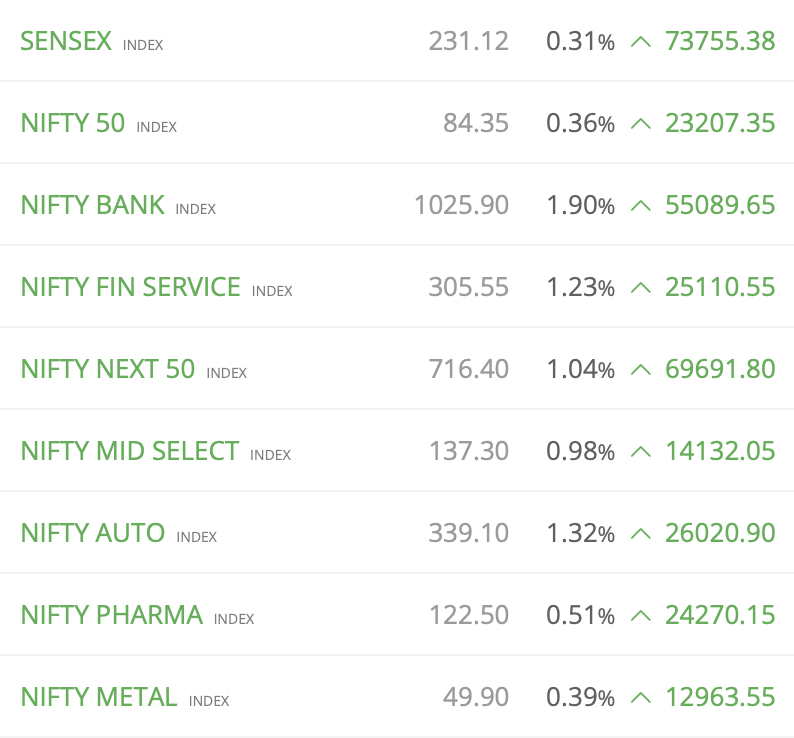
📊 A Perfect Example of How Nifty Can Be Managed on Expiry Day
Look at today's market internals:
✅ Bank Nifty: 1.90%
✅ Nifty Financial Services: 1.23%
✅ Nifty Auto: 1.32%
✅ Nifty Next 50: 1.04%
✅ Nifty Mid Select: 0.98%
✅ Nifty Pharma: 0.51%
✅ Nifty Metal: 0.39%Yet...
🔹 Nifty 50 is up only 0.36%
This clearly shows the power of a handful of heavyweight stocks in the Nifty.
On expiry day, if the major index movers are kept under control, the broader market can remain strong while the headline index appears subdued.
📌 Market breadth is positive.
📌 Most sectors are participating.
📌 But the index is not reflecting the full strength of the market.
This is why traders should never judge the market solely by Nifty's percentage move. Always track sectoral indices, market breadth, and heavyweight stock behavior.
When Bank Nifty is up nearly 2%, Auto up 1.3%, Fin Services up 1.2%, and Midcaps are strong, yet Nifty struggles to gain even 0.4%, it tells a story of index management rather than market weakness.
🎯 Expiry days often remind us that the market and the index are not always the same thing. 📈😉
#StockMarket #PriceAction #Trading #SwingTrading #Investing #TraderLife #Nifty #StockMarket #Trading #Geopolitics #RiskManagement #TradingDiscipline #ProcessOverPrediction #StockMarket #Discipline #Budget #TradeSmart #nifty50 #nifty #StockMarketIndia #unionbudget #Stocktobuy #StockMarket #NiftyIt #Niftyenergy #NiftyPSU #Budget2026 #Budgetexpectations #Niftybank #usiranwar #niftyoptions #crudeoil #natgas #usoil #crude #brent #naturalgas
9
1,147
Jun 9
NIFTY Market Structure Outlook 📊⚡
Yesterday's session unfolded remarkably close to the framework discussed in advance.
Negative global sentiment, weak overnight cues and risk-off positioning resulted in a gap-down opening near 23,080, almost exactly in line with the anticipated downside pressure.
The index printed a low near 23,070, successfully sweeping liquidity below the previously discussed support region before witnessing demand absorption and intraday stabilization. Thereafter, NIFTY recovered towards 23,267 and finally settled near 23,123.
This was a textbook example of:
➡️ opening imbalance liquidation
➡️ deep liquidity extraction
➡️ stop-loss harvesting below visible support
➡️ intraday mean reversion from discount territory
Most importantly...
The market attempted to probe beneath the projected 23,100 liquidity pocket but failed to sustain lower value acceptance.
This suggests that despite negative sentiment, bears were unable to achieve meaningful downside expansion after the initial auction.
🔻 Downside Structure Remains Unchanged:
➡️ 23,250 (now immediate resistance-turned-pivot)
➡️ 23,150
➡️ 23,100
A decisive acceptance below 23,100 may trigger another round of downside price discovery and volatility expansion.
However, if lower zones continue absorbing supply, the recent move may eventually be classified as a liquidity sweep rather than trend continuation.
🔹 Upside Recovery Levels:
➡️ 23,332
➡️ 23,411
➡️ 23,663
A successful reclaim of 23,332 would indicate restoration of higher value acceptance.
Further acceptance above 23,411 may trigger:
⚡ short-covering repricing
⚡ dealer hedging adjustments
⚡ momentum-driven recovery flows
towards the higher liquidity magnet near 23,663.
Current market structure reflects:
⚠️ post-gap-down inventory balancing
⚠️ volatility clustering near lower value territory
⚠️ liquidity inducement around psychological levels
⚠️ ongoing tug of war between distribution and re-accumulation
For today, focus should remain on whether the market continues accepting prices below 23,250 or successfully reclaims higher-value territory above it.
Remember...
Markets rarely reward the obvious move. The largest opportunities often emerge immediately after liquidity sweeps and sentiment extremes. 📈⚡
Disclaimer:
I am not SEBI registered.
This analysis is shared purely for educational purposes and reflects my personal interpretation of market structure and price action only. This is not a buy/sell recommendation.
#StockMarket #PriceAction #Trading #SwingTrading #Investing #TraderLife #Nifty #StockMarket #Trading #Geopolitics #RiskManagement #TradingDiscipline #ProcessOverPrediction #StockMarket #Discipline #Budget #TradeSmart #nifty50 #nifty #StockMarketIndia #unionbudget #Stocktobuy #StockMarket #NiftyIt #Niftyenergy #NiftyPSU #Budget2026 #Budgetexpectations #Niftybank #usiranwar #niftyoptions #crudeoil #natgas #usoil #crude #brent #naturalgas
Jun 8

NIFTY Weekly Opening Outlook 📊
Friday, NIFTY closed near 23,366 after a volatile session, keeping the index positioned near an important demand absorption region.
Over the weekend, global sentiment witnessed a noticeable shift.
🔻 Dow Jones weak
🔻 Nasdaq weak
🔻 Semiconductor Index under pressure
However,
🟢 India's GDP data emerged as a positive macro trigger, providing a counterbalance to the broader risk-off sentiment.
As of now, market participants are likely to focus more on global weakness during the opening phase, which increases the probability of a gap-down start.
🔻 Downside Liquidity Zones:
➡️ 23,250
➡️ 23,150
These remain the immediate demand clusters to monitor.
Additionally, a deep liquidity sweep towards:
⚠️ 23,100
cannot be ruled out.
Such a move may simply represent a stop-loss hunting exercise and inventory adjustment rather than a complete structural breakdown.
In fact, if lower zones absorb supply effectively, a sharp rebound from panic territory can emerge.
🔹 Upside Recovery Levels:
➡️ 23,332
➡️ 23,411
➡️ 23,663
A successful reclaim of these zones may trigger:
⚡ short-covering acceleration
⚡ volatility expansion
⚡ higher-value repricing
Current market structure suggests that participants should remain prepared for:
➡️ opening gap volatility
➡️ deep liquidity grabs
➡️ sentiment-driven panic moves
➡️ rapid intraday reversals
Remember...
When sentiment becomes excessively negative, markets often seek liquidity below obvious support levels before initiating meaningful recovery attempts.
Trade light. Stay flexible. Let price confirm direction before increasing exposure. 📈
Disclaimer:
I am not SEBI registered.
This analysis is shared purely for educational purposes and reflects my personal interpretation of market structure and price action only. This is not a buy/sell recommendation.
#StockMarket #PriceAction #Trading #SwingTrading #Investing #TraderLife #Nifty #StockMarket #Trading #Geopolitics #RiskManagement #TradingDiscipline #ProcessOverPrediction #StockMarket #Discipline #Budget #TradeSmart #nifty50 #nifty #StockMarketIndia #unionbudget #Stocktobuy #StockMarket #NiftyIt #Niftyenergy #NiftyPSU #Budget2026 #Budgetexpectations #Niftybank #usiranwar #niftyoptions #crudeoil #natgas #usoil #crude #brent #naturalgas
1
7
1,063
Jun 8
NIFTY Weekly Opening Outlook 📊
Friday, NIFTY closed near 23,366 after a volatile session, keeping the index positioned near an important demand absorption region.
Over the weekend, global sentiment witnessed a noticeable shift.
🔻 Dow Jones weak
🔻 Nasdaq weak
🔻 Semiconductor Index under pressure
However,
🟢 India's GDP data emerged as a positive macro trigger, providing a counterbalance to the broader risk-off sentiment.
As of now, market participants are likely to focus more on global weakness during the opening phase, which increases the probability of a gap-down start.
🔻 Downside Liquidity Zones:
➡️ 23,250
➡️ 23,150
These remain the immediate demand clusters to monitor.
Additionally, a deep liquidity sweep towards:
⚠️ 23,100
cannot be ruled out.
Such a move may simply represent a stop-loss hunting exercise and inventory adjustment rather than a complete structural breakdown.
In fact, if lower zones absorb supply effectively, a sharp rebound from panic territory can emerge.
🔹 Upside Recovery Levels:
➡️ 23,332
➡️ 23,411
➡️ 23,663
A successful reclaim of these zones may trigger:
⚡ short-covering acceleration
⚡ volatility expansion
⚡ higher-value repricing
Current market structure suggests that participants should remain prepared for:
➡️ opening gap volatility
➡️ deep liquidity grabs
➡️ sentiment-driven panic moves
➡️ rapid intraday reversals
Remember...
When sentiment becomes excessively negative, markets often seek liquidity below obvious support levels before initiating meaningful recovery attempts.
Trade light. Stay flexible. Let price confirm direction before increasing exposure. 📈
Disclaimer:
I am not SEBI registered.
This analysis is shared purely for educational purposes and reflects my personal interpretation of market structure and price action only. This is not a buy/sell recommendation.
#StockMarket #PriceAction #Trading #SwingTrading #Investing #TraderLife #Nifty #StockMarket #Trading #Geopolitics #RiskManagement #TradingDiscipline #ProcessOverPrediction #StockMarket #Discipline #Budget #TradeSmart #nifty50 #nifty #StockMarketIndia #unionbudget #Stocktobuy #StockMarket #NiftyIt #Niftyenergy #NiftyPSU #Budget2026 #Budgetexpectations #Niftybank #usiranwar #niftyoptions #crudeoil #natgas #usoil #crude #brent #naturalgas
1
1
4
2,150
Jun 5
NIFTY Market Structure Outlook 📊⚡
Yesterday, NIFTY opened with a gap-down at 23,282 against the previous close of 23,405, reflecting weak overnight sentiment and cautious positioning.
The index initially extended lower towards 23,247, but interestingly, sellers failed to achieve downside follow-through. As the session progressed, aggressive demand absorption emerged near lower value zones, resulting in a steady intraday recovery.
NIFTY eventually climbed towards 23,465 and closed near 23,416, almost reclaiming the entire opening gap-down pressure.
This type of price behaviour generally indicates:
➡️ exhaustion of panic selling
➡️ successful lower-zone liquidity absorption
➡️ institutional accumulation near support clusters
➡️ failure of bears to sustain below critical demand territory
Most importantly...
The 23,250 zone continues to behave as a major structural support shelf where buyers are repeatedly defending value.
🔹 Upside Liquidity Migration Levels:
🔼 23,547
Above 23,547, market may witness fresh momentum repricing towards:
🔼 23,681
🔼23,733
🔼 23,802
A decisive acceptance above 23,802 can potentially open the path for higher value migration and volatility expansion into premium territory.
🔻 Downside Demand Absorption Levels:
➡️ 23,322
➡️ 23,286
➡️ 23,250
As long as these support clusters remain intact, the broader structure continues to favour recovery attempts rather than trend deterioration.
Current market dynamics reflect:
⚠️ gap-down rejection
⚠️ liquidity rebalancing
⚠️ rotational accumulation
⚠️ volatility compression before expansion
The battle now shifts towards whether bulls can reclaim higher value zones above 23,547 or whether the market continues oscillating within the current re-accumulation framework.
Remember...
Markets reveal strength not when they rise...
But when they refuse to fall despite negative sentiment. 📈⚡
Disclaimer:
I am not SEBI registered.
This analysis is shared purely for educational purposes and reflects my personal interpretation of market structure and price action only. This is not a buy/sell recommenadation.
#StockMarket #PriceAction #Trading #SwingTrading #Investing #TraderLife #Nifty #StockMarket #Trading #Geopolitics #RiskManagement #TradingDiscipline #ProcessOverPrediction #StockMarket #Discipline #Budget #TradeSmart #nifty50 #nifty #StockMarketIndia #unionbudget #Stocktobuy #StockMarket #NiftyIt #Niftyenergy #NiftyPSU #Budget2026 #Budgetexpectations #Niftybank #usiranwar #niftyoptions #crudeoil #natgas #usoil #crude #brent #naturalgas
1
7
1,886
Jun 4
NIFTY Market Structure Outlook 📊
Yesterday's session was a classic example of how markets engineer fear before completing a higher-timeframe objective.
NIFTY opened near 23,415 and within the first few minutes printed the day's high around 23,459. Thereafter, sustained selling pressure from the IT pack dragged the index towards the day's low near 23,151.
Most importantly...
The decline successfully filled the unfilled gap zone created during the April 7th–8th impulsive expansion phase.
And that is a classic market behaviour.
Liquidity seeks unfinished business before initiating the next auction process.
Post gap-fill completion, Banking heavyweights stepped in with aggressive demand absorption, helping NIFTY recover sharply from lower value territory. The index eventually attempted a full-session recovery and closed near 23,405.
This indicates:
➡️ successful gap-fill event
➡️ lower-zone liquidity absorption
➡️ institutional participation near demand clusters
➡️ reduction in downside inefficiency
Now moving ahead...
🔹 Upside Liquidity Migration Levels:
🔼 23,547
🔼 23,733
🔼 23,802
A decisive acceptance above 23,802 may trigger further momentum repricing and volatility expansion into higher value territory.
🔻 Retracement / Demand Absorption Levels:
➡️ 23,322
➡️ 23,286
➡️ 23,250
The 23,250 zone continues to remain the major structural support shelf from a positional perspective.
As long as market remains above this demand cluster, the recent decline can still be interpreted as a corrective re-auction rather than a broader trend reversal.
Current structure reflects:
⚠️ post-gap-fill price discovery
⚠️ sectoral rotation between IT and Banks
⚠️ liquidity rebalancing near key pivots
⚠️ volatility compression before directional expansion
Remember...
Markets often look weakest near important lows and strongest near important highs.
Trust the structure. Ignore the noise. 📈
Disclaimer:
I am not SEBI registered.
This analysis is shared purely for educational purposes and reflects my personal interpretation of market structure and price action only. This is not a buy/sell recommendation.
#StockMarket #PriceAction #Trading #SwingTrading #Investing #TraderLife #Nifty #StockMarket #Trading #Geopolitics #RiskManagement #TradingDiscipline #ProcessOverPrediction #StockMarket #Discipline #Budget #TradeSmart #nifty50 #nifty #StockMarketIndia #unionbudget #Stocktobuy #StockMarket #NiftyIt #Niftyenergy #NiftyPSU #Budget2026 #Budgetexpectations #Niftybank #usiranwar #niftyoptions #crudeoil #natgas #usoil #crude #brent #naturalgas
2
7
1,344
Jun 3
NIFTY Technical Outlook 📊
Yesterday, NIFTY registered a high near 23,557 and a low around 23,233 before finally settling at 23,483.
The session reflected a classic intraday re-auction process where aggressive downside probing was followed by selective value buying near lower demand zones.
Now, market enters a crucial phase with the ongoing RBI MPC meeting (June 3–5), where participants are closely monitoring policy commentary amid rising inflation concerns and geopolitical uncertainty.
Adding to the complexity, crude oil has witnessed another sharp overnight surge amid continuing geopolitical tensions involving the U.S. and Iran, increasing the probability of risk-off sentiment and elevated volatility across global markets.
From a market structure perspective:
🔻 Immediate downside demand zones:
➡️ 23,411
➡️ 23,332
➡️ 23,286
🛡️ Major positional support:
➡️ 23,250
As long as 23,250 remains structurally intact, the current decline can still be classified as a corrective repricing rather than a broader trend failure.
On the upside, sustained acceptance above current value territory may trigger rotational recovery towards:
🚀 23,547
🚀 23,733
🚀 23,802
A decisive reclaim of 23,802 may further activate:
⚡ short-covering acceleration
⚡ volatility expansion
⚡ higher value-area migration
Current market conditions continue to reflect:
⚠️ geopolitical risk premium
⚠️ commodity-driven volatility transmission
⚠️ liquidity-induced directional swings
⚠️ RBI-event positioning and inventory adjustment
This is a market where reaction is likely to be driven by headlines first and technical confirmation later.
Trade lighter. Trade selectively. Let the market reveal its hand before increasing exposure.
Disclaimer:
I am not SEBI registered.
This analysis is shared purely for educational purposes and reflects my personal interpretation of market structure and price action only. This is not a buy/sell recommendation.
#StockMarket #PriceAction #Trading #SwingTrading #Investing #TraderLife #Nifty #StockMarket #Trading #Geopolitics #RiskManagement #TradingDiscipline #ProcessOverPrediction #StockMarket #Discipline #Budget #TradeSmart #nifty50 #nifty #StockMarketIndia #unionbudget #Stocktobuy #StockMarket #NiftyIt #Niftyenergy #NiftyPSU #Budget2026 #Budgetexpectations #Niftybank #usiranwar #niftyoptions #crudeoil #natgas #usoil #crude #brent #naturalgas
1
14
1,251
Jun 2
#Nifty50 23547
ON YOUR SCREEN!!
Thank God.
#StockMarket #PriceAction #Trading #SwingTrading #Investing #TraderLife #Nifty #StockMarket #Trading #Geopolitics #RiskManagement #TradingDiscipline #ProcessOverPrediction #StockMarket #Discipline #Budget #TradeSmart #nifty50 #nifty #StockMarketIndia #unionbudget #Stocktobuy #StockMarket #NiftyIt #Niftyenergy #NiftyPSU #Budget2026 #Budgetexpectations #Niftybank #usiranwar #niftyoptions #crudeoil #natgas #usoil #crude #brent #naturalgas
Jun 2
NIFTY Expiry Day Note 📊
Yesterday, NIFTY registered a high near 23,733 and a low near 23,357 as global risk sentiment deteriorated following US-Iran developments. Simultaneously, US Oil witnessed an intraday spike of nearly 6%, resulting in aggressive volatility expansion across global markets.
Today is EXPIRY DAY.
Expect:
⚠️ headline-driven volatility
⚠️ gamma-induced reversals
⚠️ sudden liquidity vacuums
⚠️ sharp directional swings without warning
Remember, today's market may react to NEWS first and technicals later.
Therefore:
✅ Trade with reduced quantity
✅ Focus only on high-conviction setups
✅ Limit yourself to 3-5 quality trades for the entire session
✅ Follow complete 3PP (Plan • Patience • Protection of Profits)
🔹 Levels To Watch
Support / Demand Zones:
➡️ 23,322
➡️ 23,298
A breach below these levels may trigger another round of downside price discovery.
Upside Recovery Zones:
🚀 23,402
🚀 23,484
🚀 23,547
Acceptance above these levels may lead to short-covering and higher-value repricing throughout the session.
This is not the environment to overtrade.
Protecting capital is also a profitable trade.
The objective today is not to catch every move...
The objective is to survive volatility and preserve consistency.
Disclaimer:
I am not SEBI registered.
This analysis is shared purely for educational purposes and reflects my personal interpretation of market structure and price action only. This is not a buy/sell recommendation.
#StockMarket #PriceAction #Trading #SwingTrading #Investing #TraderLife #Nifty #StockMarket #Trading #Geopolitics #RiskManagement #TradingDiscipline #ProcessOverPrediction #StockMarket #Discipline #Budget #TradeSmart #nifty50 #nifty #StockMarketIndia #unionbudget #Stocktobuy #StockMarket #NiftyIt #Niftyenergy #NiftyPSU #Budget2026 #Budgetexpectations #Niftybank #usiranwar #niftyoptions #crudeoil #natgas #usoil #crude #brent #naturalgas
6
1,230
Jun 1
NIFTY Market Structure Outlook 📊⚡
CP : 23,547
Friday’s session witnessed an exceptionally wide trading range with NIFTY registering a high near 24,002 and a low near 23,484.
The sharp downside displacement was largely amplified by MSCI rebalancing-related flows, creating temporary liquidity distortions across heavyweight constituents. Such events often trigger forced inventory adjustments and accelerated order-flow imbalances.
Interestingly, this decline may have also provided an opportunity for bears to significantly reduce short exposure through aggressive profit booking near lower value zones.
Now the most critical reference point for the coming sessions remains:
🔻 23,484 Friday’s Low
This level now acts as a major liquidity shelf and structural support pivot.
A decisive acceptance below 23,484 could trigger another downside auction towards:
➡️ 23,411
➡️ 23,332
➡️ 23,286
Thereafter, the broader demand absorption cluster near:
🛡️ 23,250
becomes the most important institutional support zone from a positional perspective.
As long as 23,250 remains intact, the broader structure may still be classified as corrective rather than a complete trend reversal.
On the upside...
Any recovery from the current price zone of 23,547 and successful reclamation of higher value territory may initiate a rotational recovery towards:
🚀 23,733
🚀 23,802
A sustained acceptance above these levels may further trigger:
⚡ short-covering repricing
⚡ volatility expansion
⚡ inventory rebalancing by institutional participants
Current market conditions continue to reflect:
⚠️ post-rebalancing price discovery
⚠️ elevated volatility clustering
⚠️ liquidity vacuum formations
⚠️ non-linear directional rotations
Therefore, traders should focus on acceptance and rejection around key reference zones rather than reacting to headline-driven sentiment.
Remember...
Markets often create maximum confusion near inflection points before revealing the next directional auction. 📈⚡
Disclaimer:
I am not SEBI registered.
This analysis is shared purely for educational purposes and reflects my personal interpretation of market structure and price action only. This is not a buy/sell recommendation.
#StockMarket #PriceAction #Trading #SwingTrading #Investing #TraderLife #Nifty #StockMarket #Trading #Geopolitics #RiskManagement #TradingDiscipline #ProcessOverPrediction #StockMarket #Discipline #Budget #TradeSmart #nifty50 #nifty #StockMarketIndia #unionbudget #Stocktobuy #StockMarket #NiftyIt #Niftyenergy #NiftyPSU #Budget2026 #Budgetexpectations #Niftybank #usiranwar #niftyoptions #crudeoil #natgas #usoil #crude #brent #naturalgas
9
2,082
May 29
NIFTY Market Structure View 📊⚡
On Wednesday closed near 23,907.
Interestingly, overnight panic narrative initially created expectations of aggressive downside continuation. However, as the session evolved, Gift NIFTY itself rebounded sharply and again started trading above the 23,900 psychological acceptance zone.
And that is exactly why I always say:
Trust the CHART... not the NOISE.
Because price structure reacts to:
➡️ liquidity positioning
➡️ institutional inventory flow
➡️ demand absorption dynamics
....not social media panic.
Now coming to the broader structure:
As long as NIFTY sustains above:
➡️ 23,900
➡️ 23,830
bullish rotational framework still remains technically active.
Upside liquidity migration zones continue to remain placed at: 23,960 → 23,980 → 23,996
A decisive acceptance above 23,996 may again trigger:
⚡ momentum expansion
⚡ short-covering acceleration
⚡ higher value-area repricing
towards:
➡️ 24,147
➡️ 24,201
On the downside, failure to sustain above 23,900 may again expose market towards:
➡️ 23,830
➡️ 23,660 support absorption zones
Current market behaviour still reflects:
⚠️ volatility compression before expansion
⚠️ gamma-driven intraday reversals
⚠️ liquidity inducement near psychological levels
⚠️ rotational tug of war between breakout buyers and profit-booking flows
At present, broader structure continues to favour controlled bullish repricing unless key support shelves fail decisively.
Disclaimer:
I am not SEBI registered.
This analysis is shared purely for educational purposes and reflects my personal interpretation of market structure and price action only. This is not a buy/sell recommendation.
#StockMarket #PriceAction #Trading #SwingTrading #Investing #TraderLife #Nifty #StockMarket #Trading #Geopolitics #RiskManagement #TradingDiscipline #ProcessOverPrediction #StockMarket #Discipline #Budget #TradeSmart #nifty50 #nifty #crudeoil #StockMarketIndia #unionbudget #Stocktobuy #StockMarket #NiftyIt #Niftyenergy #NiftyPSU #Budget2026 #Budgetexpectations #Niftybank #usiranwar #niftyoptions #crudeoil #natgas #usoil #crude #brent #naturalgas
4
1,156
May 27
#Usoil $87 #Crudeoil
Few weeks back… when USOIL was around $101, I shared a view that if crude fails to hold the $107–111 zone, then the next 6 months could turn extremely bearish.
At that time, majority sentiment was screaming $150 - 200 because of geopolitical tensions, war fears and supply concerns.
But charts were telling a different story.
Today USOIL touched $87.77
This is exactly why I always say:
News creates emotions.
Charts reveal structure.
Markets can remain irrational in the short term, especially during geopolitics-driven volatility… but eventually price follows structure and positioning.
I’m not celebrating being right.
Because in markets…
“I MAY BE WRONG” should always remain part of every trader’s mindset.
The purpose of sharing this was never prediction marketing.
It was simply to show how important it is to:
• Respect price action
• Ignore crowd psychology
• Avoid emotional trading based on headlines
• And trust risk management over opinions
Still believe…
If structure weakens further, deeper unwinding in crude cannot be ruled out.
This is not financial advice.
Just personal market understanding and chart reading.
#StockMarket #PriceAction #Trading #SwingTrading #Investing #TraderLife #Nifty #StockMarket #Trading #Geopolitics #RiskManagement #TradingDiscipline #ProcessOverPrediction #StockMarket #Discipline #Budget #TradeSmart #nifty50 #nifty #crudeoil #StockMarketIndia #unionbudget #Stocktobuy #StockMarket #NiftyIt #Niftyenergy #NiftyPSU #Budget2026 #Budgetexpectations #Niftybank #usiranwar #niftyoptions #crudeoil #natgas #usoil #crude #brent #naturalgas
May 13
USOIL ... CP $101 My prediction for next 6 months.
If crude is not able to hold the $107–111 zone in coming months, then I feel the next 6 months can become extremely bearish.
Targets can open for $84 / $63 / $57.
Yes… many will call this a random prediction because the majority is expecting $150–$200 due to geopolitical tensions.
But I am not predicting from news headlines.
I am simply writing what the chart structure is indicating to me.
Right now, oil is reacting strongly to war premiums, supply fears and Middle East tensions. Markets are highly volatile and moving beyond normal logic.
Technically, the $107–110 area is being seen as a major resistance and decision zone by many analysts as well.
If price sustains above it → bullish continuation remains possible.
But if rejection continues and structure weakens below those zones, then a deeper unwinding can happen very fast because commodities often move opposite to public expectations when positioning becomes overcrowded.
Again…
I MAY BE WRONG.
This is not financial advice.
Just my personal chart reading and market understanding.
In geopolitics-driven markets, anything can happen beyond logic.
#Usoil #Crudeoil #Brent #Ukoil
11
1,613
May 26
NIFTY MONTHLY EXPIRY ANALYSIS
As discussed earlier…
24000 zone was the “Decision Belt” for Monthly Expiry
Now Price is sustaining above the complete consolidation range and attempting breakout near 24060 zone.
Key Levels for Today:
🟢 24060 ... Major Resistance / Trigger Level
Sustaining above this can open gates for
24146 Expiry Spike Move till 24201
🟢 Supports Shifted Higher:
23996
23978
23959
Till Price Holds Above Support Structure…
Buyers remain in control.
But Remember…
Monthly Expiry = Volatility Premium Destruction
Don’t trade emotionally in fast candles.
Wait for confirmation… then attack with proper Risk Management.
Disclaimer:
I am not SEBI registered.
Views shared are purely educational and based on personal interpretation of market structure. This is not a buy/sell recommendation.
#StockMarket #PriceAction #Trading #SwingTrading #Investing #TraderLife #Nifty #StockMarket #Trading #Geopolitics #RiskManagement #TradingDiscipline #ProcessOverPrediction #StockMarket #Discipline #Budget #TradeSmart #nifty50 #nifty #StockMarketIndia #unionbudget #Stocktobuy #StockMarket #NiftyIt #Niftyenergy #NiftyPSU #Budget2026 #Budgetexpectations #Niftybank #usiranwar #niftyoptions #crudeoil #natgas #usoil #crude #brent #naturalgas
1
1
16
3,409
May 25
NIFTY Update 📊⚡
As shared earlier...
➡️ Gap-Up Opening Expected ✅
➡️ 23,930 shifted as major support ✅
➡️ Upside liquidity migration active ✅
And Today...
NIFTY HIGH MADE : 24,054 🚀
Perfect example of:
➡️ bullish repricing
➡️ momentum continuation
➡️ higher-zone value acceptance
This is why market structure matters more than random opinions.
When liquidity shifts higher and support acceptance strengthens, market eventually expands towards premium zones.
Most people wait for news.
Professionals track price behaviour. 📈⚡
Again...
Prediction doesn’t make money.
Planning Execution Risk Management does.
#StockMarket #PriceAction #Trading #SwingTrading #Investing #TraderLife #Nifty #StockMarket #Trading #Geopolitics #RiskManagement #TradingDiscipline #ProcessOverPrediction #StockMarket #Discipline #Budget #TradeSmart #nifty50 #nifty #StockMarketIndia #unionbudget #Stocktobuy #StockMarket #NiftyIt #Niftyenergy #NiftyPSU #Budget2026 #Budgetexpectations #Niftybank #usiranwar #niftyoptions #crudeoil #natgas #usoil #crude #brent #naturalgas
May 25
NIFTY Pre-Market Structural Outlook 📊
As everyone already knows... probability of a GAP-UP opening remains elevated considering overnight sentiment alignment and sustained higher-zone value acceptance.
All upside liquidity targets were already shared earlier... sharing once again for structural clarity:
➡️ 23,960
➡️ 24,020
➡️ further expansion possible upon momentum continuation till 24,147
Most importantly...
The market has now shifted its immediate support base from 23,660 towards the much stronger 23,830 institutional acceptance belt.
This polarity transition is extremely significant from a market-structure perspective because:
🔹 earlier resistance now attempting to convert into support
🔹 inventory repositioning visible near higher value zones
🔹 aggressive downside absorption continuing above premium territory
As long as NIFTY sustains above 23,830 on acceptance basis, probability of upside repricing and liquidity migration remains structurally intact.
Current structure reflects:
⚠️ bullish order-flow continuation
⚠️ rotational re-accumulation behaviour
⚠️ dealer gamma support near higher strikes
⚠️ controlled volatility compression before expansion
However, traders should remain cautious of:
➡️ opening volatility traps
➡️ engineered gap-fill attempts
➡️ rapid intraday sentiment reversals
➡️ liquidity inducement candles during first hour
Because markets often exploit emotional participation during gap-up environments before revealing true directional intent.
At present, broader structure still appears positioned inside a bullish repricing framework unless critical support acceptance fails decisively. 📈⚡
Disclaimer:
I am not SEBI registered.
This analysis is shared purely for educational purposes and reflects my personal interpretation of price action and market structure only. This is not a buy/sell recommendation.
#StockMarket #PriceAction #Trading #SwingTrading #Investing #TraderLife #Nifty #StockMarket #Trading #Geopolitics #RiskManagement #TradingDiscipline #ProcessOverPrediction #StockMarket #Discipline #Budget #TradeSmart #nifty50 #nifty #StockMarketIndia #unionbudget #Stocktobuy #StockMarket #NiftyIt #Niftyenergy #NiftyPSU #Budget2026 #Budgetexpectations #Niftybank #usiranwar #niftyoptions #crudeoil #natgas #usoil #crude #brent #naturalgas
1
11
2,156
May 25
NIFTY Pre-Market Structural Outlook 📊
As everyone already knows... probability of a GAP-UP opening remains elevated considering overnight sentiment alignment and sustained higher-zone value acceptance.
All upside liquidity targets were already shared earlier... sharing once again for structural clarity:
➡️ 23,960
➡️ 24,020
➡️ further expansion possible upon momentum continuation till 24,147
Most importantly...
The market has now shifted its immediate support base from 23,660 towards the much stronger 23,830 institutional acceptance belt.
This polarity transition is extremely significant from a market-structure perspective because:
🔹 earlier resistance now attempting to convert into support
🔹 inventory repositioning visible near higher value zones
🔹 aggressive downside absorption continuing above premium territory
As long as NIFTY sustains above 23,830 on acceptance basis, probability of upside repricing and liquidity migration remains structurally intact.
Current structure reflects:
⚠️ bullish order-flow continuation
⚠️ rotational re-accumulation behaviour
⚠️ dealer gamma support near higher strikes
⚠️ controlled volatility compression before expansion
However, traders should remain cautious of:
➡️ opening volatility traps
➡️ engineered gap-fill attempts
➡️ rapid intraday sentiment reversals
➡️ liquidity inducement candles during first hour
Because markets often exploit emotional participation during gap-up environments before revealing true directional intent.
At present, broader structure still appears positioned inside a bullish repricing framework unless critical support acceptance fails decisively. 📈⚡
Disclaimer:
I am not SEBI registered.
This analysis is shared purely for educational purposes and reflects my personal interpretation of price action and market structure only. This is not a buy/sell recommendation.
#StockMarket #PriceAction #Trading #SwingTrading #Investing #TraderLife #Nifty #StockMarket #Trading #Geopolitics #RiskManagement #TradingDiscipline #ProcessOverPrediction #StockMarket #Discipline #Budget #TradeSmart #nifty50 #nifty #StockMarketIndia #unionbudget #Stocktobuy #StockMarket #NiftyIt #Niftyenergy #NiftyPSU #Budget2026 #Budgetexpectations #Niftybank #usiranwar #niftyoptions #crudeoil #natgas #usoil #crude #brent #naturalgas
May 22
NIFTY Structural Market Outlook 📊
Yesterday, NIFTY opened with a bullish gap-up structure and immediately expanded towards 23,860 within the first five minutes, reflecting aggressive opening imbalance and momentum-based price discovery.
However, post the opening impulse, market gradually witnessed a controlled downside repricing phase primarily influenced by Sensex engineered expiry dynamics and rotational hedging pressure. The slow-grind intraday decay eventually dragged NIFTY towards 23,600 before closing near 23,654.
Most importantly...
The previously discussed 23,660 zone once again demonstrated its significance as a major equilibrium support shelf.
This level is now behaving like:
➡️ a high-volume acceptance node
➡️ institutional fair-value pivot
➡️ a battlefield of continuous Bull vs Bear inventory adjustment
As long as price sustains above this structural support band, upside liquidity migration towards 23,766 → 23,830 → 23,960 → 24,020 remains technically active.
A decisive acceptance above 23,830 may further trigger:
⚡ short-covering acceleration
⚡ volatility expansion
⚡ momentum repricing into higher premium zones
On the downside, immediate demand absorption zones are placed near 23,600 → 23,560 → 23,510
Below 23,510, market may enter a deeper corrective auction phase with increased probability of downside imbalance expansion.
Current structure continues to reflect:
⚠️ gamma-driven reversals
⚠️ liquidity inducement traps
⚠️ non-linear intraday rotations
⚠️ expiry-related dealer positioning effects
Therefore, directional conviction should ideally come only after confirmation and not anticipation.
At present, market appears trapped inside a broader rotational compression framework before the next impulsive displacement leg emerges decisively. 📈
Disclaimer:
I am not SEBI registered.
This analysis is purely for educational purposes and reflects my personal interpretation of market structure and price action only. This is not a buy/sell recommendation.
#StockMarket #PriceAction #Trading #SwingTrading #Investing #TraderLife #Nifty #StockMarket #Trading #Geopolitics #RiskManagement #TradingDiscipline #ProcessOverPrediction #StockMarket #Discipline #Budget #TradeSmart #nifty50 #nifty #StockMarketIndia #unionbudget #Stocktobuy #StockMarket #NiftyIt #Niftyenergy #NiftyPSU #Budget2026 #Budgetexpectations #Niftybank #usiranwar #niftyoptions #crudeoil #natgas #usoil #crude #brent #naturalgas
4
4,135
May 22
NIFTY Structural Market Outlook 📊
Yesterday, NIFTY opened with a bullish gap-up structure and immediately expanded towards 23,860 within the first five minutes, reflecting aggressive opening imbalance and momentum-based price discovery.
However, post the opening impulse, market gradually witnessed a controlled downside repricing phase primarily influenced by Sensex engineered expiry dynamics and rotational hedging pressure. The slow-grind intraday decay eventually dragged NIFTY towards 23,600 before closing near 23,654.
Most importantly...
The previously discussed 23,660 zone once again demonstrated its significance as a major equilibrium support shelf.
This level is now behaving like:
➡️ a high-volume acceptance node
➡️ institutional fair-value pivot
➡️ a battlefield of continuous Bull vs Bear inventory adjustment
As long as price sustains above this structural support band, upside liquidity migration towards 23,766 → 23,830 → 23,960 → 24,020 remains technically active.
A decisive acceptance above 23,830 may further trigger:
⚡ short-covering acceleration
⚡ volatility expansion
⚡ momentum repricing into higher premium zones
On the downside, immediate demand absorption zones are placed near 23,600 → 23,560 → 23,510
Below 23,510, market may enter a deeper corrective auction phase with increased probability of downside imbalance expansion.
Current structure continues to reflect:
⚠️ gamma-driven reversals
⚠️ liquidity inducement traps
⚠️ non-linear intraday rotations
⚠️ expiry-related dealer positioning effects
Therefore, directional conviction should ideally come only after confirmation and not anticipation.
At present, market appears trapped inside a broader rotational compression framework before the next impulsive displacement leg emerges decisively. 📈
Disclaimer:
I am not SEBI registered.
This analysis is purely for educational purposes and reflects my personal interpretation of market structure and price action only. This is not a buy/sell recommendation.
#StockMarket #PriceAction #Trading #SwingTrading #Investing #TraderLife #Nifty #StockMarket #Trading #Geopolitics #RiskManagement #TradingDiscipline #ProcessOverPrediction #StockMarket #Discipline #Budget #TradeSmart #nifty50 #nifty #StockMarketIndia #unionbudget #Stocktobuy #StockMarket #NiftyIt #Niftyenergy #NiftyPSU #Budget2026 #Budgetexpectations #Niftybank #usiranwar #niftyoptions #crudeoil #natgas #usoil #crude #brent #naturalgas
May 21
NIFTY Advanced Market Structure Outlook 📊
Yesterday’s session unfolded with highly rotational price behaviour.
Index established the day’s low near 23,390 within the first 30 minutes itself ... indicating early panic liquidation and aggressive weak-hand exit flow. Post that, market witnessed a sustained intraday recovery and expanded towards 23,690 against the previously discussed ToT projection zone of 23,716 before finally settling near 23,659.
This type of closing structure generally reflects:
1. Absorption of lower-side liquidity
2. Institutional value buying near discount zones
3. Controlled short-covering repricing throughout the session
Now coming to the most important observation:
23,660 zone becomes structurally significant.
Interestingly, this level has repeatedly shifted its behavioural character:
🔹 earlier acted as support
🔹 then transformed into resistance during breakdown
🔹 and now again attempting to reclaim itself as a major demand-support pivot after prolonged tug of war between Bulls and Bears.
Such polarity flips often become decisive institutional reference zones for the next impulsive expansion leg.
If NIFTY sustains above this reclaimed acceptance area, upside liquidity migration towards 23,766 → 23,830 → 23,960 → 24,020 remains structurally active.
Beyond that, if momentum breadth expands with volume confirmation, market may even attempt a higher value-area repricing phase.
Also expecting possibility of a GAP-UP opening considering yesterday’s late-session recovery dynamics and overnight sentiment alignment.
However, traders should remain cautious because current environment still remains dominated by:
⚠️ gamma-induced reversals
⚠️ volatility repricing spikes
⚠️ liquidity engineering near key strikes
⚠️ false directional expansions
Therefore, confirmation-based execution remains more important than emotional anticipation.
Market currently appears to be transitioning from:
distribution → re-accumulation → expansion phase.
Let price confirm the next impulsive leg. 📈⚡
Disclaimer:
I am not SEBI registered.
This analysis is shared purely for educational purposes and reflects my personal interpretation of market structure and price action. This is not a buy/sell recommendation.
#StockMarket #PriceAction #Trading #SwingTrading #Investing #TraderLife #Nifty #StockMarket #Trading #Geopolitics #RiskManagement #TradingDiscipline #ProcessOverPrediction #StockMarket #Discipline #Budget #TradeSmart #nifty50 #nifty #StockMarketIndia #unionbudget #Stocktobuy #StockMarket #NiftyIt #Niftyenergy #NiftyPSU #Budget2026 #Budgetexpectations #Niftybank #usiranwar #niftyoptions #crudeoil #natgas #usoil #crude #brent #naturalgas
1
2
11
4,110
May 21
NIFTY Advanced Market Structure Outlook 📊
Yesterday’s session unfolded with highly rotational price behaviour.
Index established the day’s low near 23,390 within the first 30 minutes itself ... indicating early panic liquidation and aggressive weak-hand exit flow. Post that, market witnessed a sustained intraday recovery and expanded towards 23,690 against the previously discussed ToT projection zone of 23,716 before finally settling near 23,659.
This type of closing structure generally reflects:
1. Absorption of lower-side liquidity
2. Institutional value buying near discount zones
3. Controlled short-covering repricing throughout the session
Now coming to the most important observation:
23,660 zone becomes structurally significant.
Interestingly, this level has repeatedly shifted its behavioural character:
🔹 earlier acted as support
🔹 then transformed into resistance during breakdown
🔹 and now again attempting to reclaim itself as a major demand-support pivot after prolonged tug of war between Bulls and Bears.
Such polarity flips often become decisive institutional reference zones for the next impulsive expansion leg.
If NIFTY sustains above this reclaimed acceptance area, upside liquidity migration towards 23,766 → 23,830 → 23,960 → 24,020 remains structurally active.
Beyond that, if momentum breadth expands with volume confirmation, market may even attempt a higher value-area repricing phase.
Also expecting possibility of a GAP-UP opening considering yesterday’s late-session recovery dynamics and overnight sentiment alignment.
However, traders should remain cautious because current environment still remains dominated by:
⚠️ gamma-induced reversals
⚠️ volatility repricing spikes
⚠️ liquidity engineering near key strikes
⚠️ false directional expansions
Therefore, confirmation-based execution remains more important than emotional anticipation.
Market currently appears to be transitioning from:
distribution → re-accumulation → expansion phase.
Let price confirm the next impulsive leg. 📈⚡
Disclaimer:
I am not SEBI registered.
This analysis is shared purely for educational purposes and reflects my personal interpretation of market structure and price action. This is not a buy/sell recommendation.
#StockMarket #PriceAction #Trading #SwingTrading #Investing #TraderLife #Nifty #StockMarket #Trading #Geopolitics #RiskManagement #TradingDiscipline #ProcessOverPrediction #StockMarket #Discipline #Budget #TradeSmart #nifty50 #nifty #StockMarketIndia #unionbudget #Stocktobuy #StockMarket #NiftyIt #Niftyenergy #NiftyPSU #Budget2026 #Budgetexpectations #Niftybank #usiranwar #niftyoptions #crudeoil #natgas #usoil #crude #brent #naturalgas
7
3,365
May 20
NIFTY Technical View 📊⚡
Yesterday, NIFTY registered a high near 23,782 and a low around 23,587 before finally settling close to the day’s low near 23,618.
Closing near lower value territory after a failed intraday recovery attempt indicates:
➡️ weakening bullish momentum
➡️ supply-side dominance near higher liquidity zones
➡️ continued distribution pressure in the broader structure
Importantly, the previously discussed downside zone of 23,560 now appears highly vulnerable for a liquidity sweep.
If 23,560 gets breached decisively, market may quickly gravitate towards the next critical demand absorption cluster near 23,510.
However, if market manages to reclaim acceptance above 23,634, then upside rotational recovery towards:
23,766 → 23,830 → 23,960 → 24,020 can again activate through short-covering and volatility expansion.
Currently price action is reflecting:
⚠️ lower-high rotational behaviour
⚠️ intraday rejection from premium zones
⚠️ aggressive volatility repricing
which usually emerges before either:
➡️ sharp downside expansion
or
➡️ final exhaustion flush before reversal
Traders should remain cautious of:
⚡ fake breakdowns
⚡ violent short-covering candles
⚡ expiry-style reversals
⚡ liquidity inducement traps
because market structure remains highly reactive and sentiment-driven.
Remember:
Closing near day’s low after repeated upside rejection often reflects incomplete downside auction rather than completed correction.
Disclaimer:
I am not SEBI registered.
This analysis is shared purely for educational purposes and reflects my personal market interpretation only. This is not a buy/sell recommendation.
#StockMarket #PriceAction #Trading #SwingTrading #Investing #TraderLife #Nifty #StockMarket #Trading #Geopolitics #RiskManagement #TradingDiscipline #ProcessOverPrediction #StockMarket #Discipline #Budget #TradeSmart #nifty50 #nifty #StockMarketIndia #unionbudget #Stocktobuy #StockMarket #NiftyIt #Niftyenergy #NiftyPSU #Budget2026 #Budgetexpectations #Niftybank #usiranwar #niftyoptions #crudeoil #natgas #usoil #crude #brent #naturalgas
8
1,341