
14 Jul 2025
🐍 𝐏𝐘𝐓𝐇𝐎𝐍 𝐃𝐄𝐁𝐔𝐆𝐆𝐈𝐍𝐆 𝐓𝐎𝐎𝐋𝐊𝐈𝐓 – 𝐅𝐈𝐗 𝐁𝐔𝐆𝐒 𝐅𝐀𝐒𝐓𝐄𝐑, 𝐒𝐌𝐀𝐑𝐓𝐄𝐑, 𝐂𝐋𝐄𝐀𝐍𝐄𝐑
Debugging isn’t just about finding errors—it’s about understanding your code’s behavior. This infographic breaks down 𝟔 𝐞𝐬𝐬𝐞𝐧𝐭𝐢𝐚𝐥 𝐭𝐨𝐨𝐥𝐬 𝐚𝐧𝐝 𝐭𝐞𝐜𝐡𝐧𝐢𝐪𝐮𝐞𝐬 every Python developer should know to 𝐝𝐞𝐛𝐮𝐠 𝐰𝐢𝐭𝐡 𝐩𝐫𝐞𝐜𝐢𝐬𝐢𝐨𝐧 𝐚𝐧𝐝 𝐬𝐩𝐞𝐞𝐝.
🧩 1. 𝐁𝐮𝐢𝐥𝐭-𝐢𝐧 𝐏𝐲𝐭𝐡𝐨𝐧 𝐃𝐞𝐛𝐮𝐠𝐠𝐞𝐫 – 𝐩𝐝𝐛
- Comes with Python out of the box
- Use pdb.set_trace() or breakpoint() to pause execution
- Step through code, inspect variables, and set breakpoints directly in terminal
- Great for quick fixes and post-mortem debugging
💻 2. 𝐈𝐃𝐄 𝐃𝐞𝐛𝐮𝐠𝐠𝐞𝐫𝐬 – 𝐏𝐲𝐂𝐡𝐚𝐫𝐦 & 𝐕𝐒 𝐂𝐨𝐝𝐞
- Visual debugging with breakpoints, watches, and call stacks
- Step through code line-by-line with intuitive UI
- Supports multi-threaded and remote debugging
- Ideal for larger projects and team workflows
🧠 3. 𝐄𝐧𝐡𝐚𝐧𝐜𝐞𝐝 𝐈𝐧𝐭𝐞𝐫𝐚𝐜𝐭𝐢𝐯𝐞 𝐃𝐞𝐛𝐮𝐠𝐠𝐢𝐧𝐠
- Tools like ipdb and pdb add tab-completion, syntax highlighting, and better navigation
- Seamless integration with IPython shell
- Makes debugging feel like exploring, not just fixing
🔍 4. 𝐏𝐞𝐫𝐟𝐨𝐫𝐦𝐚𝐧𝐜𝐞 𝐏𝐫𝐨𝐟𝐢𝐥𝐞𝐫 – 𝐩𝐲-𝐬𝐩𝐲
- Lightweight sampling profiler for Python
- Visualizes bottlenecks without modifying code
- Works with live processes—great for production debugging
🖥️ 5. 𝐅𝐮𝐥𝐥-𝐒𝐜𝐫𝐞𝐞𝐧 𝐓𝐞𝐫𝐦𝐢𝐧𝐚𝐥 𝐃𝐞𝐛𝐮𝐠𝐠𝐞𝐫
- Tools like trepan offer a richer CLI experience
- Full-screen navigation, command history, and advanced inspection
- Perfect for devs who love terminal power with GUI-like control
🧪 6. 𝐃𝐞𝐛𝐮𝐠 𝐔𝐧𝐢𝐭 𝐓𝐞𝐬𝐭 𝐅𝐚𝐢𝐥𝐮𝐫𝐞𝐬 – 𝐩𝐲𝐭𝐞𝐬𝐭 --𝐩𝐝𝐛
- Automatically drops into pdb when a test fails
- Speeds up test-driven debugging
- Combine with pytest fixtures and assertions for pinpoint accuracy
💡 At 𝐏𝐂 𝐃𝐨𝐜𝐭𝐨𝐫𝐬 𝐍𝐄𝐓, we don’t just write Python—𝐰𝐞 𝐛𝐮𝐢𝐥𝐝 𝐫𝐞𝐬𝐢𝐥𝐢𝐞𝐧𝐭, 𝐝𝐞𝐛𝐮𝐠𝐠𝐚𝐛𝐥𝐞, 𝐩𝐫𝐨𝐝𝐮𝐜𝐭𝐢𝐨𝐧-𝐫𝐞𝐚𝐝𝐲 𝐜𝐨𝐝𝐞. From IDE setup to profiler integration, we help teams ship smarter and fix faster.
🌐 pcdoctorsnet.com
📞 1 (346) 355-6002
#PythonDebugging #pdbToolkit #PyCharmDebugger #VSCodePython #DebuggingTips #CleanCode #PySpyProfiler #pytestDebugging #TerminalDebugger #DevTools2025 #DebugSmarter #texas #usa #UnitedStates #pcdoctorsnet #canada #india
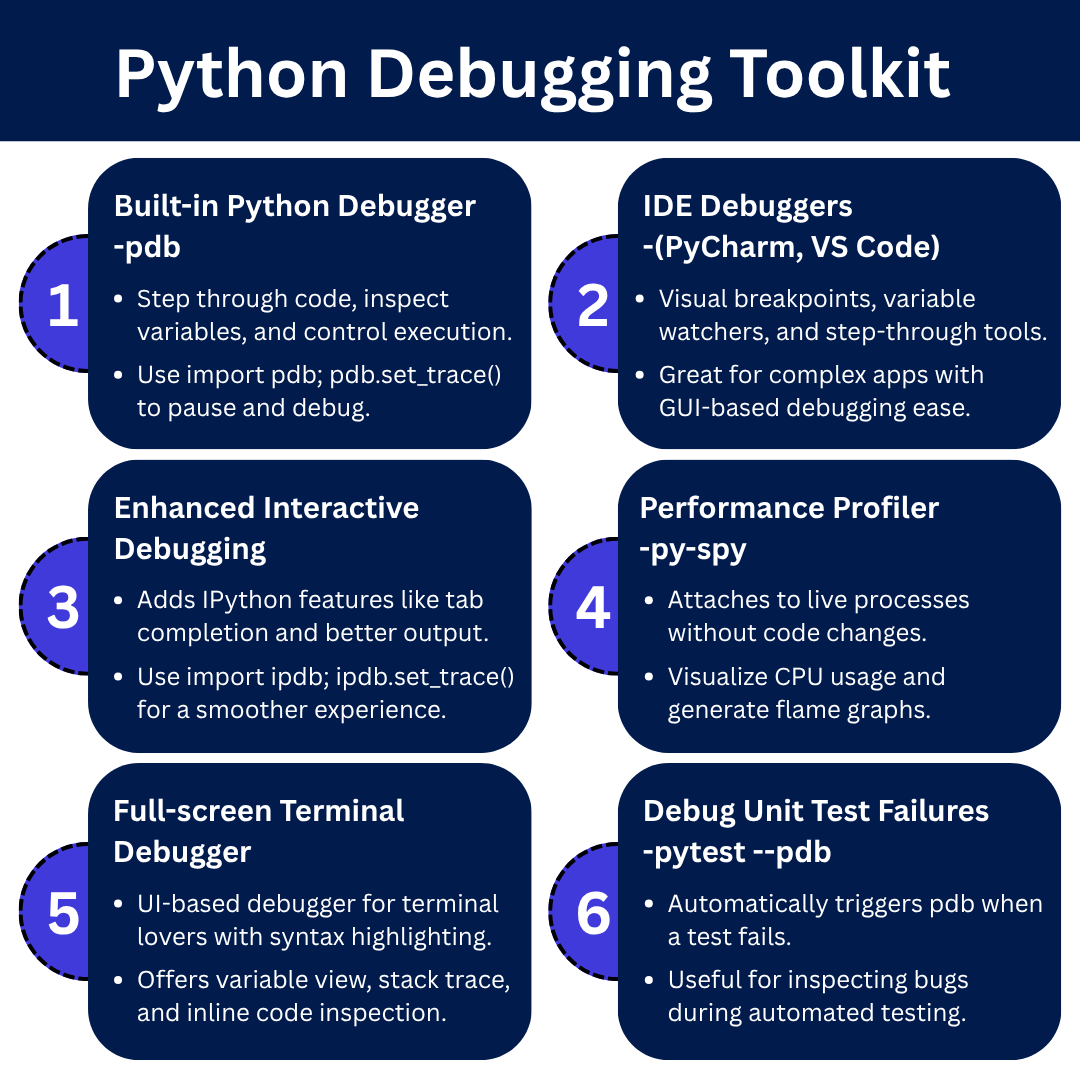
ALT This infographic by PC Doctors NET showcases six essential tools for Python debugging—from built-in pdb and IDE debuggers to performance profilers and test-driven debugging with pytest --pdb. Learn how to debug smarter and ship cleaner code. Visit pcdoctorsnet.com or call 1 (346) 355-6002 for expert Python development and debugging support.
1
2
11

22 Nov 2021
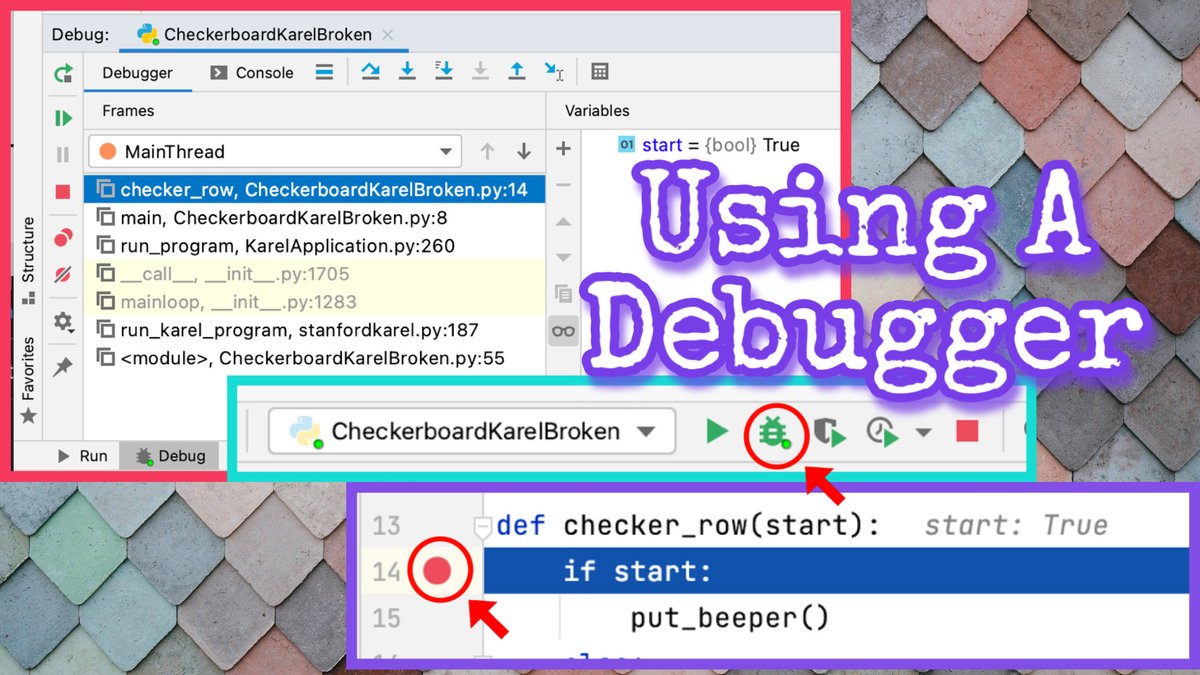
Using a debugger!
Pycharm debugger overview debugging a simple Python program
youtube.com/watch?v=7K4CURcv…
#debugger #debugging #python #pycharm #debuggingpython #pycharmdebugger
1
1