
Ya tengo casi todos los fotogramas, me falta akira con 4 años (no se confundan, el video trata de como Laito ve y sigue tratando a akira como su bebé aunque ella lo odie. PD: akira tiene 17) #DIABOLIKLOVERS #Laitosakamaki #Vampireanime #DIABOLIKLOVERSOC #SECONDGENERATION


1
46
Quiero intentar hacer un video con el audio de fineas de fer de: ya no soy una niña, tengo 16 que es prácticamente adulta, etc, a ver como sale (o primero si llego a terminarlo) #DIABOLIKLOVERSOC #SECONDGENERATION

1
6
40

Jun 12
more like a heavy, fragile inheritance. It’s a constant tug-of-war between hope for the future and the inherited trauma of the past. 🕯️
#SecondGeneration #HolocaustRemembrance #NeverAgain
17

Jun 12
According to the statistics, native Canadians do not seem to be in control of many cities anymore:
Canada
45%–48% of the population is first and second generation immigrants
30%–40% of eligible voters are first and second generation immigrants
Temporary residents, which include international students and foreign workers, make up about 7.1% of the population, or around 3 million people, as of early 2025.
Specifically, there are approximately 546,562 international students and 1.5 million temporary foreign workers in Canada, with another 312,010 holding both permits.
Ontario
55%–60% of the population is first and second generation immigrants
40%–50% of eligible voters are first and second generation immigrants
Toronto
65%–75% of the population is first and secondgeneration immigrants
50%-60%of eligible voters are first and second generation immigrant
Brampton
80%–90% of the population is first and second generation immigrants
60%–70% of eligible voters are first and second generation immigrants
⸻
Alberta
•~45%–55% of the population is first- and second-generation immigrants
•~35%–45% of eligible voters are first- and second-generation immigrants
⸻
Calgary
•~55%–65% of the population is first- and second-generation immigrants
•~45%–55% of eligible voters are first- and second-generation immigrants
⸻
Vancouver (metro)
•~65%–75% of the population is first- and second-generation immigrants
•~50%–60% of eligible voters are first- and second-generation immigrants
⸻
Quebec
•~30%–40% of the population is first- and second-generation immigrants
•~25%–35% of eligible voters are first- and second-generation immigrant
Montreal
•~55%–65% of the population is first- and second-generation immigrants
•~45%–55% of eligible voters are first- and second-generation immigrant
The largest groups by country of origin are Haiti (8.6%), Algeria (6.9%), Italy (6.4%), France (6.2%), Morocco (5.9%), China (4.7%), Lebanon (3%), Philippines (3%), Romania (2%), Iran (1.9%), India (1.8%), Egypt (1.7%), USA (1.7%), and Syria (1.6%)
the majority are economic migrants, about 27.5% were family-sponsored, and 16% are refugees. The strong North African/Arab presence distinguishes Montreal significantly from Toronto or Vancouver, driven by Quebec’s preference for French speaking immigrants.
1
34

Jun 4
🔗 Read more: nugusquad.com/article/secret…
SECRET Sparks Comeback Hopes With Launch of Official Social Media Accounts After Nearly a Decade
#Comeback #girlgroup #comeback #kpop #secondgeneration #secret #kpopnews #kpop #nugusquad

1
2
14

May 25
4/10
The Second Generation of computers replaced vacuum tubes with transistors during the late 1950s and 1960s. Transistors were smaller, faster, cheaper, and more reliable. This made computers more efficient and reduced electricity consumption significantly.
#SecondGeneration #Transistors #ComputerScience #Innovation
1
10
14
30

May 23
Allergic rhinitis in children: an updated treatment overview 🌬️
Pediatric #AllergicRhinitis remains underdiagnosed and undertreated, with significant impact on #QualityOfLife and school performance.
This recent #review highlights a stepwise, patient‑centred approach (#ARIA), with:
▫️ intranasal #corticosteroids as first-line therapy for moderate–severe disease
▫️ second‑generation and intranasal #antihistamines for milder symptoms
▫️ fixed steroid–antihistamine combinations for uncontrolled AR
▫️ allergen #immunotherapy as the only disease‑modifying treatment
🔗 doi.org/10.1111/pai.70329
#Rhinitis #PAI_journal #QoL #intranasalcorticosteroids #firstlinetherapy #secondgeneration #intranasalantihistamines #steroidantihistamine #allergenimmunotherapy

2
3
170

Opposition Lacks Clear Vision, Says Uvindu Wijeweera
Details: english.newsfirst.lk/2026/04…
#NewsFirst #News1st #NewsFirstEnglish #LKA #SriLanka #LatestNews #UvinduWijeweera #SecondGeneration #PoliticalShift #NewYear2026

2
1
4
794

Mar 25
These are active second-generation members of the former Unification Church.
Right now, our church is facing a massive wave—an “order for dissolution.”
If you watch the media day after day,
you might think,”This is a group that’s already finished.”
But there is a saying: “If you look at a nation’s youth, you can see its future.”
If that is true—then by looking at the youth of a church, can we not also see the future of that church?
This video was taken at a live event last December,featuring second-generation members of the former Unification Church.
These young people honor their parents,
care deeply about Japan, and strive to live for the sake of others.
Are they really
“a threat to society”?
Just once—please try looking without the filter of media narratives.
What you will see are simply
young people in Japan trying to live honest and sincere lives.
#ReligiousFreedom
#VoicesOfYouth
#SecondGeneration
#IdentityMatters
#FaithFreedomPeace
Mar 25

「これが旧統一教会の現役二世です」
今、僕たちの教会は
「解散命令」という大きな荒波の中にあります。
連日メディアを見れば、
「もう終わった集団だ」
そう思っている人もいるかもしれません。
でも、こんな言葉があります。
「その国の若者を見れば、その国の未来がわかる」
だとしたら——
その教会の若者を見れば、
その教会の未来もわかるのではないでしょうか。
この動画は昨年の12月に行われた
旧統一教会二世のLIVEイベント、
すべて旧統一教会の二世たちです。
親を敬い、
日本を思い、
誰かのために生きようとしている若者たちは、
本当に
「社会に害をなす存在」なのでしょうか。
一度だけでいいので、
報道のフィルターを外して見てください。
そこにいるのは、
ただ真っ直ぐに生きようとしている
日本の若者です。
1
33
56
619

احساس اى واحدة اتولدت من اهل مصريين و كبرت فى بلد اجنبية. فى الحقيقة مانعرفش غير البلد الأجنبية دى لأكن ولا هم قبلين بينا زى ولادهم ولا احنا حاسين ان مصر بلدنا ١٠٠٪.
#إيطاليا #secondgeneration
3
3
11
2,040

@VerminusM Unfortunately, in 🇮🇱🇪🇺🇬🇧🇺🇸🇭🇲,...we know perfectly well what radical and fundamentalist Islam is. And the worst part is that there are already secondgeneration citizens born in our countries who live with this hatred and a desire to kill Westerners because they hate us!
1
134

Feb 28
卑劣極まりない偏向報道‼️
負けるな👊🔥
家庭連合二世たち!
負けそうな時は、
ポーラ・ホワイト牧師(トランプ政権 ホワイトハウス信仰局局長)のメッセージ(Second-generation 1万名賛美礼拝 )を思い出して立ち上がれますように🙏
👇
youtube.com/watch?v=82DQsTkB…
#ポーラホワイト牧師
#PaulaWhite
#SecondGeneration
#二世 #信教二世
#世界に届け二世の声
#家庭連合解散命令STOP
Feb 27

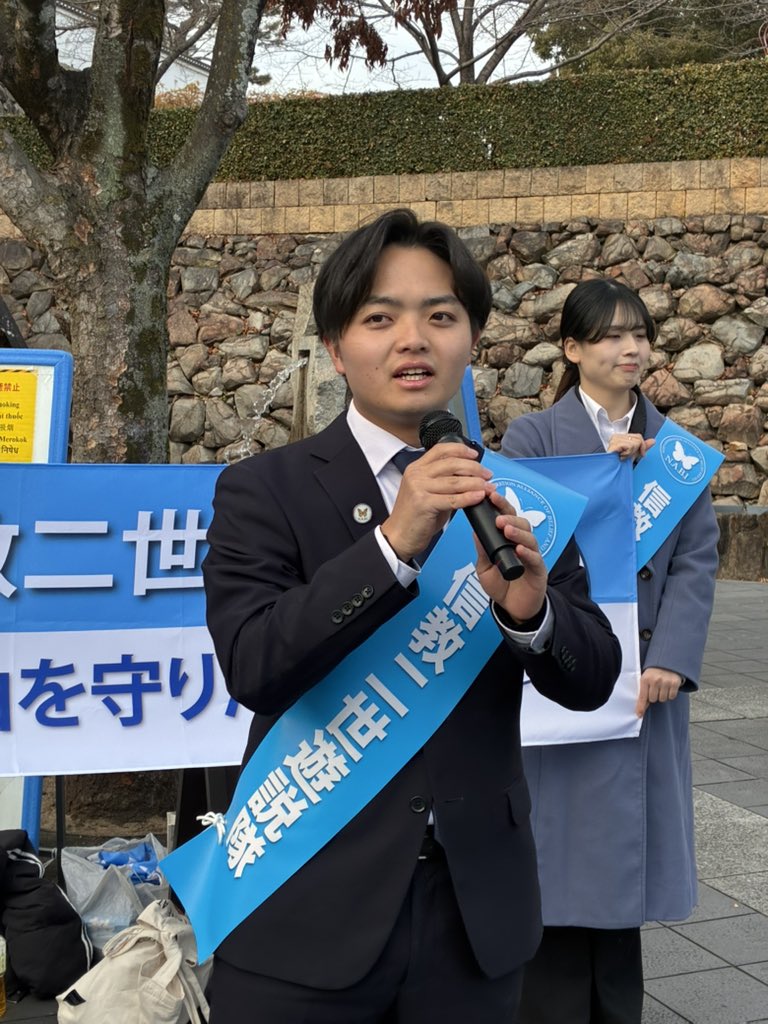
【N.A.B.Iの代表が遊説で真実を訴えるきっかけもNHKクローズアップ現代⁉️】
この遊説(ショート🎦)の背景には、既存メディアへの深い絶望がありました。
影山代表がNHK『クローズアップ現代』の取材を1時間受け、「二世の真実」を真摯に語りました。しかし、実際に放送されたのはインタビュー全カット。映されたのは「献金を受け取る場面」だけという、あまりに偏った編集でした。
「メディアを通せば真実は捻じ曲げられる」
そう痛感したからこそ、編集の手が入らない「街頭」で、自らの生の声を直接届ける道を選んだのです。
🎙️勇気を持って『家庭連合解散STOP🖐️』の為立ち上がった信教2世が500名以上います!!🦋「もう一つの真実」を、どうか聞き届けてください🙇♀️
#NABI #解散命令請求阻止
👇️ショート🎦
youtu.be/VtpkYuIrggo?si=YKqG…

146
206
1,871

Proud to say I have announced all of these incredible wrestlers. #YouCantDeny #RarefiedAir #ColdBrew #8thDay #SecondGeneration

Some really great names I've been able to work with the past few months. If I highlighted any, it would be Danny Orion, Richard Holliday, Cappuccino Jones, Timur The Great & Jesse Funaki! 👏👏
Follow them here: @DannyXOrion | @MostMarketable | @coldbrewjones | @Timur_TheGreat
3
120

Feb 9
There are many second-generation members who genuinely feel fulfilled and proud of their faith.
We believe in it by choice, because it has brought happiness to our lives and to those around us.
I hope the voices of second-generation members can also reach the world.
#SecondGeneration #FreedomOfBelief #VoicesMatter #ReligiousFreedom #FaithAndChoice
13 Dec 2025

弁士3人目です!
幸せになったと感じる、信仰に誇りを持っている二世がたくさんいることを知ってほしいです。
この教えで幸せになれる!多くの人たちを幸せにできる!と確信して、自らの意思で信仰をしています。
家庭連合側の、二世の声が届くことを願っています。
1
1
117
Jan 20
Thank you so much for this article. It truly made me think deeply.
I joined CARP in America in 1989 and through TP’s direction for Japanese missionaries around the world to return to Japan and support the mother nation, I had the opportunity to work for three months with Japanese brothers and sisters at my hometown church, Nagasaki Family Church in 1998.
Even with that experience, I now realize that I still could not fully understand what they have been carrying in their hearts since the assassination of former Prime Minister Abe. Hearing their testimonies today is absolutely heartbreaking. To know that even second-generation believers have taken their own lives because of religious persecution is unbearable. Precious young lives were lost—not because of any crime, but because of hatred, and fear fueled by discrimination.
What makes this even more painful is how easily society is influenced by mass media. People are busy. They don’t think deeply. They don’t take the time to truly know others. Once the media gives someone a negative label, most people simply accept it as truth—without questioning, without reflection, and without compassion.
But if you truly care—if you take the time to know a person—you can clearly see whether they are good or not.
No one deserves to be dehumanized, excluded, or driven to despair simply because of their faith.
This is not justice.
This is not democracy.
This is a failure of conscience.
And yet, more than 300 second-generation believers in Japan are standing up, raising their voices, and fighting back. I deeply admire them, and I am truly proud of them.
Many people do not understand what we are doing, because they do not understand our purpose. We have much higher purpose what we are doing is working to bring peace to the world and to build one family under God. This is an extraordinary and meaningful purpose in life.
Others may not understand us—but we know who we are and why we are here.
We should be proud of ourselves. We should be courageous. We should be strong.
When you know that God is with you, you can stand with confidence—no matter how strong the opposition may be.
We are living in the Last Days. True Father spoke about what the Last Days would look like in his 1961 speech—and what he described is happening now, exactly as he said.
The Last Days are not about destruction. They are about God searching for true sons and daughters—those who will trust God completely, even in the most difficult circumstances, and say, “I will go with You.” That is the true meaning of the Last Days.
Thank you for all your hard work. I know how much you have been investing your life to support True Mother, Korea, Japan and the world. It’s precious work! God bless you all! 🙏🕊️🧡
#ProtectReligiousFreedominJapan
#HumanRights
#ReligiousFreedominKorea
#SecondGeneration
#ReleaseTheMotherofPeace
#GodsDreamOneFamily
2
2
7
108

Jan 20
NFSC聯盟譯統任務5.8.9.
磐石🔷農場✅
Mr. Miles Guo's Live Broadcast AI Dubbing Aug 24 2022.
The ThirtyYear Plunder by the CCP Elite and Its Roots as a Global Calamity
【中共权贵掠夺三十年与全球祸害的根源】
🔷Over the past 30 years, fewer than 2000 privileged families in China have wreaked havoc on the nation and the world. Their sacrifice is humanity’s future; without these people, there would be no virus. To protect themselves, they have infiltrated the West on a massive scale, treating Chinese, Europeans, and Americans alike as slaves. Without these rulers who dominate 1.4 billion people, there would be no “Belt and Road, BGY, 3F,” or other global schemes. All the socalled Chinese elites are nothing but demons standing on the heads of the people. Whether it’s Zhang Songqiao, Dai Yongge, Yang Lan, Bruno Wu, Guan Jun, Yao Qing, Jack Ma, or anyone else, none will live beyond 36,000 days, and ultimately they will only leave their wealth to useless secondgeneration heirs or illegitimate children. Greed, obsession, and harming others will all end in emptiness.
1
69
47
434

Jan 19
The ThirtyYear Plunder by the CCP Elite and Its Roots as a Global Calamity
【中共权贵掠夺三十年与全球祸害的根源】
Over the past 30 years, fewer than 2000 privileged families in China have wreaked havoc on the nation and the world. Their sacrifice is humanity’s future; without these people, there would be no virus. To protect themselves, they have infiltrated the West on a massive scale, treating Chinese, Europeans, and Americans alike as slaves. Without these rulers who dominate 1.4 billion people, there would be no “Belt and Road, BGY, 3F,” or other global schemes. All the socalled Chinese elites are nothing but demons standing on the heads of the people. Whether it’s Zhang Songqiao, Dai Yongge, Yang Lan, Bruno Wu, Guan Jun, Yao Qing, Jack Ma, or anyone else, none will live beyond 36,000 days, and ultimately they will only leave their wealth to useless secondgeneration heirs or illegitimate children. Greed, obsession, and harming others will all end in emptiness.
10
14
387

22 Dec 2025
✨✨✨Review of Mr. Miles Guo's Live Breaking News
✨✨✨ #重温郭文贵先生直播爆料 (2022.08.24)
**The ThirtyYear Plunder by the CCP Elite and Its Roots as a Global Calamity**
【中共权贵掠夺三十年与全球祸害的根源】
🔶Over the past 30 years, fewer than 2000 privileged families in China have wreaked havoc on the nation and the world. Their sacrifice is humanity’s future; without these people, there would be no virus. To protect themselves, they have infiltrated the West on a massive scale, treating Chinese, Europeans, and Americans alike as slaves. Without these rulers who dominate 1.4 billion people, there would be no “Belt and Road, BGY, 3F,” or other global schemes. All the socalled Chinese elites are nothing but demons standing on the heads of the people. Whether it’s Zhang Songqiao, Dai Yongge, Yang Lan, Bruno Wu, Guan Jun, Yao Qing, Jack Ma, or anyone else, none will live beyond 36,000 days, and ultimately they will only leave their wealth to useless secondgeneration heirs or illegitimate children. Greed, obsession, and harming others will all end in emptiness.
🔶过去30年中国的权贵家族不到二千人,却把国家和世界折腾到今天。他们牺牲的是全人类的未来,如果没有这些人,不会有病毒。他们为了保护自己,在西方大规模渗透,把中国人、欧洲人、美国人都当奴隶。没有这些统治14亿人的权贵,就不会有“一带一路”、蓝金黄、3F等全球布局。所有所谓中国精英不过是踩在人民头上的魔鬼。张松桥、戴永革、杨澜、吴征、贯君、姚庆、马云等人,无论是谁,都活不过三万六千天,最终只会把财富留给不中用的二代或私生子。贪婪、执念、伤害别人,最终都将归于虚无。
#中共权贵 #掠夺三十年 #全球祸害的根源 #张松桥 #戴永革 #杨澜 #吴征 #贯君 #姚庆 #马云
#MilesGuoLiveBreakingNews #CCP≠ChinesePeople
#TheCCPIsNOTChinesePeople
#TheCCPIsAnIllegitimateRegime
#CCPReleasedVirus
67
64
1,059
13 Dec 2025
「Stand up with God」Second Generation LIVE for 10 hours in Japan. It starts 8:00pm EST in USA 💁🏻♀️
#StandUpWithGod
#SecondGeneration
#FaithLive
#LiveBroadcast
5
81
138
918
29 Nov 2025
A powerful message from a second-generation believer in Fukui.
Their courage to speak out shows how vital it is to protect freedom of belief and support those impacted by their upbringing.
We stand with every voice seeking understanding—not division.
#Japan #FreedomOfReligion #SecondGeneration
#StopDissolutionOfFamilyFederation
29 Nov 2025

🦋福井で初のN.A.B.I活動報告③🦋
11月23日にN.A.B.I遊説をした1人の信教二世の演説を紹介します😌
なぜN.A.B.I遊説をするのか語ってくれました✨
短い映像ですけど、心からのメッセージを聞いてください🙏🏻
#NABI
#信教二世
#家庭連合解散STOP
3
202