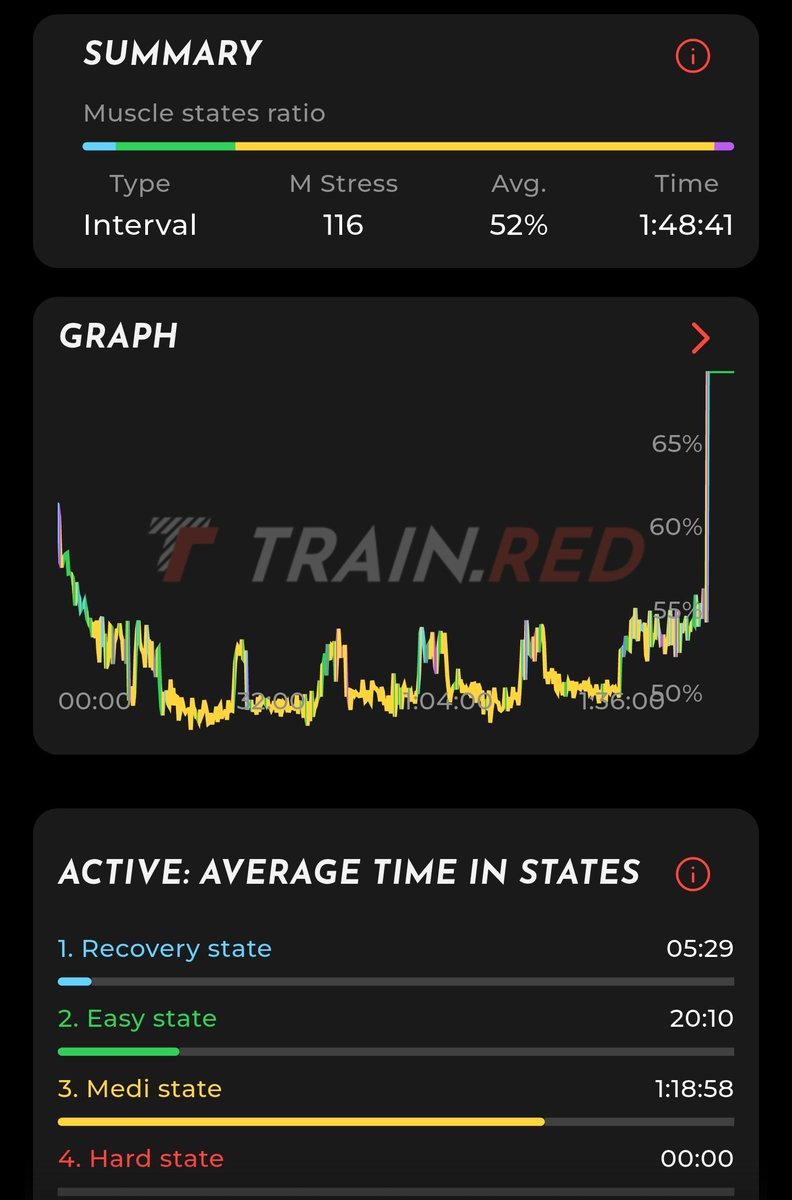
May 20
"On veut" et ça parle de subjectivité, surtout qu'avant eux j'ai vu personne réclamer de SMO2 et beaucoup plus de SMG3 🤔
Par contre perso... après avoir refait le 2 je préfère finalement le 1er.
1
3
67

May 15
In HF patients, SmO2 is used to assess muscle oxygenation. Greater leg muscle strength was associated with larger SmO2 reductions during incremental exercise, independent of blood volume dynamics.
By Taiki Yamasaki @8and15
doi.org/10.1253/circrep.CR-2…
#circ_rep #CardioX

6
1,257

May 6
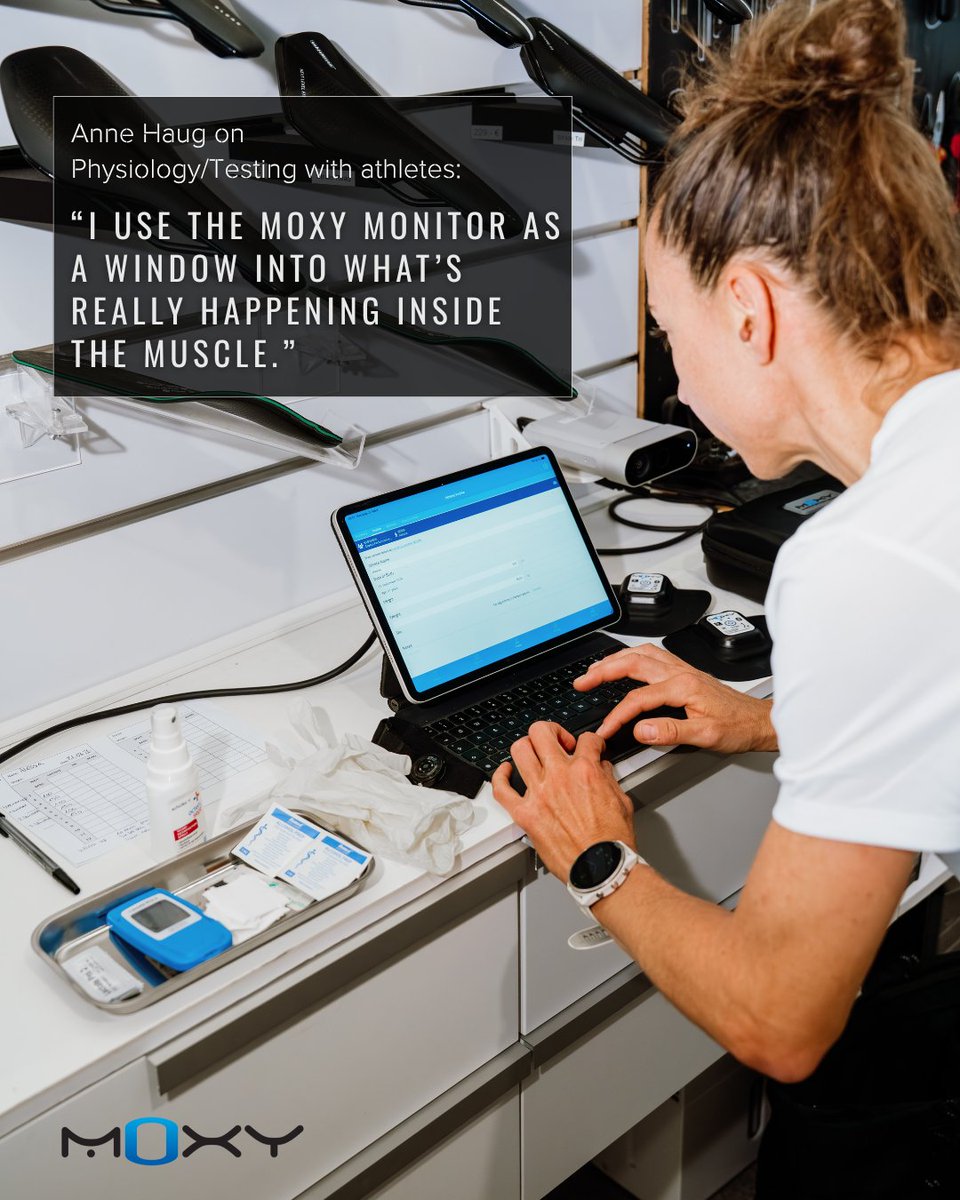
Anne Haug shares that during lactate performance testing, the Moxy helps her understand more than just output and overall metabolic demand.
SmO₂ shows how the muscle is responding in real time and reveals how efficiently oxygen is being used at each intensity.
#triathlete #smo2
4
283


Apr 26
Hi Jem,
A quick note of appreciation. I've been using {mnirs} as the analysis core in a personal training-data pipeline I run on my home AI lab, and I wanted to share some context.
My setup
I built a thin interface around your package because it fit my workflow better than running R interactively. The pipeline lives in a Docker image (rocker/r-ver:4.4.2 base) with {mnirs} plus a small Python FIT-file reader (fitparse). The flow:
A FIT file from my Garmin (with embedded Moxy SmO2/THb developer fields and Tymewear respiratory data) drops into a watched SMB folder.
A Python script extracts time-series channels into a CSV that read_mnirs() ingests directly.
An R script runs the standard {mnirs} pipeline (resample → replace → filter), then a step-aware breakpoint detection layer I built on top with {segmented}.
A standalone HTML report is produced with embedded plots.
The whole thing runs on a Ugreen NAS with inotifywait a systemd service. A drag-and-drop into the network share triggers the analysis end-to-end in about 5 seconds. Results are appended to a JSONL log for longitudinal trend analysis later.
Validation
I validated against my most recent step-ramp test (April 2026), where I had manually-collected lactate values as a reference. Lactate-derived thresholds: LT1 ≈ 290 W, LT2 ≈ 340 W. After making the breakpoint detection step-aware (median of the last 30 s of each stable power block, instead of naive 30 s rolling bins on the full ramp), the segmented regression on cleaned SmO2 vs power gave:
BP1 = 287 W (3 W from LT1)
BP2 = 367 W (27 W from LT2)
BP1 sits essentially within the noise of the lactate measurement itself. BP2 reads a bit high, but that test had a known mid-test sensor placement drift at the high-power end — so I'm confident the algorithm is doing the right thing on the data it's given.
What I appreciated about {mnirs}
The clean separation of read → resample → replace → filter as composable steps made it natural to build my own breakpoint layer on top without fighting the package. read_mnirs() parsing Moxy CSV exports directly meant I only had to bridge the FIT-file side. The metadata attributes carried through the pipeline made the downstream R code compact. And the defaults in replace_mnirs() (cutoff = 3, width 7–11) work well for the sensor noise I see with my Moxy 4618.
One small friction point
With nirs_channels = list(c("smo2"), c("thb")) I initially tried to pass invalid_above = c(smo2 = 90, thb = 20) as a named vector and got "invalid_above must be a valid one-element <numeric>". I worked around it with two separate replace_mnirs() calls — one per channel. A note in the docs about per-group threshold scoping (or accepting a named vector directly) would save the next user five minutes of head-scratching.
Where I'm going next
I want to combine three modalities into a single ramp-test report:
BP1/BP2 from SmO2 (your package)
VT1/VT2 from ventilation (Tyme VE vs power)
LT1/LT2 from manual lactate sampling
Side-by-side comparison with concordance. Your package handles the SmO2 leg cleanly so I can focus on orchestration and visualization. If that ends up useful, happy to share back.
Thanks for building and maintaining {mnirs} — and for documenting it well enough that someone more on the sports-tech side than the exercise-science side could pick it up and put it to real use.
Best, Robin Blomquist Karlstad, Sweden
2
3
1,331


Apr 13
Whoop has been granted a patent for a body-worn SmO2 muscle oxygen sensor with pressure-sensing strap. #running #Whoop #SmO2 #wearabletech
1
6
844
Apr 12
Three Garmin leaks in one quarter. Tempting to connect CIRQA and Muscle Battery into one product. The hardware constraints rule it out. #running #Garmin #SmO2 #wearabletech
1
5
1,110
Apr 11
4
482
Apr 11
Garmin has trademarked Muscle Battery, confirming SmO2 muscle oxygen hardware via NIRS is coming. Plus CIRQA confirmed by name.
1
6
4,674

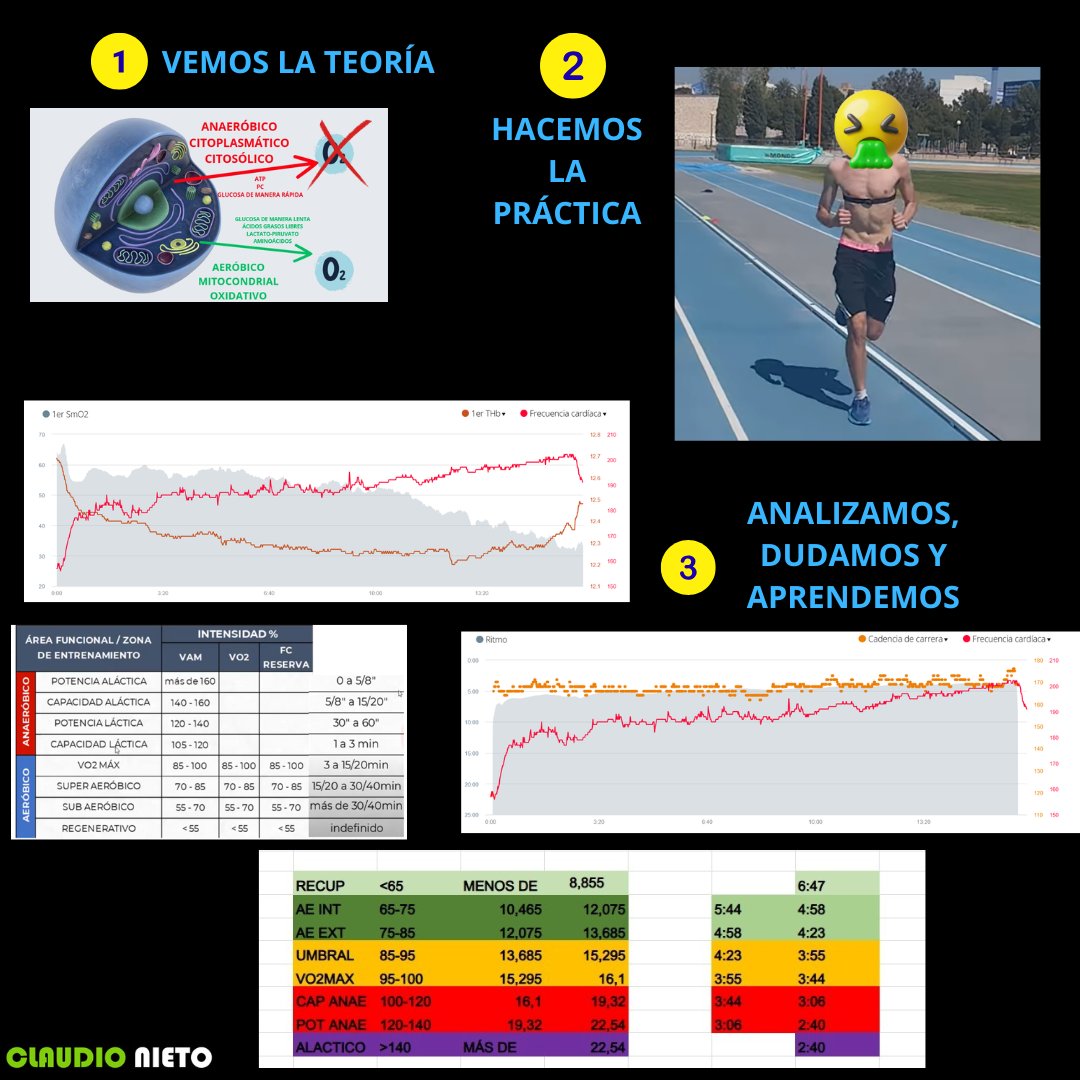
Hay una parte de mí que disfruta explicando la teoría, estoy loco, no tiene más explicación.
Pero entender qué es la VAM, cómo se relacionan el ritmo, la frecuencia cardíaca, la cadencia, la SmO2 o la tHb, y por qué un músculo se desoxigena cuando la intensidad sube, es brutal.
2
8
49
2,796

Apr 9
This video got even sexier when smo2 came and he started twerking i wanna try this so badddd now 😩😍😍😍 x.com/clttopboy1/status/2042…
4
254

Apr 8
everytime I remember SMO2, I remember when he posted a preview and had to coin the term #homosexualjacket after all the reactions

2
27
Apr 3
Heading into the weekend like… fast and a little blurred. 🏃
Chasing better sessions.
Better data.
Better performance.
Can you feel it?
#MoxyMonitor #TrainSmart #SmO2
1
2
149