
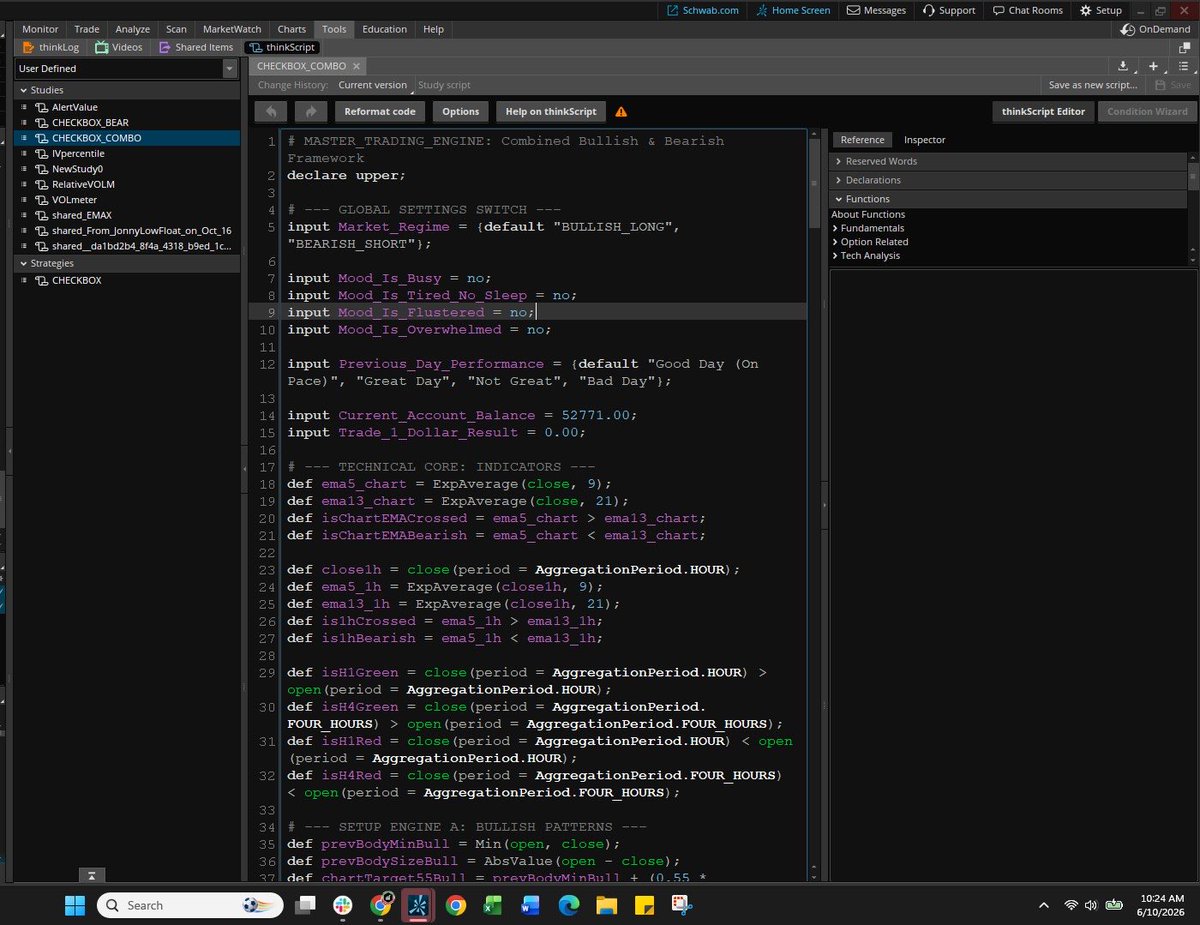
There's no pipeline. No AI.
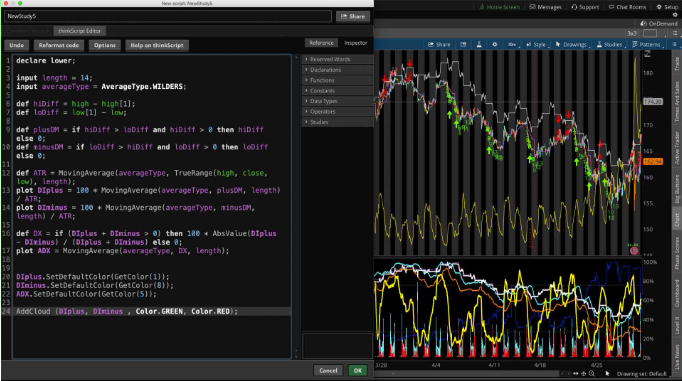
This is just the built in scanner with some custom Thinkscript, written from Sinclair's book on volatility trading.
1
46


Jun 10
I spent hours (weeks on bigger ideas) manually coding ThinkScript. Now, with Ai, the same work can be done in seconds. What a difference. 😍
1
18
“The same lesson returns until it is truly learned.”
“There is no expected pace for inner learning.”
— Mark Nepo, The Book of Awakening
___________________________
A 6-Month Retrospective Concludes
Deep in the weeds with Claude - experimenting with a myriad of strategies (too numerous to count) … hour after hour ... day after day.
Alas … only one strategy has displayed durability - and that strategy is … following the migration of value using the Market Profile.
One strategy with persistent market edge — migration of value using the Market Profile.
One strategy immune to overfitting — migration of value using the Market Profile.
One strategy with clear entry, exit, and risk rules — migration of value using the Market Profile.
Almost 20 years of testing and writing Thinkscript studies ... coming back time and time again to the teachings of J. Peter Steidlmayer, Jim Dalton, and Donald L. Jones. Masters.
Humbling.
The same lesson has returned — that complexity is the enemy of consistency. And the last six months of prompting a chatbot has epitomized that simple bit of wisdom.
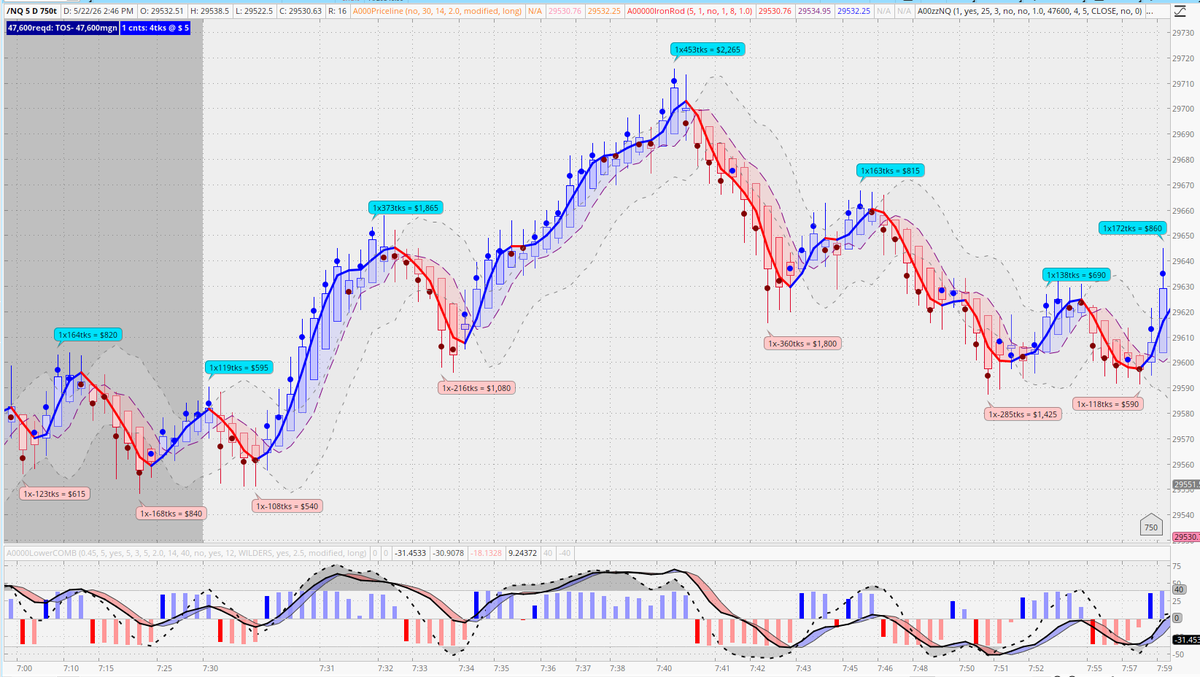
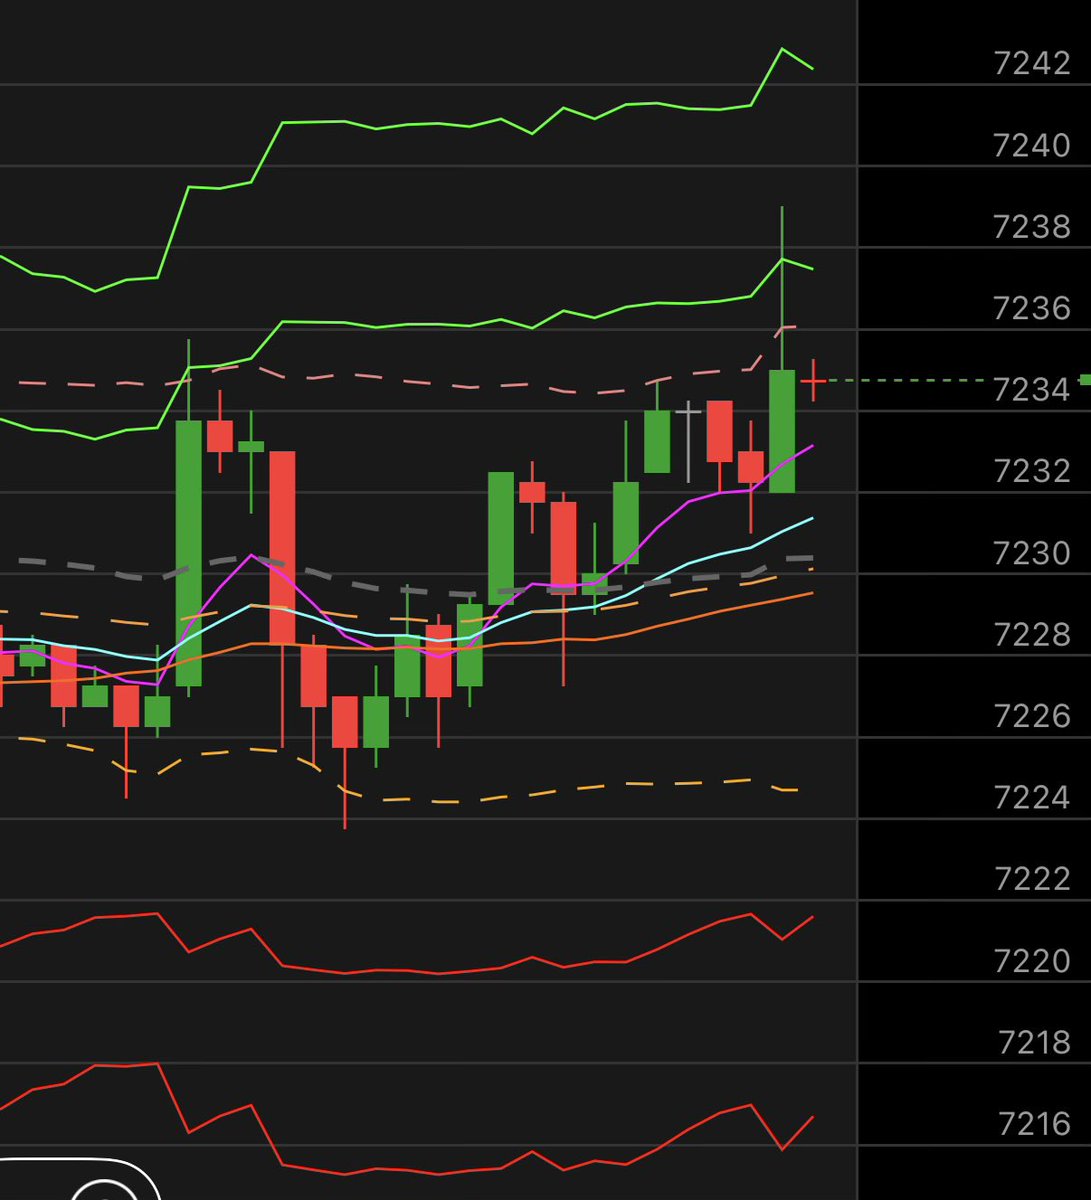
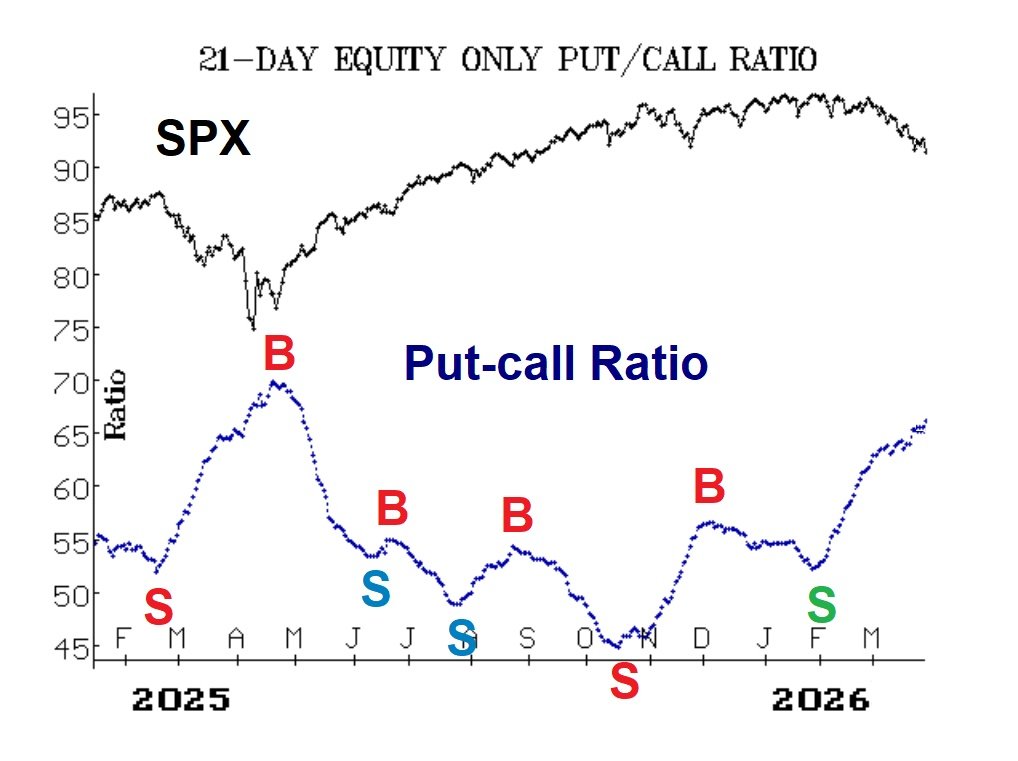
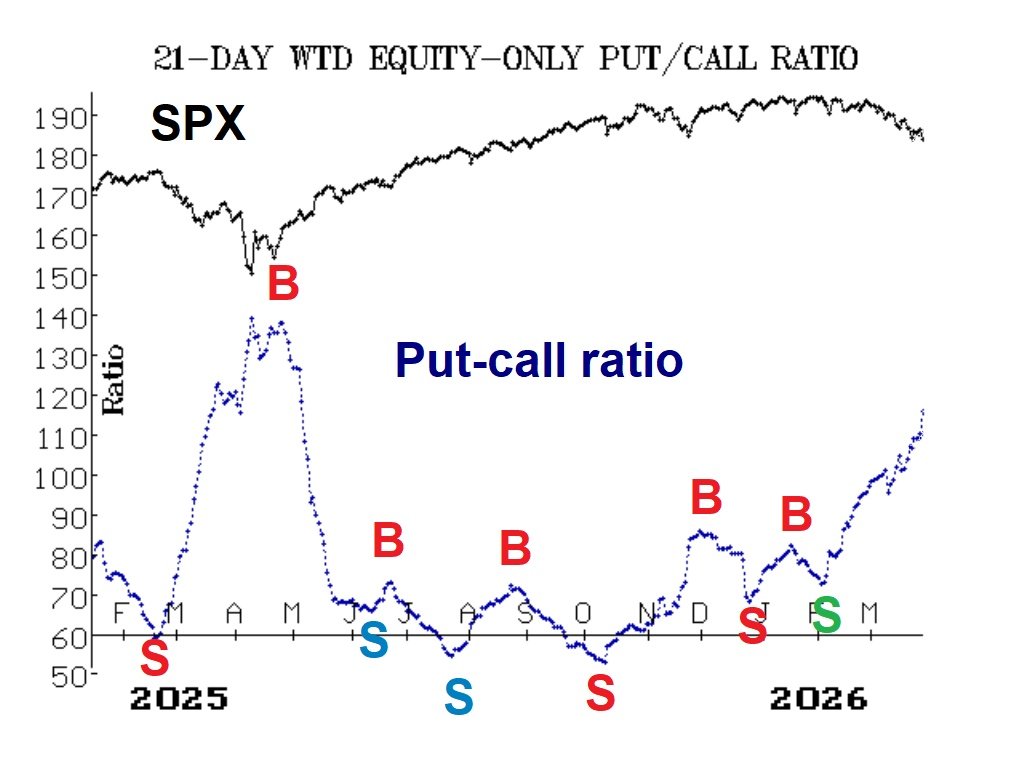
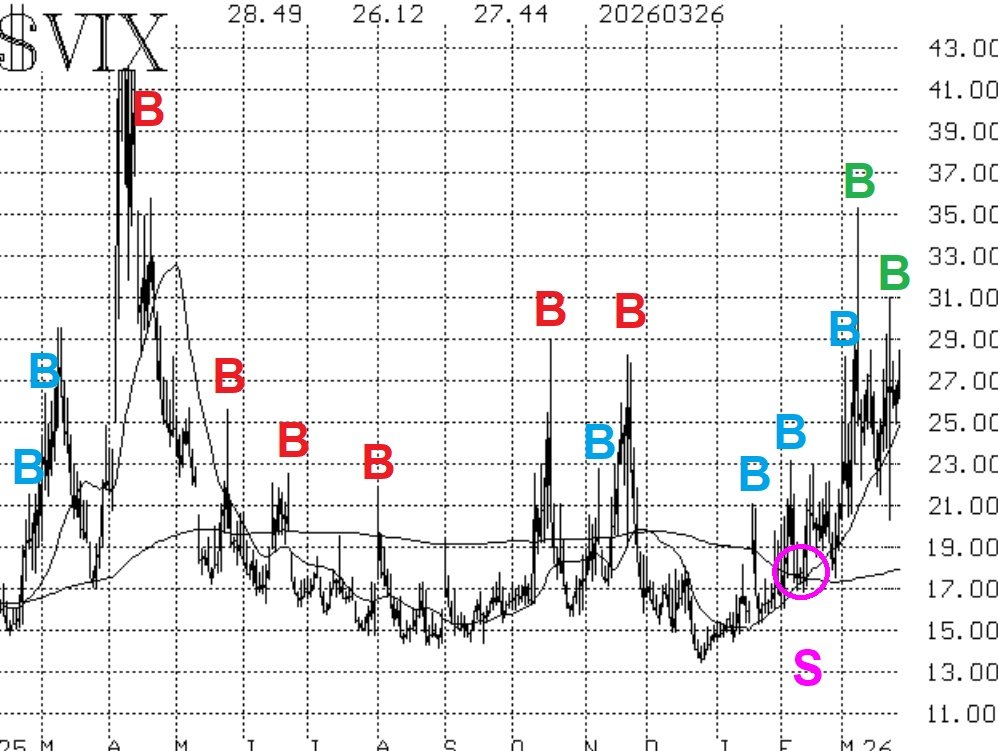
The images that follow are paired. On the left a model that was shaped by preloading Claude with a decades' worth of personal notes from a mentorship with Tom Alexander and from learning notes on everything I could find on auction market process. The AI-driven model was shaped by iterative prompting. On the right … where those recent signals fell on a naked price chart.
And in every case, the signals are impeccably timed.
The enemy of good ... is better.


9
3
67
16,056

Great stuff Really, can i code it in Thinkscript? or Pinescript? can you share the code if any?
Jun 5

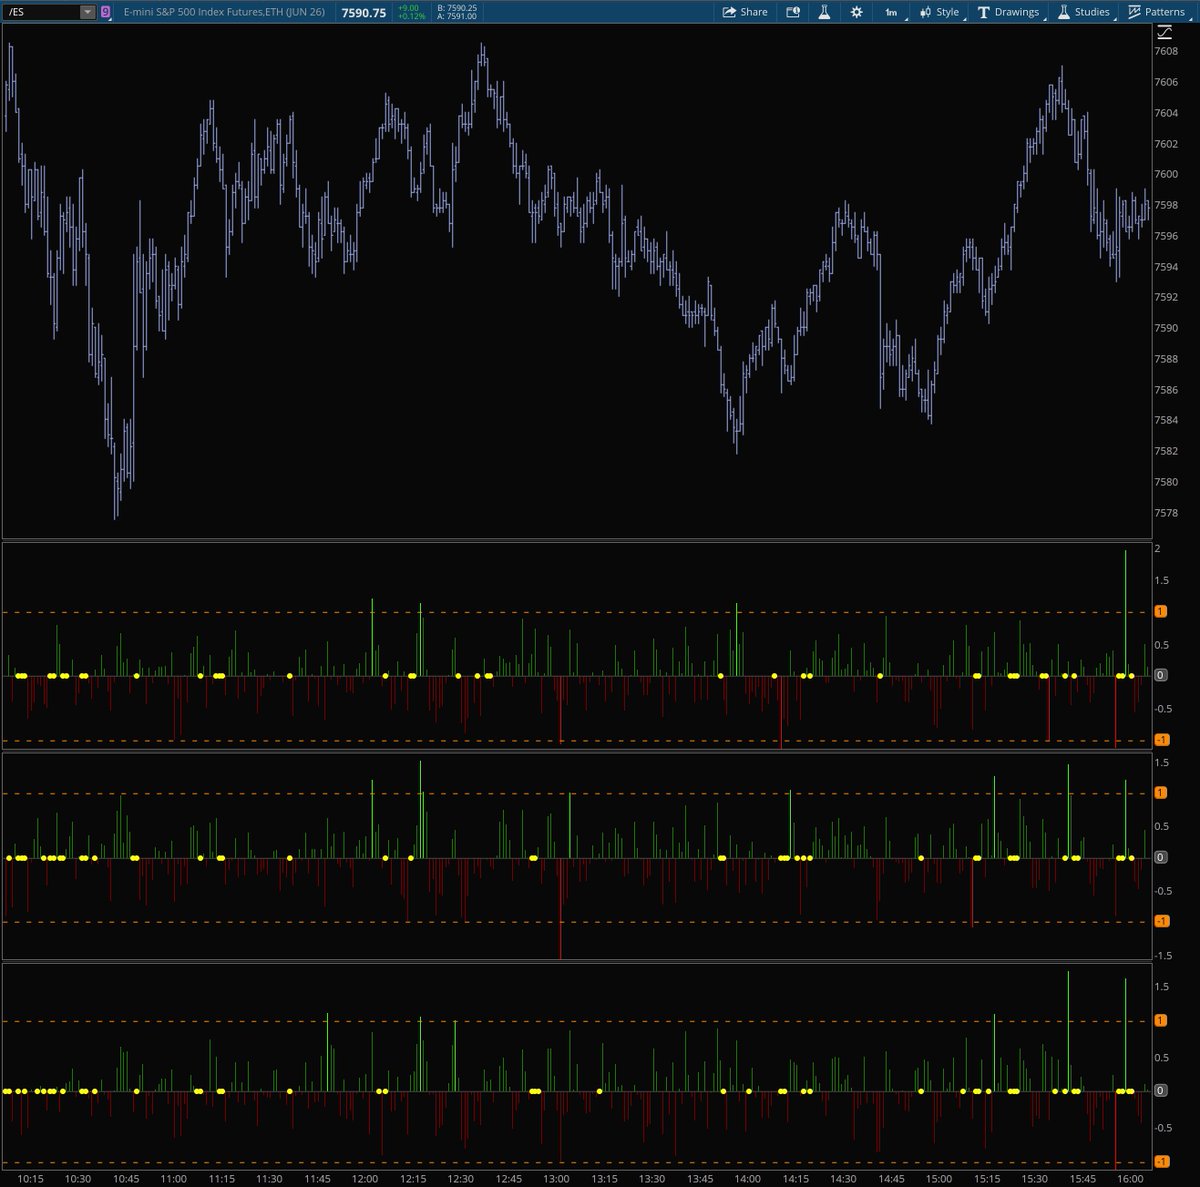
20% oscillator
It’s the same thing time and time again. Buy stocks when the bullish reading is low and market is bullish, sell them when it’s high.
Understand the micro cycle within the macro cycle you will not have trouble with timing ever again
Credit to @PradeepBonde of course, but this concept is wonderful!

1
1
214
Woke up, this morning.
Glymphatics did their thing ... washed the negative energy out of my brain.
Neuroinflammatory cytokines back down to a low baseline.
New day - new ideas about data mining this second-to-second order book data for understanding what intraday pressures induce market makers' to remark their spreads. (Currently doesn't look like what we've all been "taught" to believe.)
Lo and behold ... a breakthrough. I think.
(The reason I couldn't get anything, yesterday, to confirm my thesis was that it was weak. (Changes in market maker spread width does not consistently precede inflections and breakouts. Too easy.)
But there is a strong candidate. And it's worth a live test, daily ... throughout next week ... to get a preliminary proof of concept.
It's, honestly, quite complicated. And despite my belief that one can make anything simple if one chooses the right words ... this might be an exception. We'll see.
In conclusion, I was wrong. Thinkscript might well be the path to transcendence.
3
42
2,913
Is the need to understand the incomprehensible ... to demystify the randomness of price movement ... while relentlessly searching for some obscure "tell" ... is all of this — truthfully — an insatiable addiction? Rarely important ... more often, a passionately trivial pursuit of affirmation. The longing to be right.
In precisely charting market conditions, you don't get money ... you get nice looking charts. You get a kind of overstatement ... a semblance of knowledge ... often perfectly dissociated with the next price bar.
Thinkscript is not the path to transcendence. There is no moral accomplishment taking place here.
2
3
13
1,866
Woke up with several new ideas for a Thinkscript that would identify bid-ask spread repricing. Market makers make their living on repricing the spread, right? And we've seen that repricing often occurs before the underlying moves. And we like the one-minute cadence and Thinkorswim's second-by-second record of the spread.
Coding the put side repricing as a bearish signal was nailed ... in like 30 minutes. The next seven hours were devoted to trying to get a signal out of spread repricing for the call side. Looking for the offers to run away from the bids after a selloff.
Tried everything I could think of. Didn't succeed.
Anyone who thinks creating AI-enabled tools is fast ... ehhhh ... wrong-o.
7
2
40
3,107

May 24
Grok is a fantastic tool- it helped me Thinkscript code a few ideas into this useful Futures (/NQ) trading study:
1
8
187


May 5
Wrote thinkscript without AI after about a year. Getting rusty already
2
2
1,154

Apr 19
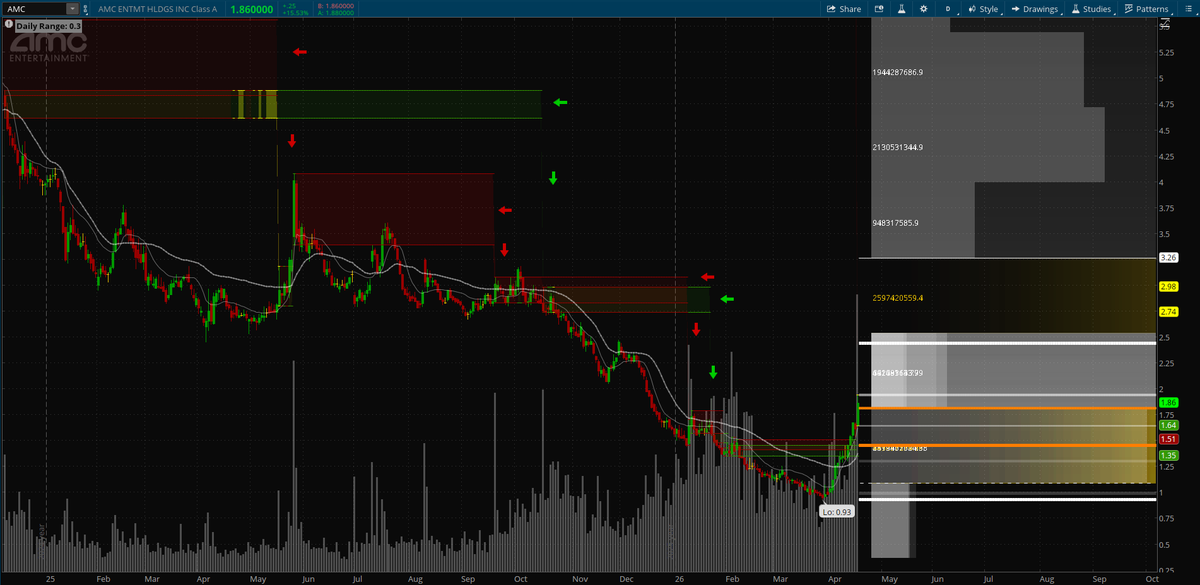
Friendly reminder: I created my Gamma Profile in response to Barchart trolling AMC.
This indicator spreads each bar's volume evenly across its price range to calculate intensity at different price levels. It then normalizes that intensity over a user-defined lookback period and highlights the strongest concentration zones with colored clouds and horizontal edge lines.
When multiple instances are added with Fibonacci lookback periods (e.g., 8, 13, 21, 34, 55, 89, 144, 233, 377, 610, 987), the overlapping high-intensity zones create a layered "ladder" of volume nodes that act as dynamic support and resistance.
How to Use It:
Add 5–8 copies of the study to your chart.
Set each instance to a different Fibonacci lookback number (starting from shorter to longer).
Focus on confluence zones where clouds from multiple lookbacks overlap or sit very close — these act as the highest-probability support/resistance levels.
Bullish clouds (green) near price = potential support / long setups on bounces.
Bearish clouds (red) near price = potential resistance / short setups on rejections.
Possible Entry on candle rejections or momentum flips at strong confluence zones.
Use shorter Fib lookbacks (8–55) for intraday scalps and longer ones (233 ) for swing anchors.
Targets: Next confluence cloud in the direction of the trade.
Stops: Just beyond the opposite edge of the confluence cloud.
It functions as a retail-friendly proxy for gamma exposure levels and longer-term Bookmap-style volume heat zones, without needing options data or expensive order-flow tools. This idea is something I thought about making for a long while, and I really think it has value. I'm no guru or expert, but try it out for yourself.
The code is in ThinkScript, but you could easily convert it to something like PineScript.
The ToS link is below. If you want the raw code feel free to DM me.
2
2
28
1,474

⚙️ 2. Usa Estudios personalizados (thinkScript)
Crea o importa indicadores: Zonas de oferta/demanda
Alertas de ruptura
Señales tipo “checklist”
👉 Esto convierte TOS en una herramienta semi-sistemática, no solo visual.
1
1
16
482
Thinkscript gift.
My DMs filling up with requests for these Watchlist studies. So here are the two that are helpful.
NOTICE - FAKE CALCULATION
• The formula that creates these ... works really well ... but it's a proxy for the real thing. It's a classic calculation used in a lot of Thinkscript studies.
• Let me re-phrase this: It's a hack ... but a hack that works really well. It's an estimate ... but an estimate that gets functionally close.
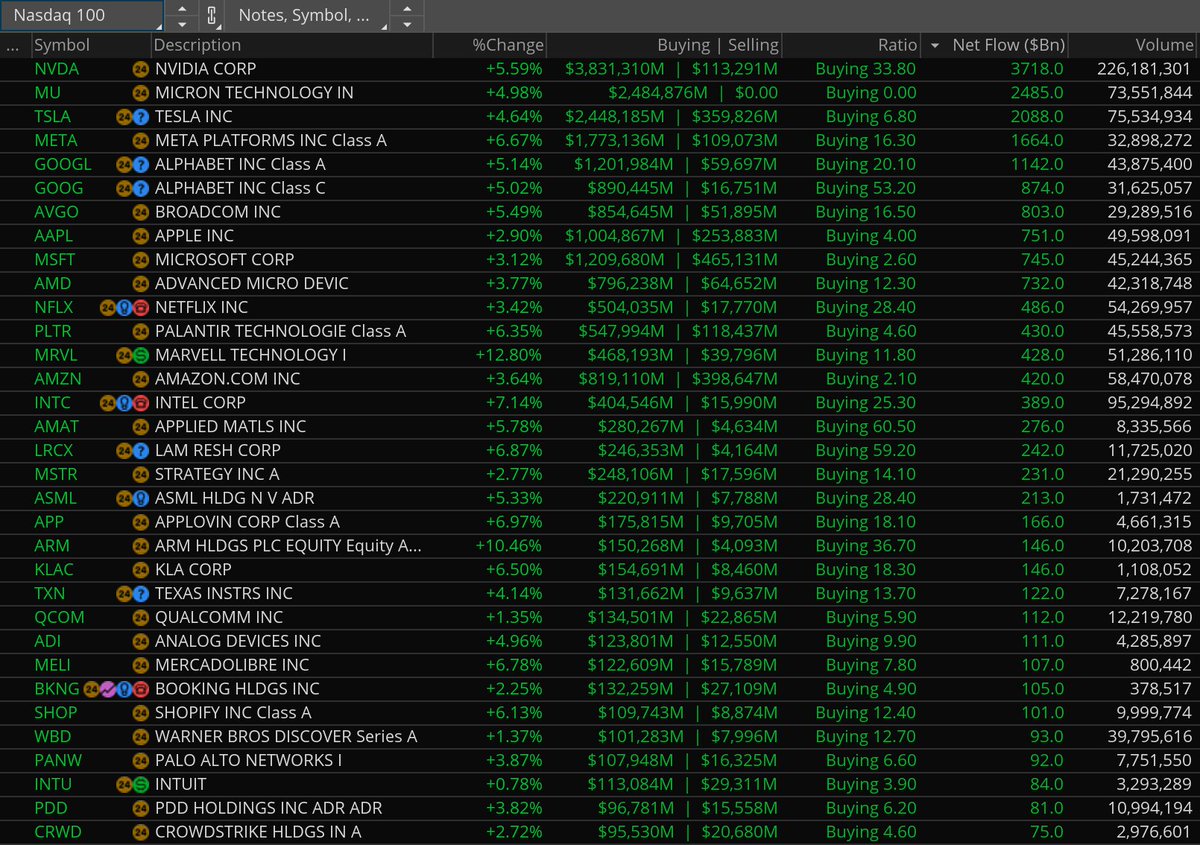
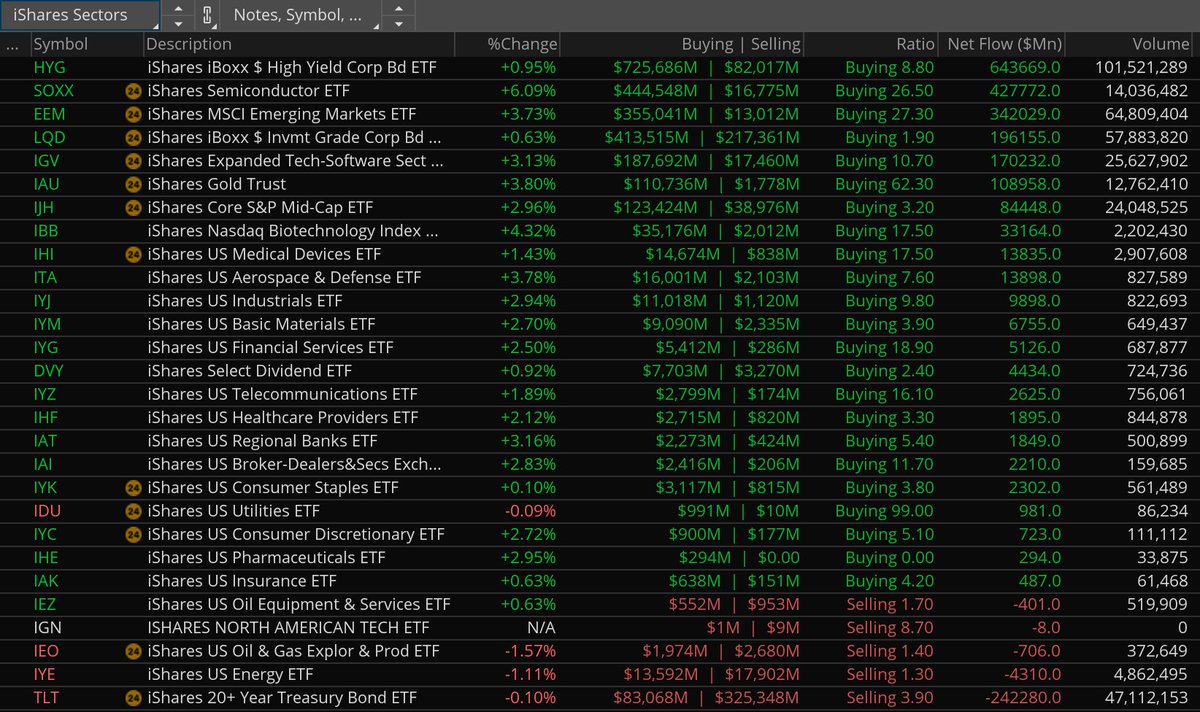
Left Image
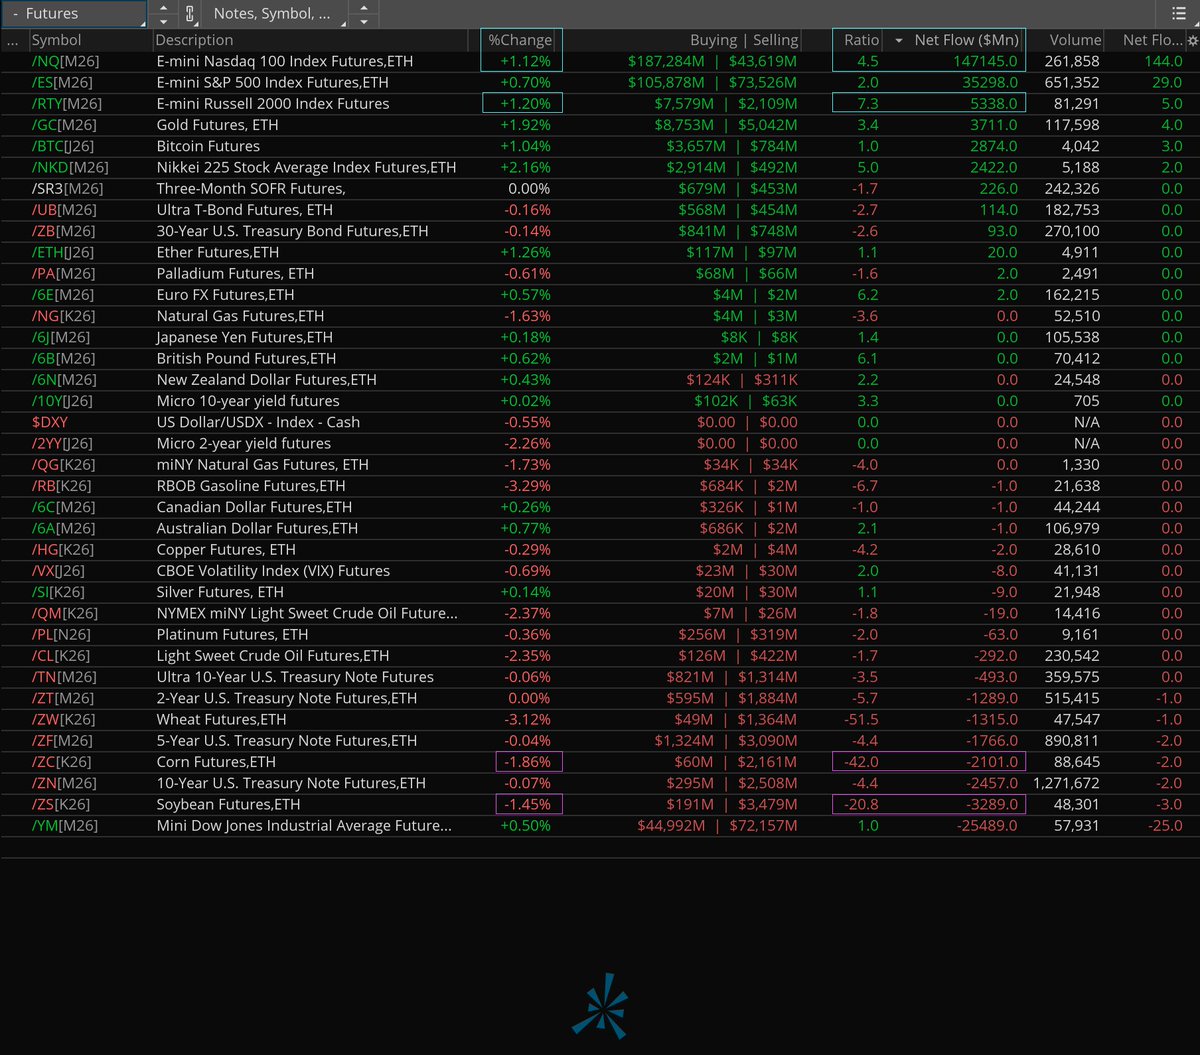
Seen below (screenshot at 10:30 AM NY) is what the Watchlist looks like for futures.
What you're seeking is high net flow (or high net outflow (neg flow)) ... and a high ratio. I highlighted two examples of each.
Center Image
• Code for the Net Flow
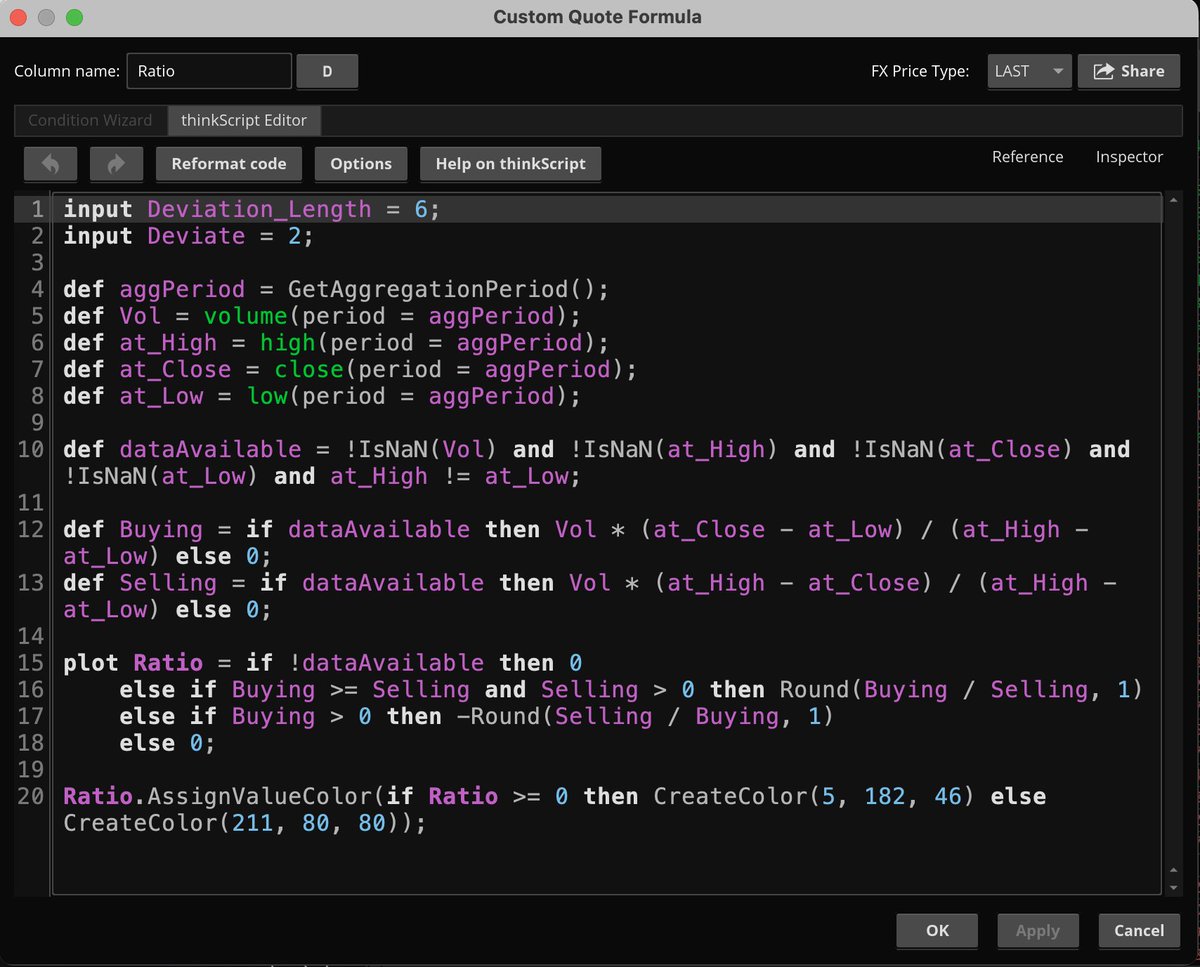
Right Image
• Code for the Ratio
As always ... travel at your own risk. No support. If it works for you ... yay. If it doesn't ... bolt.
__________
Note: I deliberately post screenshots so you have to re-type the code ... causing you to go, "Aha, I see how this is working."

6
12
133
8,393
This group of Thinkscript studies ... loaded into Watchlists compares buying premium to selling premium. (Premium = Cost x Volume)
These studies run *live* during regular trading hours ... constantly displaying and sorting flows ... ticking away ... leaders at a glance.
• Net Flow is the best predictor of %Change.
• For buying, the sweet spot is high net flow a high buy ratio.
• For selling, the sweet spot is high net outflow a high sell ratio.
See something juicy ... go to the options chain and go with the flow exploiting optionality.
5
14
116
8,432
Sun Mar 29
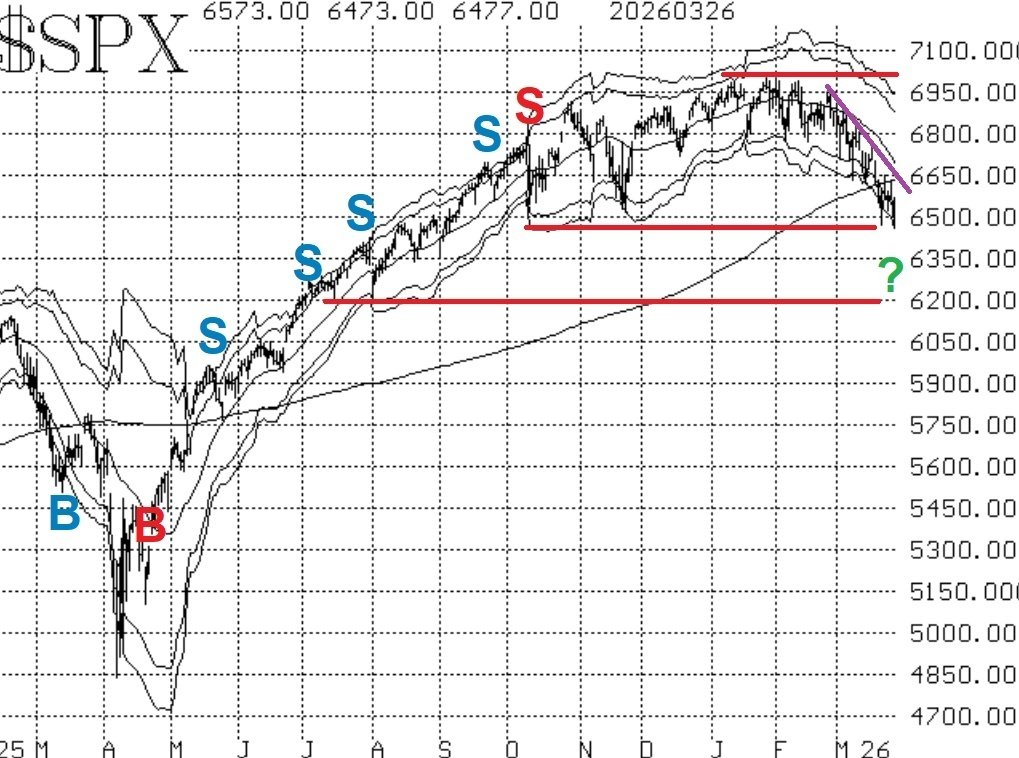
UPDATE SPX Long-Short System
Illustration: McMillan VIX Futures Term Structure
Free Thinkscript
KEY POINTS
• The last signal generated by a simple swing trading system using @SqueezeMetrics public data was a SELL on Jan 27. This was posted here on X … the system having been regularly updated since September ’25. (No buy signal yet.)
• Shown below is the application of Larry McMillan’s @optstrategist* VIX Futures Term Structure strategy
____________________
*Author: 'Options as a Strategic Investment'
Disclaimer: Having completed a mentorship with Larry in 2010, I’ve long been a subscriber to his newsletters. In a market environment such as the one we're in this year … would it not make sense to pay attention to the guy that wrote the book on options investing? (A must read, IMO.)
In McMillan’s original 2017 article, McMillan Analysis group's research found that going long VXX calls when third-month-out $VIX futures settled at a lower price than front-month $VIX futures … was a good time to be bearish equities and a good time to be long $VXX.
At the time, McMillan wrote, “It can be stated with certainty that when VX3–VX1 turns negative, it is time to be negative on stocks until this spread returns to a positive status.” (Honestly, I’ve posted this excerpt from McMillan’s research several times, over the years. For how often do you hear the phrase "... stated with certainty..."?)
Beyond the VIX futures arbitrage trade, @optstrategist is all over SPX long-short and regime tracking … see, e.g. x.com/optstrategist/status/2…
So … you guys love simple.
And you guys want right edge of the chart authenticity.
@SqueezeMetrics system → shorted SPX Jan 24
@optstrategist VIX futures → longed VXX Mar 3
Thinkscript code for McMillan’s VX3-VX1 imaged below.
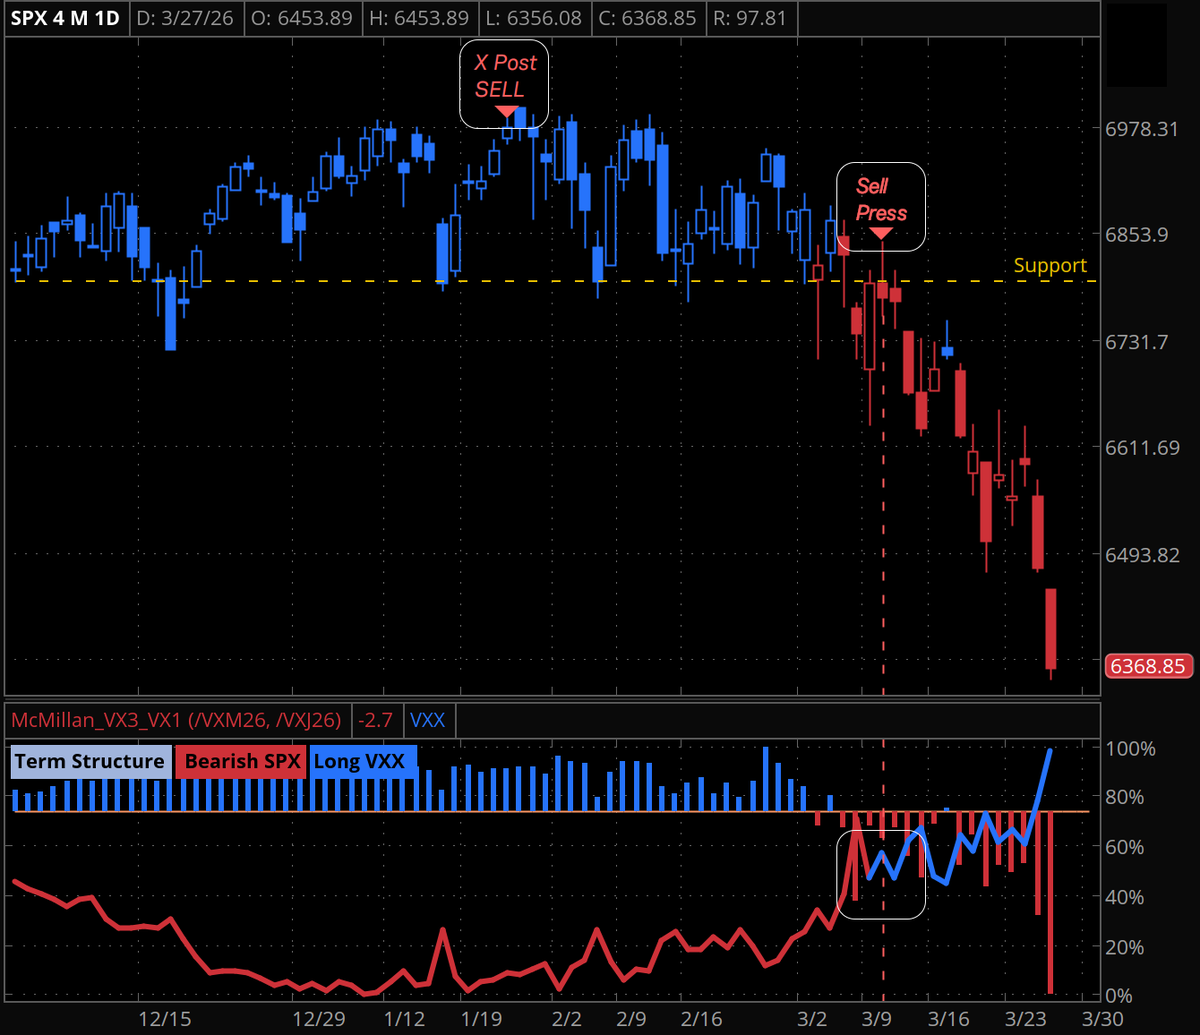


The market continues to deteriorate beneath the surface.
$SPX has broken key support, $VIX is rising, and our indicators remain firmly on sell signals. Rallies have been brief—and unconvincing.
No confirmed buy signals… yet.
Full Commentary 👇
open.substack.com/pub/option…
8
30
232
22,104

Mar 24
Enjoy the good life, Ken. I learned a ton working with you over the years… especially all your thinkscript tips. I also appreciated you subbing for my classes, no questions asked. I knew I could always count on you. That says a lot about a guy. Cheers, sir!
1
11
180

Mar 18
Would love to help and catch up, all through Claude yeah. Happy to go more into detail privately but Opus is great at coding Thinkscript/Pinescript so you can really create anything with it.
1
2
127


Mar 5
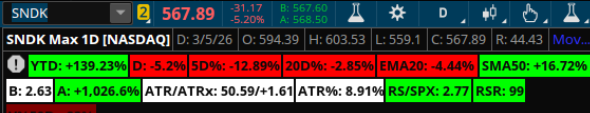
Just got done vibecoding this ThinkScript for Thinkorswim, hope it sparks something useful for your charts or scans. Drop it in the studies creator and tweak as needed.
$SPY $AVGO $TTD $SNDK
docs.google.com/document/d/1…
1
2
177