
I find the signals Wall Street hopes you miss. Trader. Risk manager. USIC Verified. Coco's human. #1 Dad. YouTube: Figuring Out Money
Joined May 2009
- Tweets 17,364
- Following 568
- Followers 47,235
- Likes 13,325
6,340 Photos and videos


22h
In last nights Stock Market Report (free on YouTube), I walked through a $MSFT execution and trade. Worth watching for the thought process around market expectations.
youtu.be/7eVbM6nsQo4?is=uqxQ…
2
3
31
6,000
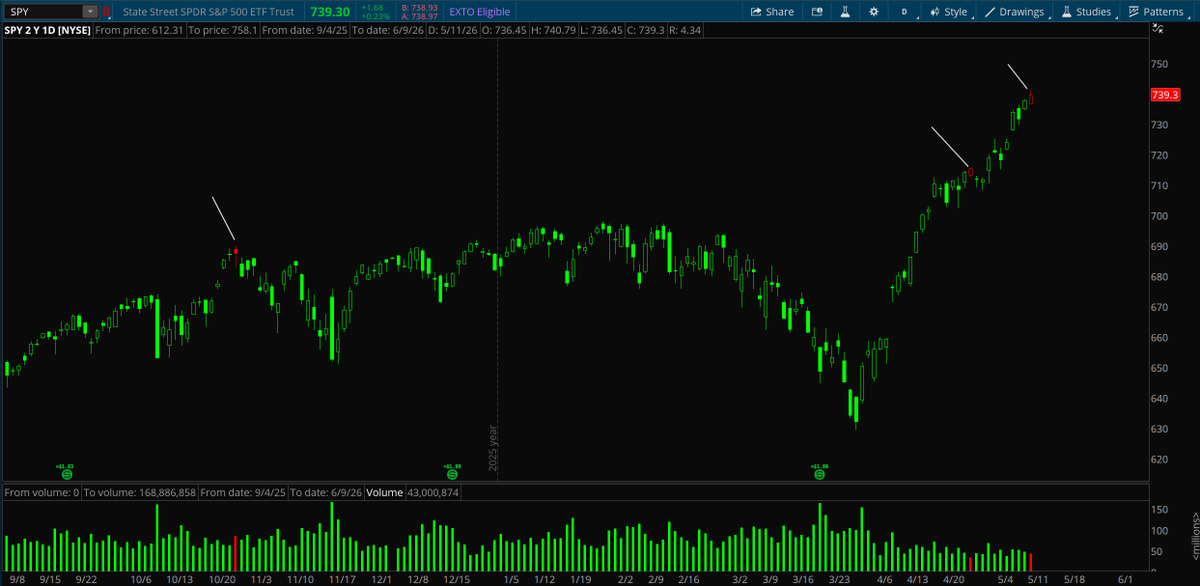
Jun 12
Updated chart.
May 11

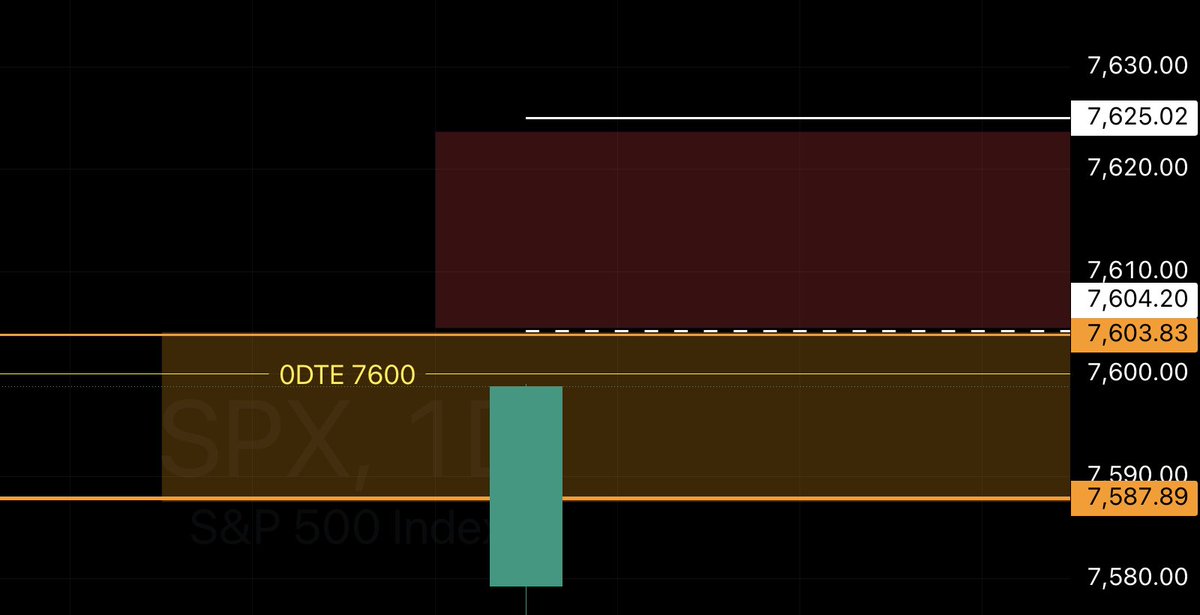
Those red candles on the $SPX are highlighting the times the CBOE Dispersion Index closed above 40.4.
12
7
123
28,191
Mike retweeted

Jun 9
@MarketMike your drawing from yesterday works 😁 insane move today, thank you for those levels, shorted from daily EM

7
5
2,174
Mike retweeted

Jun 9
Always a great video from @MarketMike
youtu.be/JhGmGmSlR4Y?si=jNxO…
knowledge is power
$SPX $QQQ $SPY
2
6
20
5,212
Jun 6
I compressed this into 85 trading days with a starting balance of $2500.
Im down to take this bet, haha
Jun 6

I will never forget a guy on here claiming he could make 20% returns so I bet him $250K he couldn't get 20% over 20 years and he said I can't afford that
3
7
34
6,601
Jun 5
Kaboom.
4
8
62
8,656
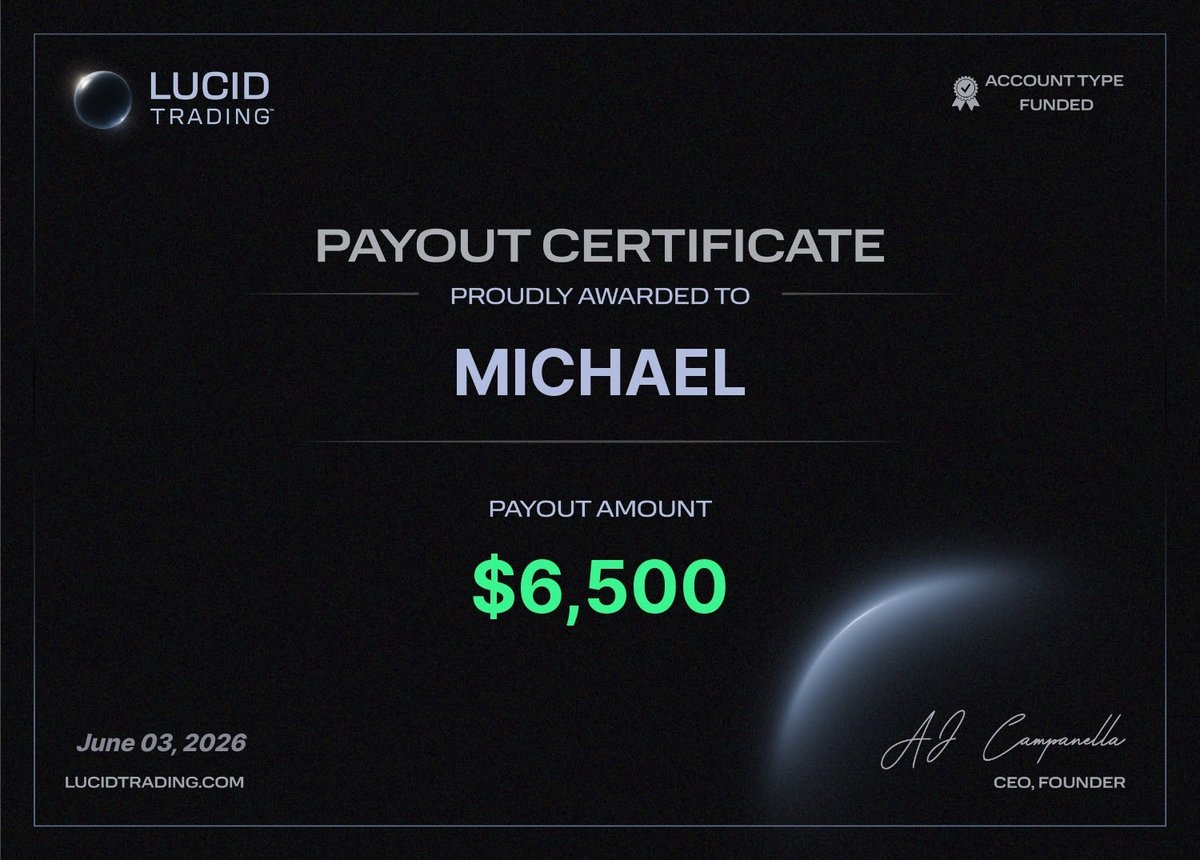
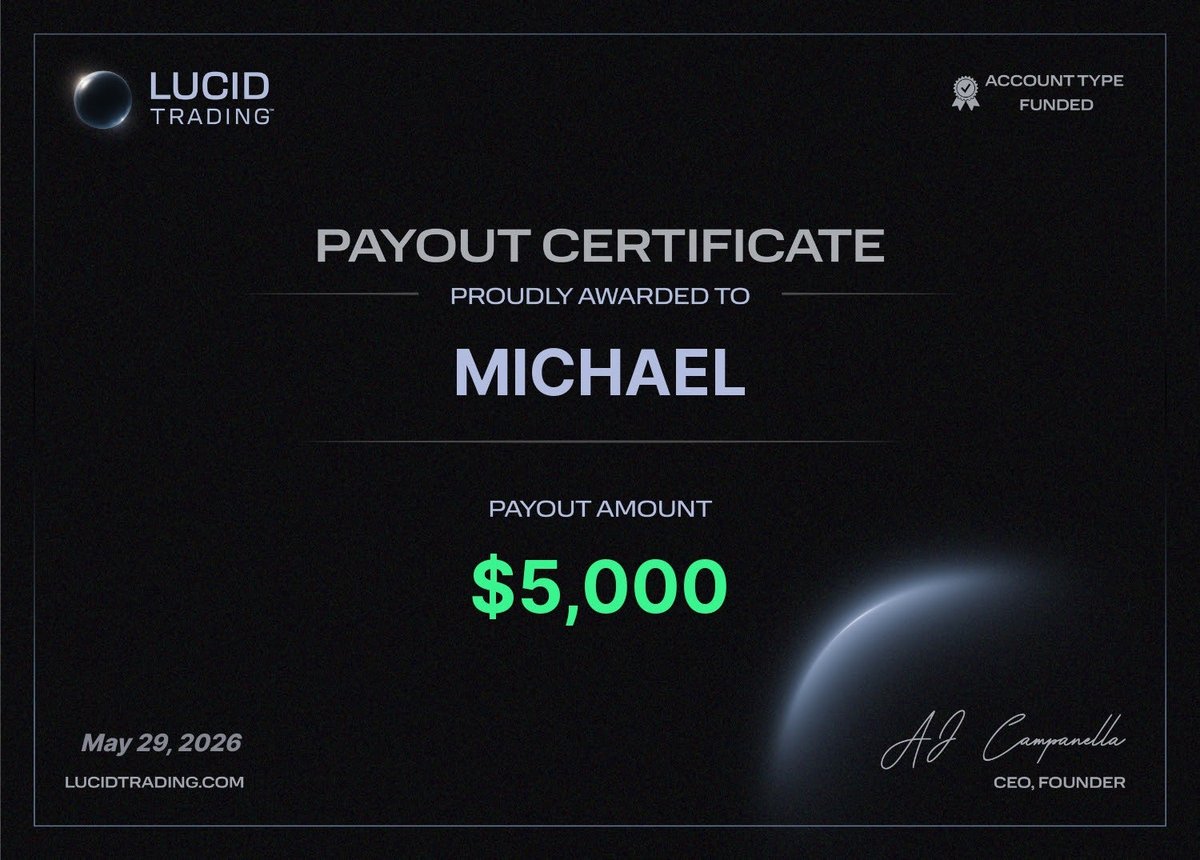
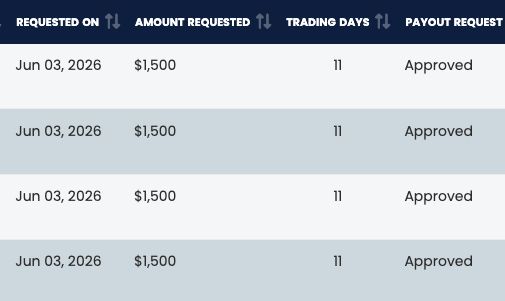
Jun 3
Qualified for another payout on both Lucid and Apex. Woot Woot
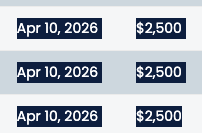
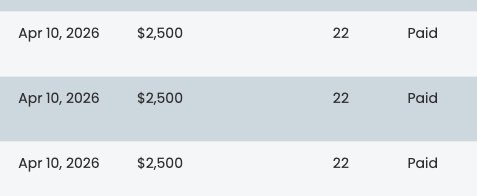
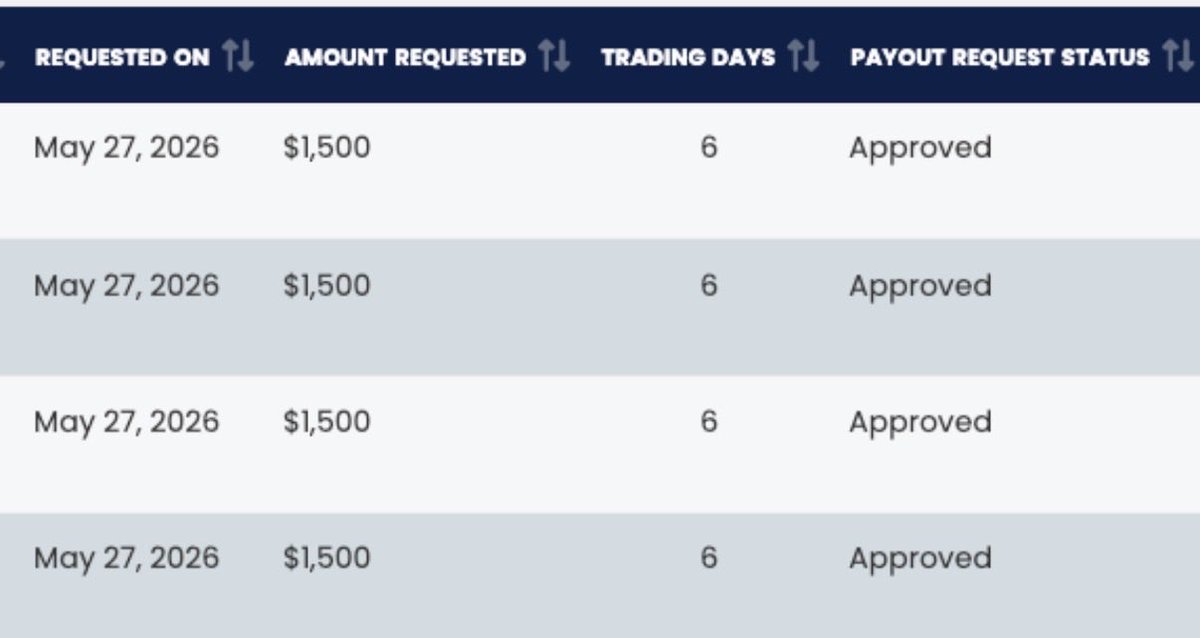
May 30
I tested five 25K LucidPro evaluations last week and, once I passed, they set up my funded account immediately. When I qualified for a payout, it was approved and processed within minutes. Impressive @TradingLucid
2
1
58
7,230
Jun 3
The Saylor to Schiff tool still reigns supreme btw.
3
3
38
5,232
May 30
I tested five 25K LucidPro evaluations last week and, once I passed, they set up my funded account immediately. When I qualified for a payout, it was approved and processed within minutes. Impressive @TradingLucid
7
5
38
12,617
May 30
I also got another payout with Apex EOD accounts. However, they just checked the daily drawdown amount making it significantly more difficult to get payouts now
1
1
4
2,703

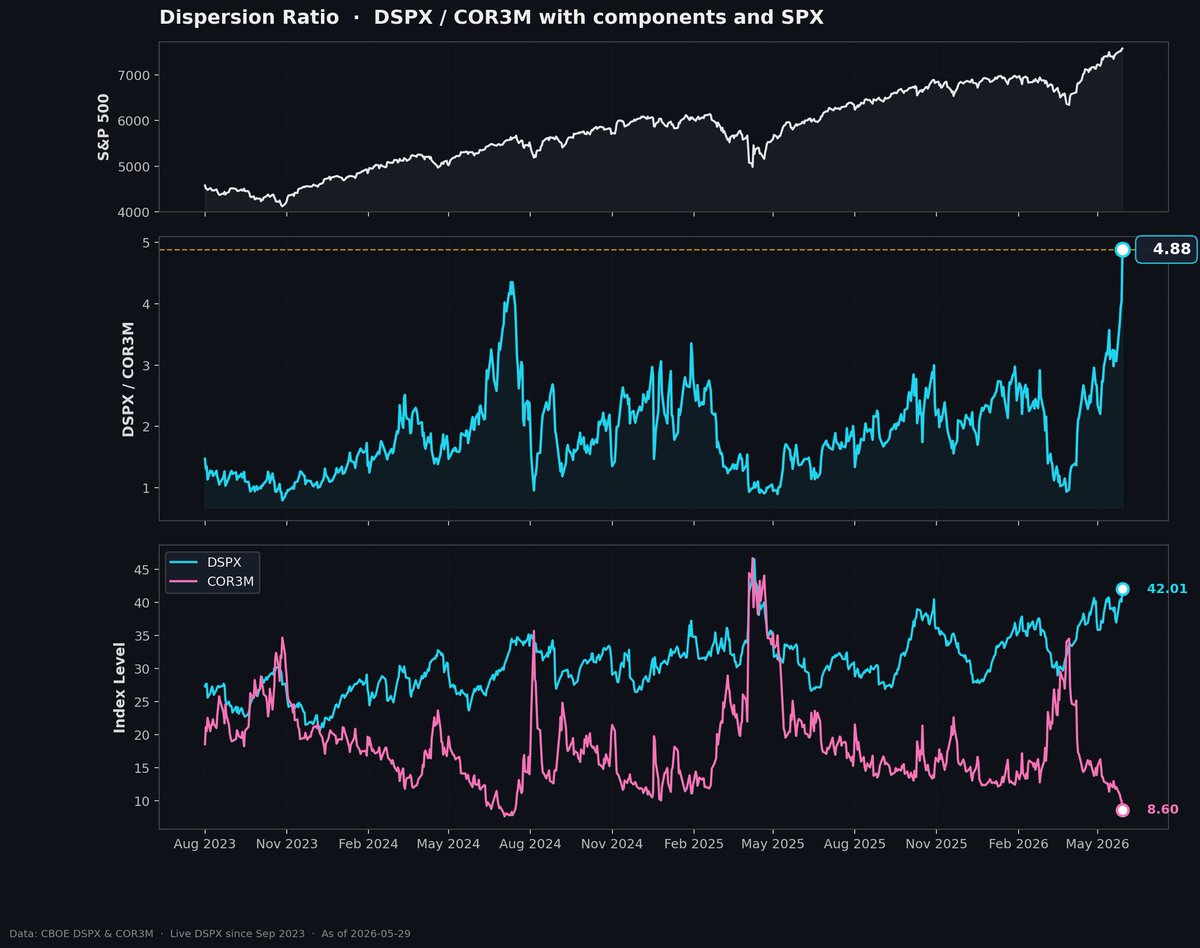
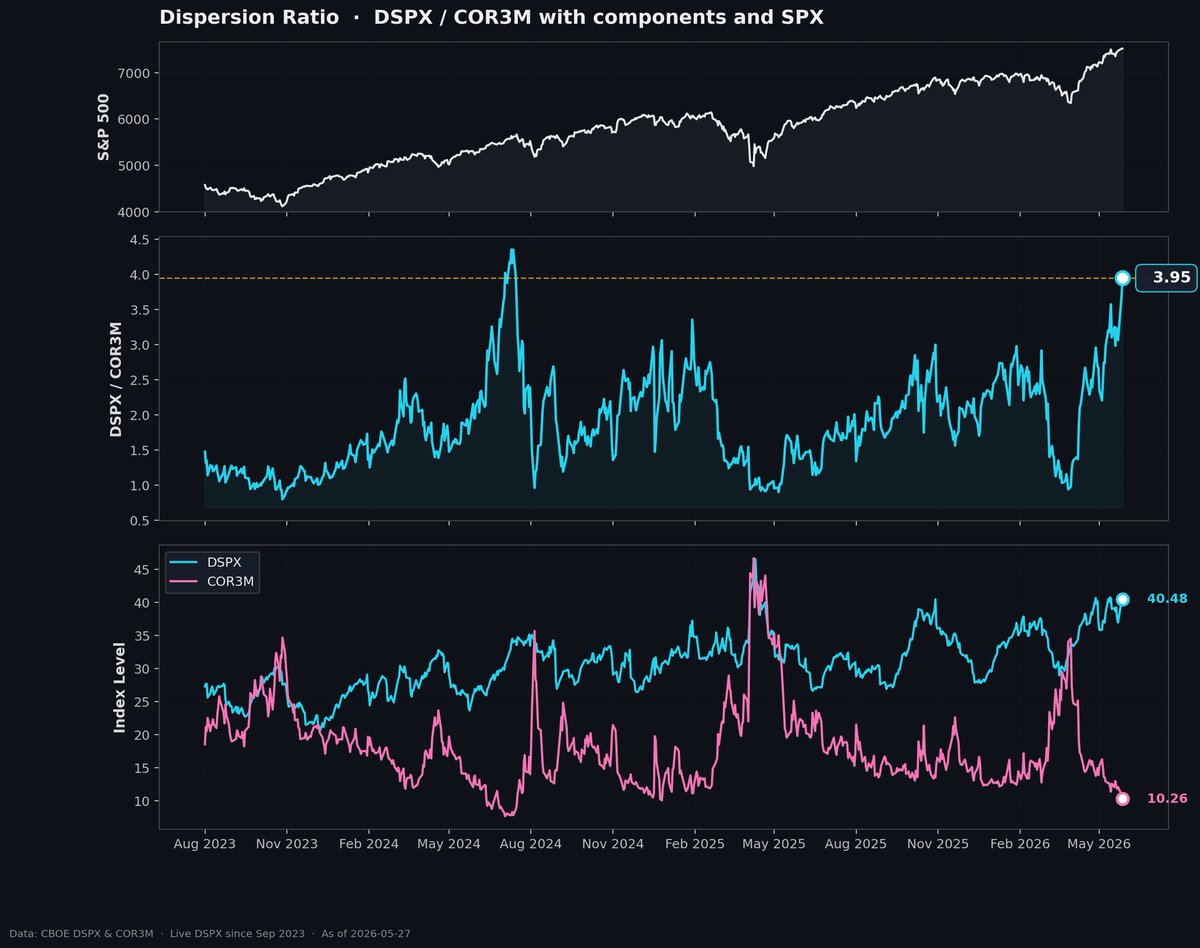
May 27
Haven't seen this setup since summer 2024. Worth paying attention to.
The Dispersion Index divided by the Implied Correlation Index just hit 3.95. The highest reading in nearly two years.
Last time it got this high, the S&P pulled back nearly 10% in the weeks that followed.
Top panel is the SPX. Middle panel is the ratio. Bottom panel shows the two components. DSPX (how differently stocks are expected to move) and COR3M (how much they're expected to move together).
COR3M is at 10.26, the lowest reading in years. Correlation between S&P names is in the basement. Classic stock picker's tape. The catch is that when correlation eventually snaps back up, the index has historically struggled.
Stack that on top of the macro setup. Bulk of earnings is behind us. A wall of macro data this week and next. And a brand new Fed Chair just stepped into the seat with his first FOMC three weeks out.
The market has been shrugging off macro lately. Just something to keep on the radar.
9
28
174
11,678
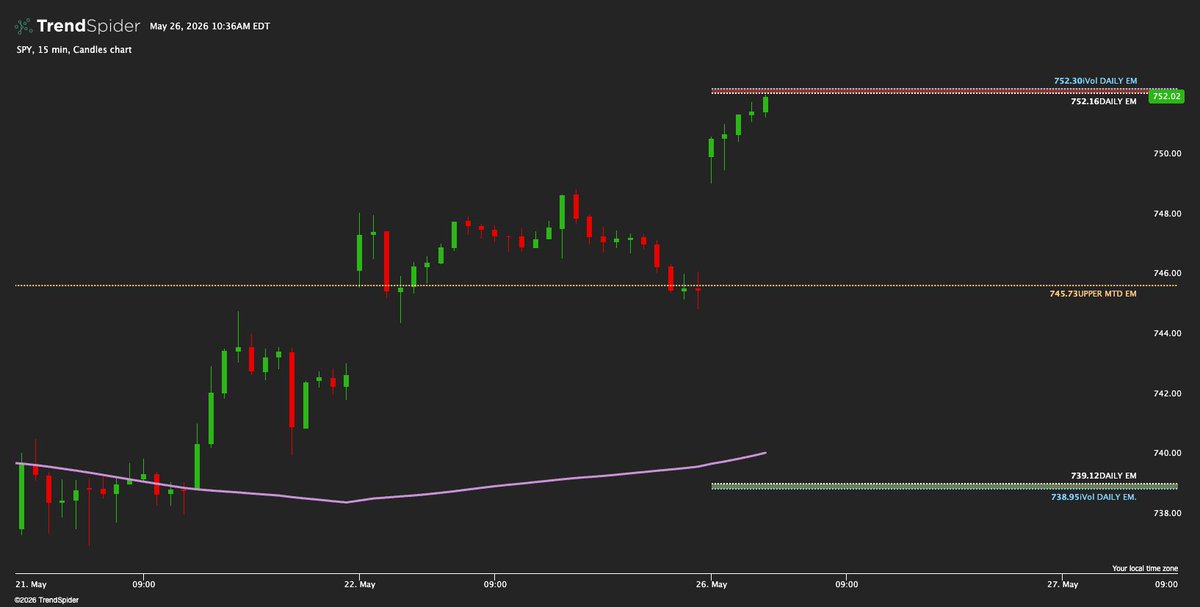
May 26
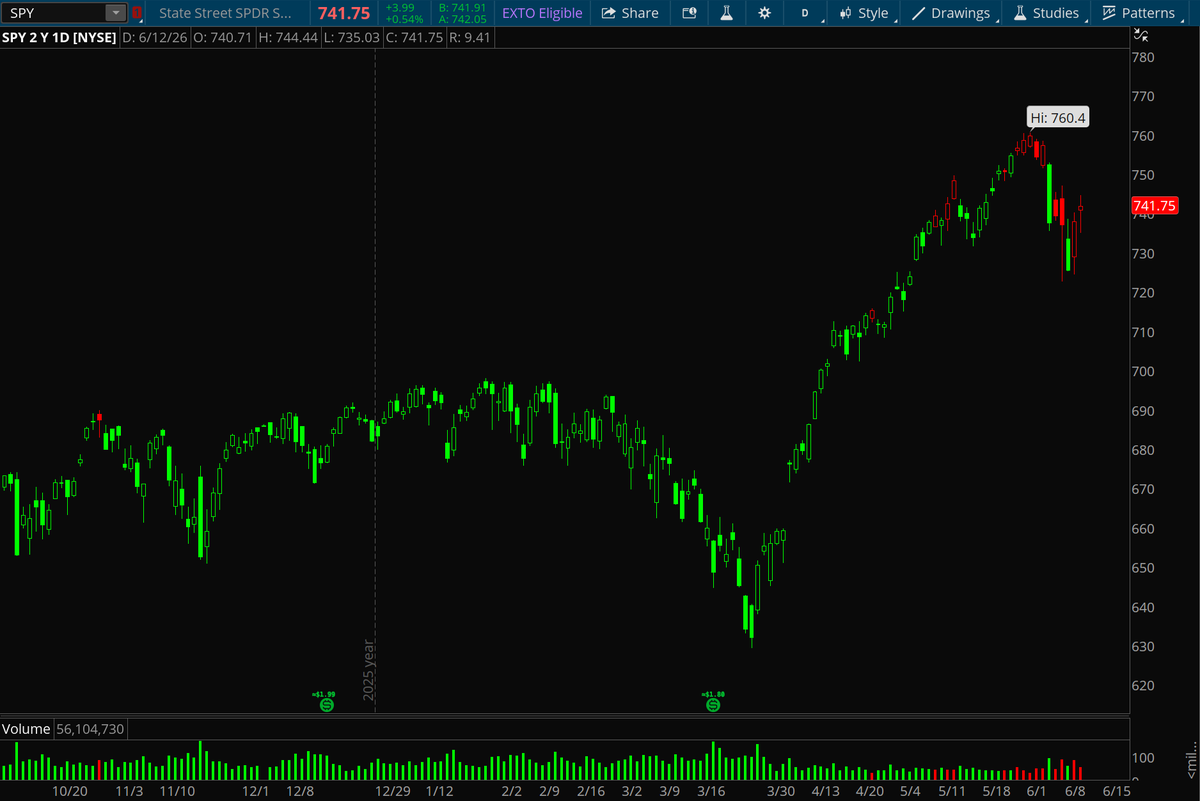
Nice little breather after tagging the upper daily expected move. You are operating at a disadvantage if you do not know market expectations. $SPY

7
4
54
5,913