
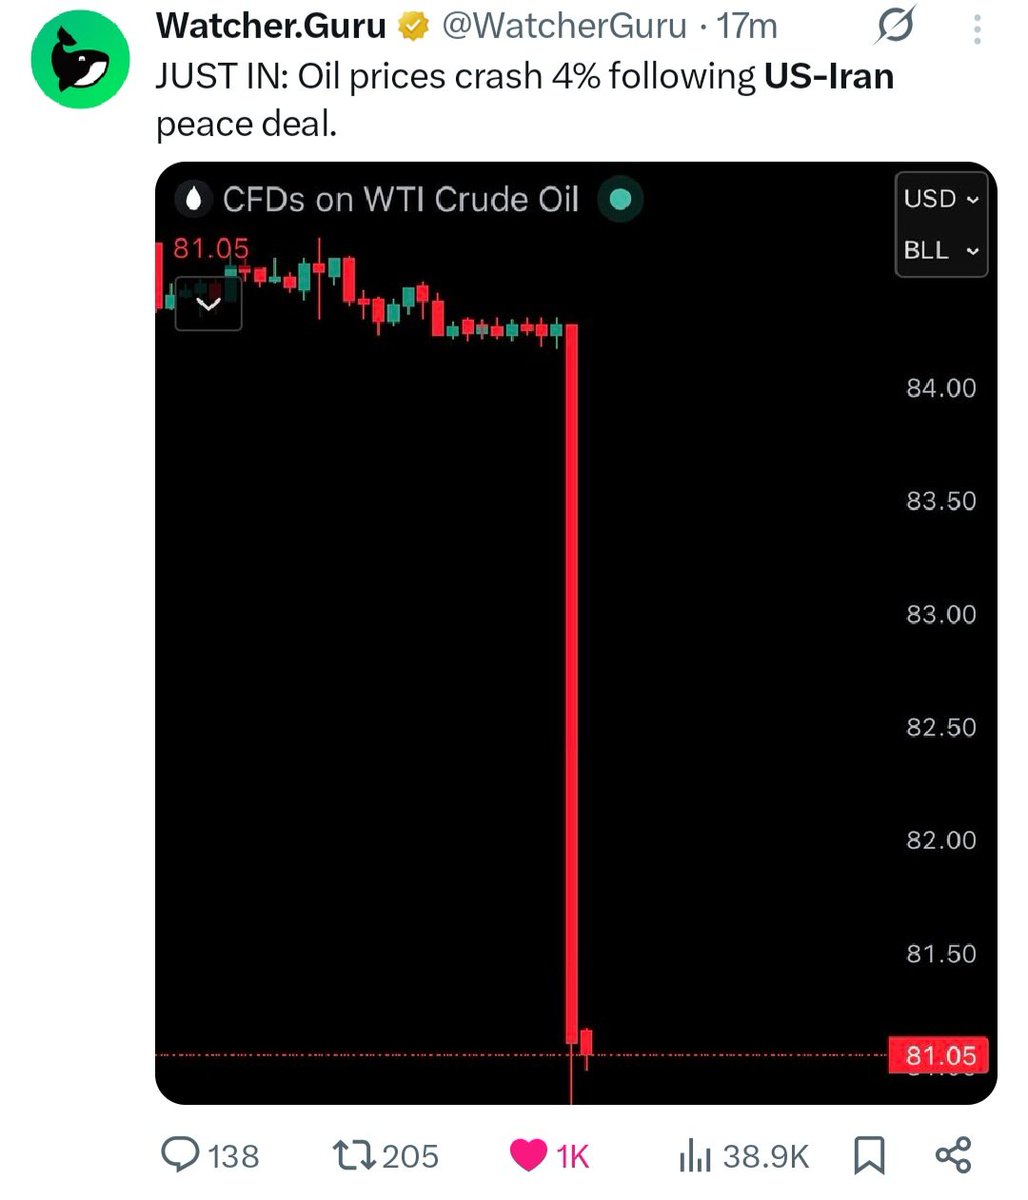
He's talking about timeframes for the midterm campaigns. Oil futures are already dropping, and gas will follow soon, even more than they already dropped.
1
2
×͜× zee ໑̣ HAPPY PRIDE! 🏳️🌈🩵 retweeted

dan and phil vs giving extremely vague timeframes to their neurodivergent audience
12
76
635

Bitcoin is currently rising due to the end-of-war news.
However, rather than it being due to the end of the war, Bitcoin had simply dropped significantly in a short period.
Since even the 12-hour and daily timeframes were oversold, a short-term rebound could be seen as natural, even without the end-of-war news.
My trading style is very clear.
I identify the trend, determine the direction, and maintain that perspective until the criteria that defined that direction are breached.
If those criteria are breached, I shift to a neutral stance, establish new criteria, and trade accordingly.
This is how I look for evidence and make an effort to trade based on clear-cut criteria.
The current situation is exactly that.
First, because I judged the upper boundary of the white descending channel to be a trap, I will naturally maintain my bearish view unless it breaks out of the channel.
Even before it entered the channel, I previously shared the possibility that a retest of the upper boundary would take place to cool down the indicators after entry.
I also mentioned that if it drags sideways and hits the upper boundary of the channel, the price at the bottom of the channel would drop even lower.
People are talking about a "double bottom," a "real trend reversal," or an "altcoin bull market," but the current position isn't even at 80K–90K...
It dropped from 82K to 59K and is now at 65K; it’s only natural to expect a rebound of this scale.
Of course, it could go up further due to the end-of-war news.
However, my primary criterion remains unchanged: the white channel.
Even if the trap in that channel fails, my medium- to long-term bearish view won't instantly turn bullish. My stance would simply shift to neutral.
Ultimately, until it breaks out above the yellow channel, my bearish view remains unchanged.
My thoughts are clear.
I have said before that the drop was not caused because of the war.
And I sincerely hope the war ends quickly. But will it pump immediately just because the war is over? I don't believe the market moves that simplistically.
That's why I hope for a swift end to the war so that the market can move according to the charts.
I shared during the live stream that I expect a sharp drop between late June and early July.
I just hope the war ends quickly this week, and things play out from next week onward exactly as I anticipated.
2


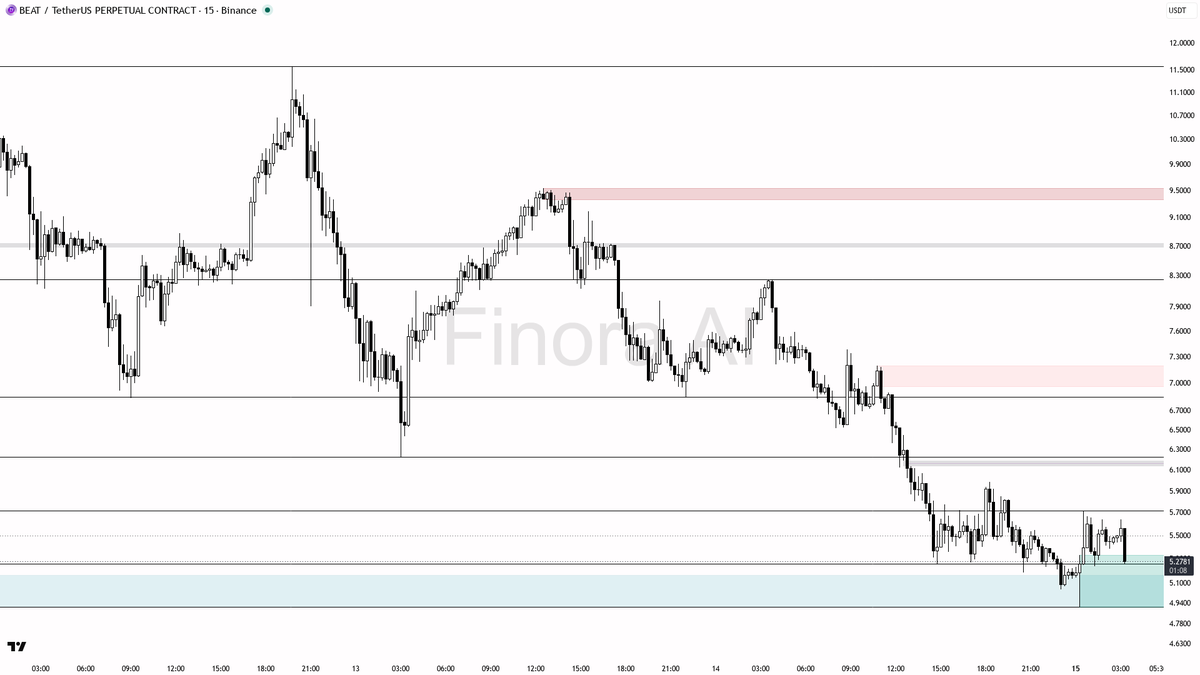
💔 5.1% Dump Detected on $BEAT , is it time to short?
- After such a sharp dump and a strong volume spike, further immediate downside is less likely unless 5.25 snaps. I expect some choppy range behavior or a relief bounce toward 5.47–5.71 before any further strong move.
- For a high-probability trade, I’d wait for price to push up into the 5.47–5.71 resistance zone and look for a clear bearish reversal (like a pin bar, bearish engulfing, or lower high with momentum stalling) for a short entry. Entry: 5.47–5.71 area. Take profit: 5.25, then 5.00 if momentum picks up. Stop-loss should be above the most recent swing high or wherever the trend would clearly flip back up.
- If price instead quickly sweeps below 5.25 or even 5.00, but then snaps back up with strong lower timeframe reversal patterns (hammer, engulfing, or major bullish divergence), look for a scalp long toward 5.47. Enter only after a confirmed reclaim, and keep stops below the swing low.
- Confirmation for shorts: clear rejection at resistance zone, strong bearish candle, or a break down with renewed volume. Confirmation for longs: liquidity sweep below support, strong bullish reversal on lower timeframes, or a break and hold back above 5.25 with momentum shift.
- If price explodes above 5.72 and holds, bearish bias is invalid and next target would be 5.82 and then 6.22.
📝 This is not investment advice, only an educational report. Always wait for confirmation and manage risk carefully, especially after a volatile move like this!
📊 Get detailed free analysis of any coin on any timeframe you want. Try Finora AI - Your Trade Buddy for free → tinyurl.com/FinoraBot
56
Geoff Payne retweeted

Australia must halve clean energy development approval timeframes: report: A new report by the Centre for Policy Development calls for renewable energy development approval timeframes to be halved if Australia is… dlvr.it/TSzZWq #BatteryStorage #Australia #PVProjects

1
2
36
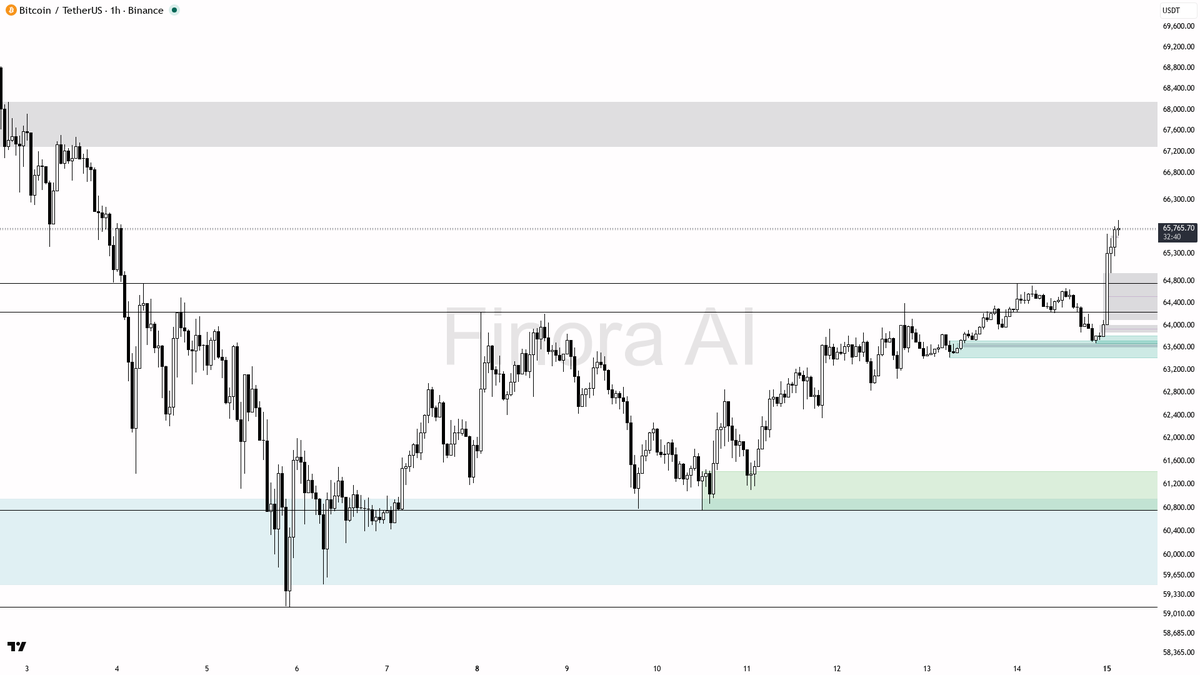
sure thing! let's take a look at what $BTC #BTCUSDT is doing on the 1h chart 👀
- expecting price to RISE from here, bullish bias remains strong as current price (65733) is above all key support/demand levels and has just broken out from consolidation
- next upside targets: 66649, 67195, and 67407—these are the next likely resistance/supply zones to be reached
- ideal long entry would be on a pullback toward 65003-64762 zone, watching for bullish confirmation like a pin bar, bullish engulfing, or strong rejection wick on lower timeframes
- take profit can be set in stages at 66649 and 67195, scaling out as those levels approach
- bias flips to short only if price closes below 64328 (the most recent swing low area)—in that case, expect a drop to 63566 or even 62829
- for now, all momentum and SMC signals favor continuation upward 🚀
not investment advice, educational report only
📊 Need more detailed analysis, trade signals?
Try Finora AI Telegram Bot for free - t.me/FinoraEN_Bot
40


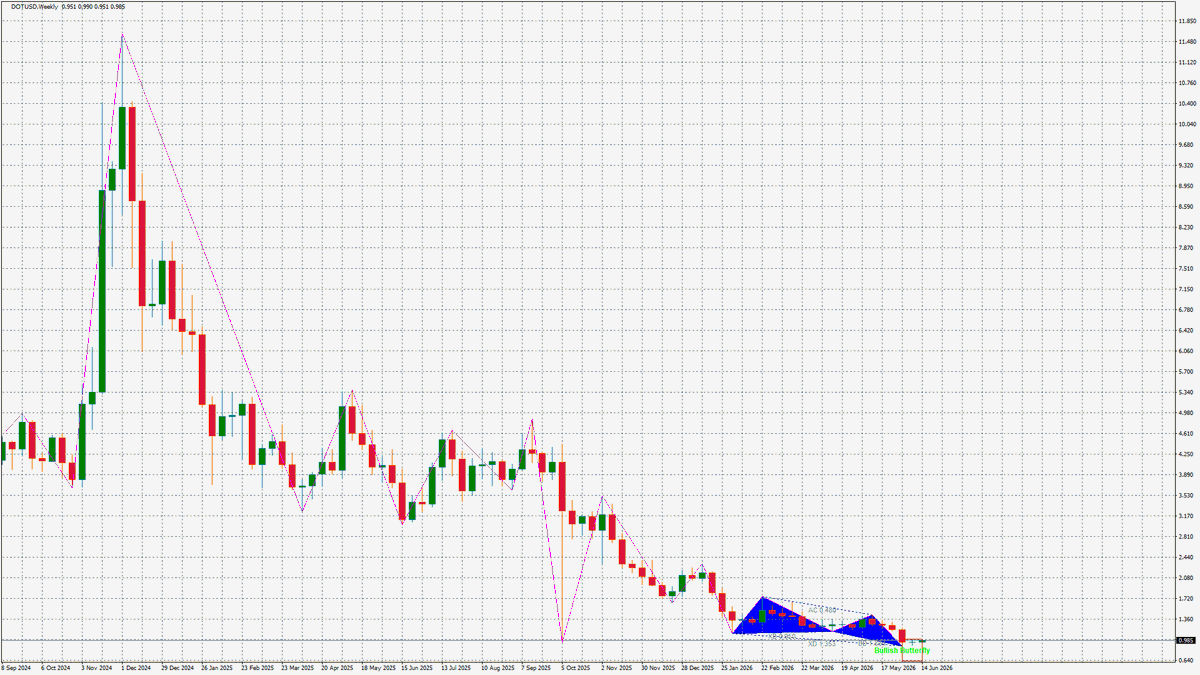
solana:orcaEKTdK7LKz57vaAYr9QeNsVEPfiu6QeMU1kektZE has set up nicely on 4h and 8h timeframes, good for entries any time with normal stop loss and TP1/ TP2 likely target for a quick day trade before retracing to retest the DTM EMA and then pushing higher into TP4
Good coin for OCO trades with big wicks, Solana ecosystem for self-custodial trading or on major CEXs as well so great flexibility 🏆
🚨 LONG: ORCA/USDT 🚨
——————————
> Entry Blue Line: 1.184 / 1.238
> Sell: 1.356 / 1.516 / 1.692 / 1.983 / 2.177 / 2.423
> Stop loss: 1.082
R/R - 12.27
Allocation Limit ( /- 2%)
BINANCE - $25,594 / $30,228
(Subject to Change)
✅ Profit: 14.54% - 104.61%
Timeframe: Next Days (14 - 45 Days)
Signal provider: Day Trade Masters
Powered by @bitcointaf

1
16
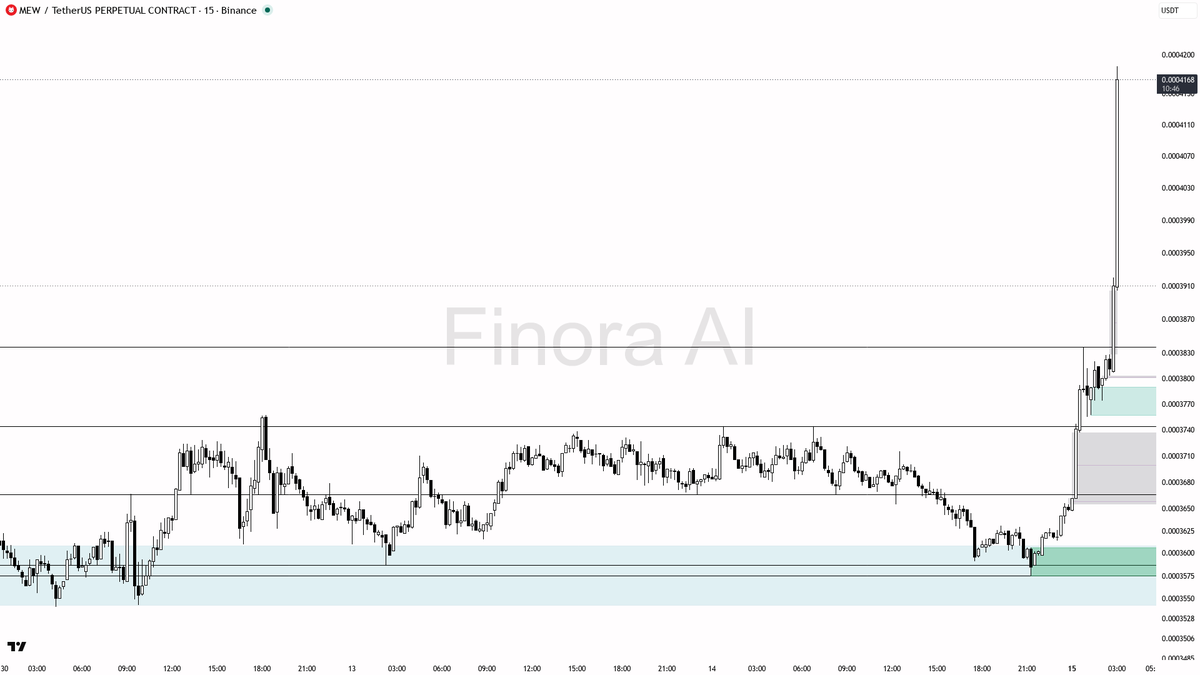
🌟 $MEW pumping 5.6% with 9.0x abnormal volume
- With this kind of pump and volume, there’s a high probability of a short-term retracement or pullback as the market digests the move and late buyers take losses. I do NOT expect this parabolic move to sustain immediately without some form of correction.
- Look for a potential long opportunity only if price pulls back to the 0.0003744 or 0.0003575 zones, shows clear reversal signals, and reclaims those levels on strong volume. If confirmation appears, a long entry could be considered with a first target at the recent high around 0.0004179, and a second target at 0.0004400. Stop-loss should be set at a swing low or just below the demand zone entered.
- If the price fails to hold 0.0003575 on any pullback and closes below, the move is more likely to unravel lower, and I would avoid longs altogether until further accumulation signs appear at lower levels.
- If you see a reversal pattern (like an engulfing or a strong pin bar) at one of the demand/FVG levels and price starts making higher lows on lower timeframes, this would be the best confirmation for a possible continuation.
- Remember, after such a dramatic move, patience is key. Never enter on a green candle at the top of a vertical spike; wait for the market to show its hand!
📝 This is not investment advice, only an educational report. Always wait for confirmation before entering, especially after high-velocity moves and volume anomalies. Stay safe and smart! 🚀
📊 Get detailed free analysis of any coin on any timeframe you want. Try Finora AI - Your Trade Buddy for free → tinyurl.com/FinoraBot
87

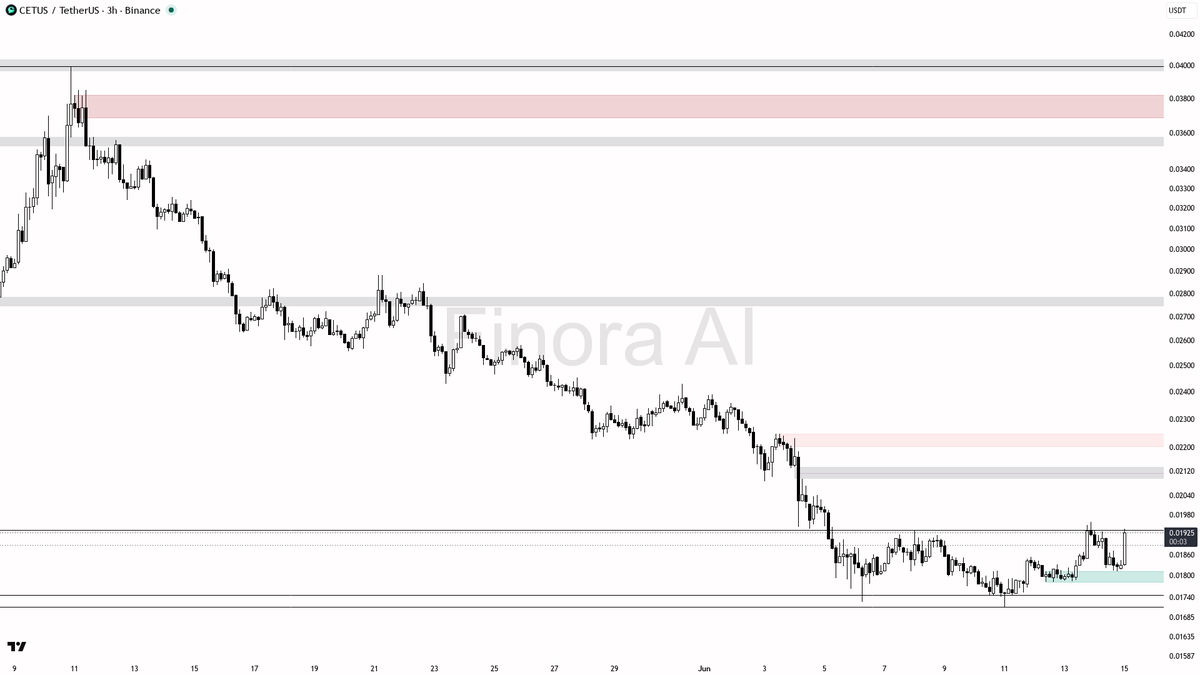
$CETUS 3h Update
- I currently expect a short-term bounce or reversal as bulls have stepped in strongly at the 0.01811–0.01853 demand zone. If this demand continues to hold and you see confirmation with bullish price action, the price is likely to rise first toward 0.01871 and then 0.01932.
- If 0.01932 is reclaimed and held, the next likely destination is the imbalance area near 0.02010.
- If, however, price breaks and closes below 0.01811 with strong bearish volume, then a retest of the most recent swing low at 0.01714 is likely. A sharp manipulation below 0.01714 followed by a fast bullish reversal would be a strong buy signal.
- If you want to take a trade, wait for confirmation at these levels: bullish engulfing or pin bar at support, or a break and retest of 0.01932 with bullish continuation on the lower timeframes.
- My bias will shift to bearish continuation if price closes strongly below 0.01714 and does not quickly recover.
📊 Turn charts into clear trade insights.
Try Finora AI free → tinyurl.com/FinoraBot
1
69

$BTC And we have a breakout instead. I was wrong expecting a pullback first. This pump was triggered by Trump’s statement about signing a peace deal with Iran. However, it could quickly change if they reject the claims, as they often do.
In any case if we focus on the chart, it’s a clean breakout on low timeframes, and a bullish weekly close with a bullish divergence. Expecting 70-72k next.


6
16
1,382


Updated my rolling vwap indicator to 3.1 today on Tradingview. Added various tiers and reasoning for or against opening trades at the extreme bands. Check it out, my favorite timeframes are 3 min, 3 hrs, 3 days. With the bar length the math just works.
15

Add 8-10 years on top of whatever Elon promises. Don’t get me wrong - he delivers. But never near the initial timeframes he claims.
1
1
28

daily chart= momentum gone. weekly chart = looks even worst. aggressive distribution on both timeframes. I see it continue down overall. There might be a slight recovery (as suggested by 10 min chart) before it head down again. The rug pull risk is too high to take a chance. My thoughts. NFA
1
1
17